Time series of global min/max/mean including "reasonable" ranges.
Asr: Timeseries
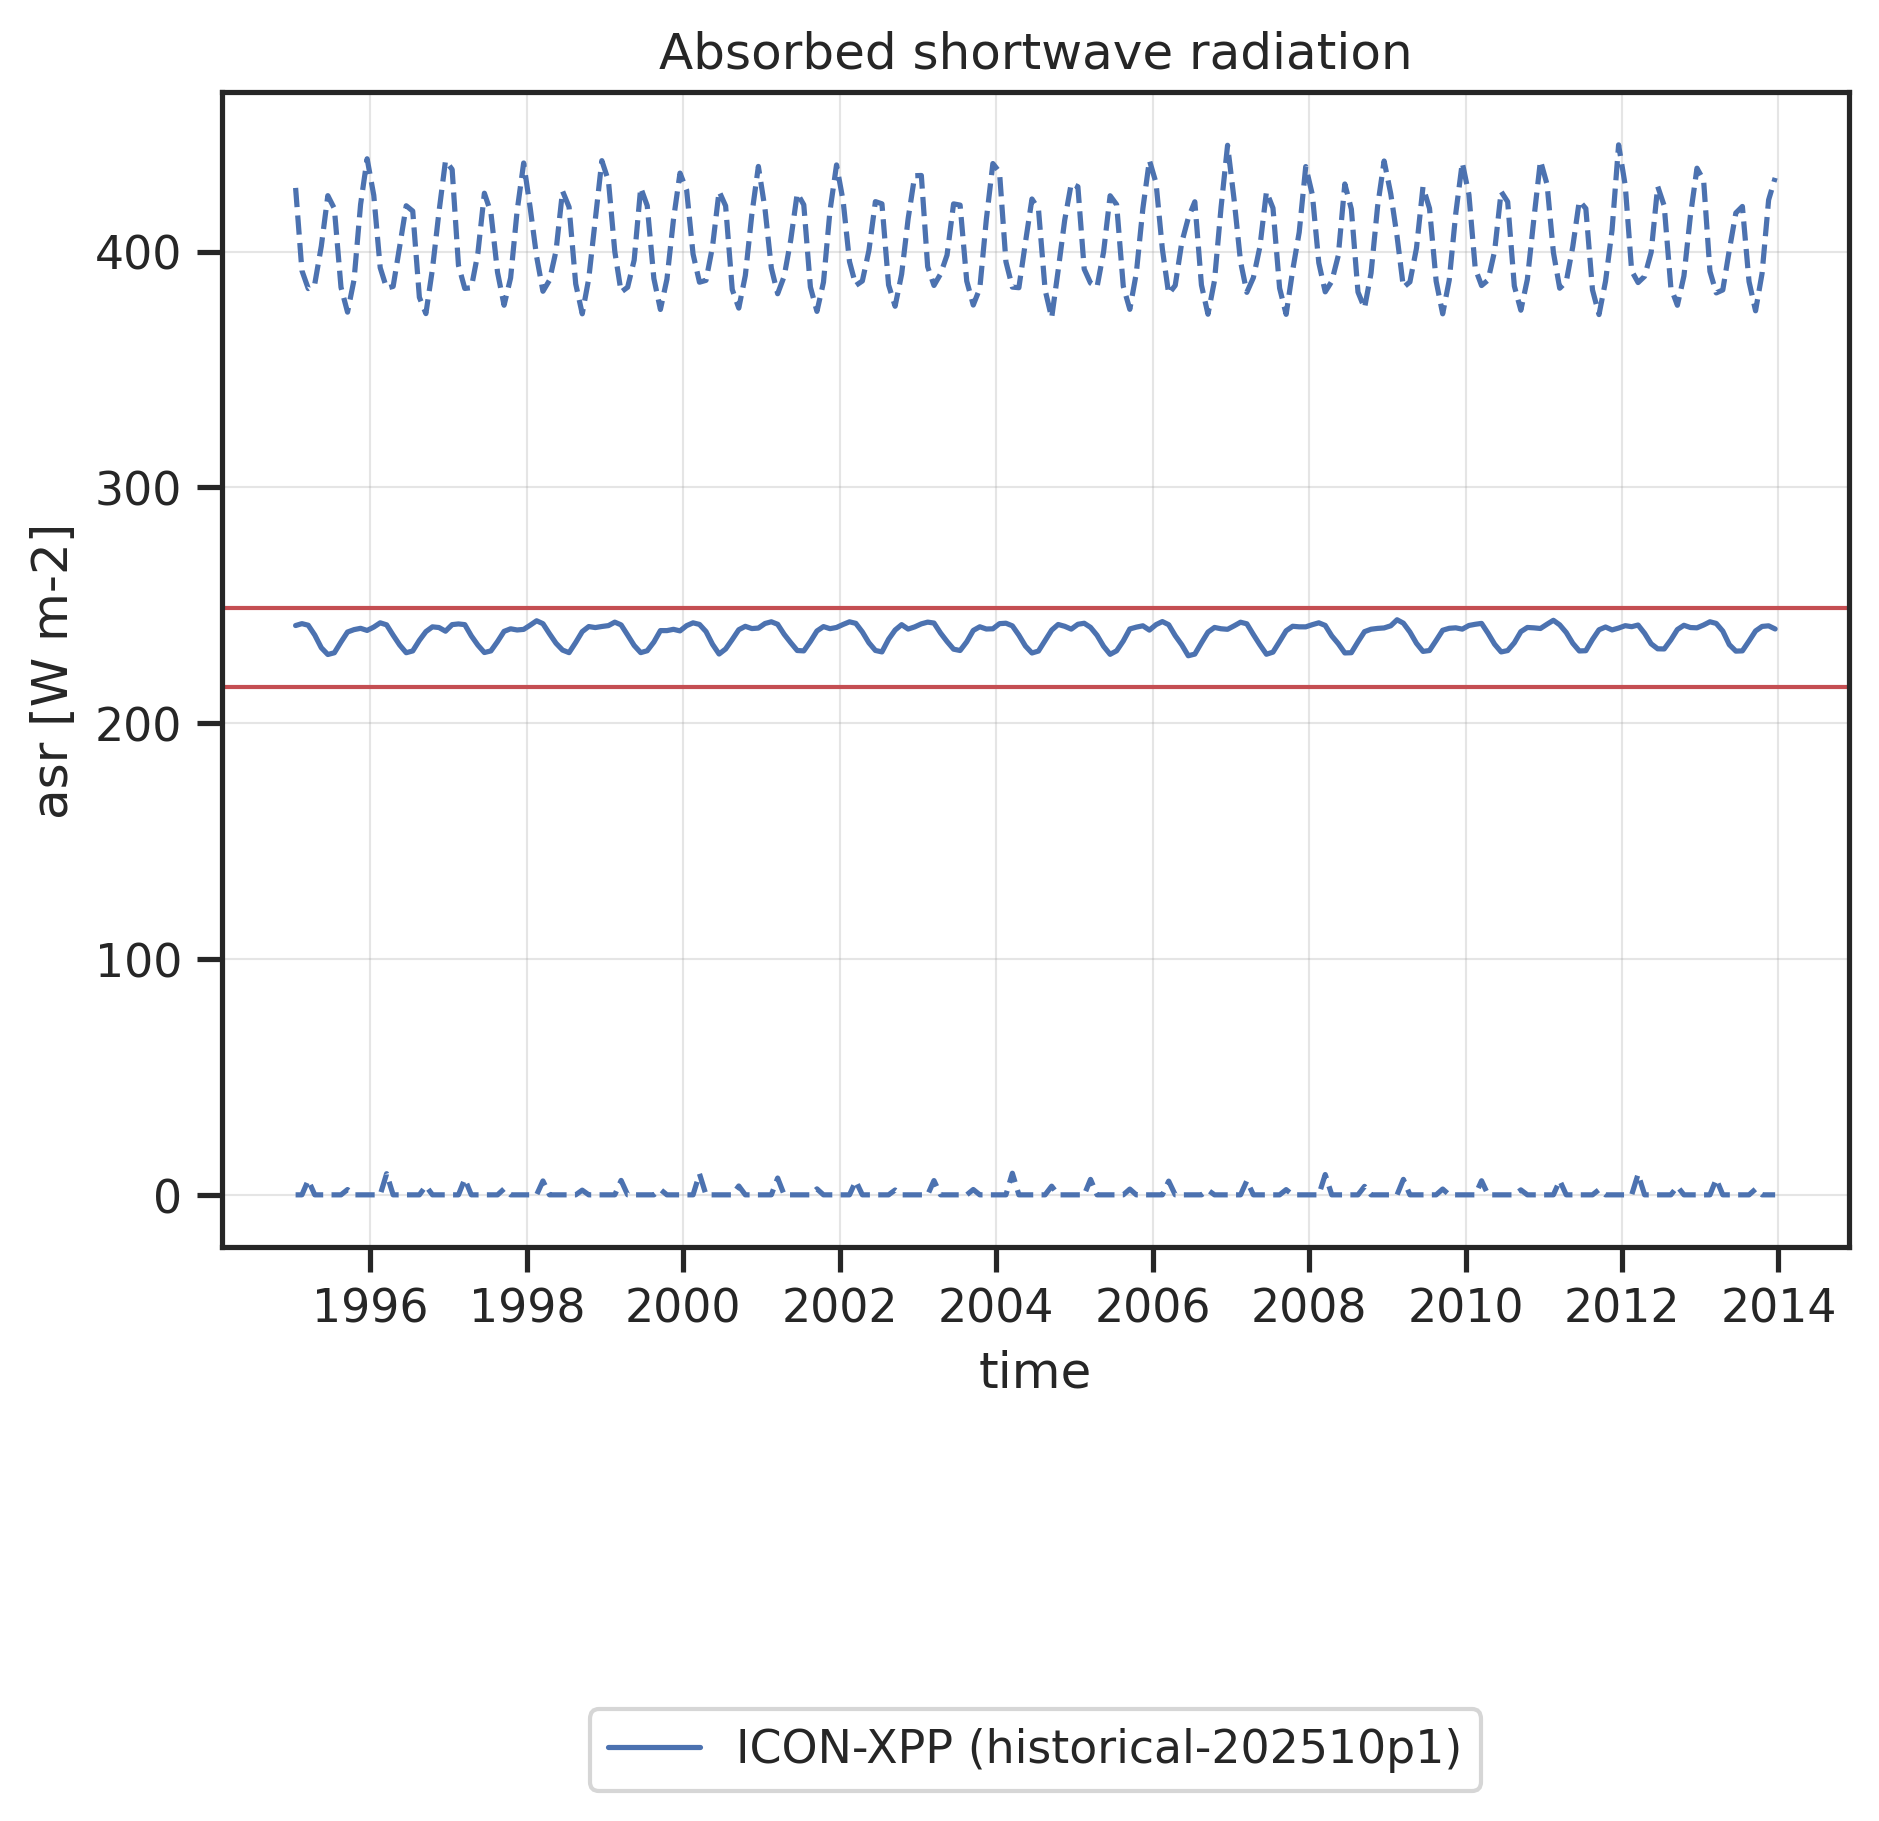
Time series of global mean (solid line) and global minimum/maximum (dashed lines) Absorbed shortwave radiation. Red horizontal lines show "reasonable" ranges for the global mean calculated from minimum and maximum global mean values found in reference datasets (observations, reanalyses) across all months and all reference datasets.
Time series of global mean (solid line) and global minimum/maximum (dashed lines) Absorbed shortwave radiation. Red horizontal lines show "reasonable" ranges for the global mean calculated from minimum and maximum global mean values found in reference datasets (observations, reanalyses) across all months and all reference datasets.
|
download |
references |
extra data citation |
provenance
Clivi
Time series of global min/max/mean including "reasonable" ranges.
Clivi: Timeseries
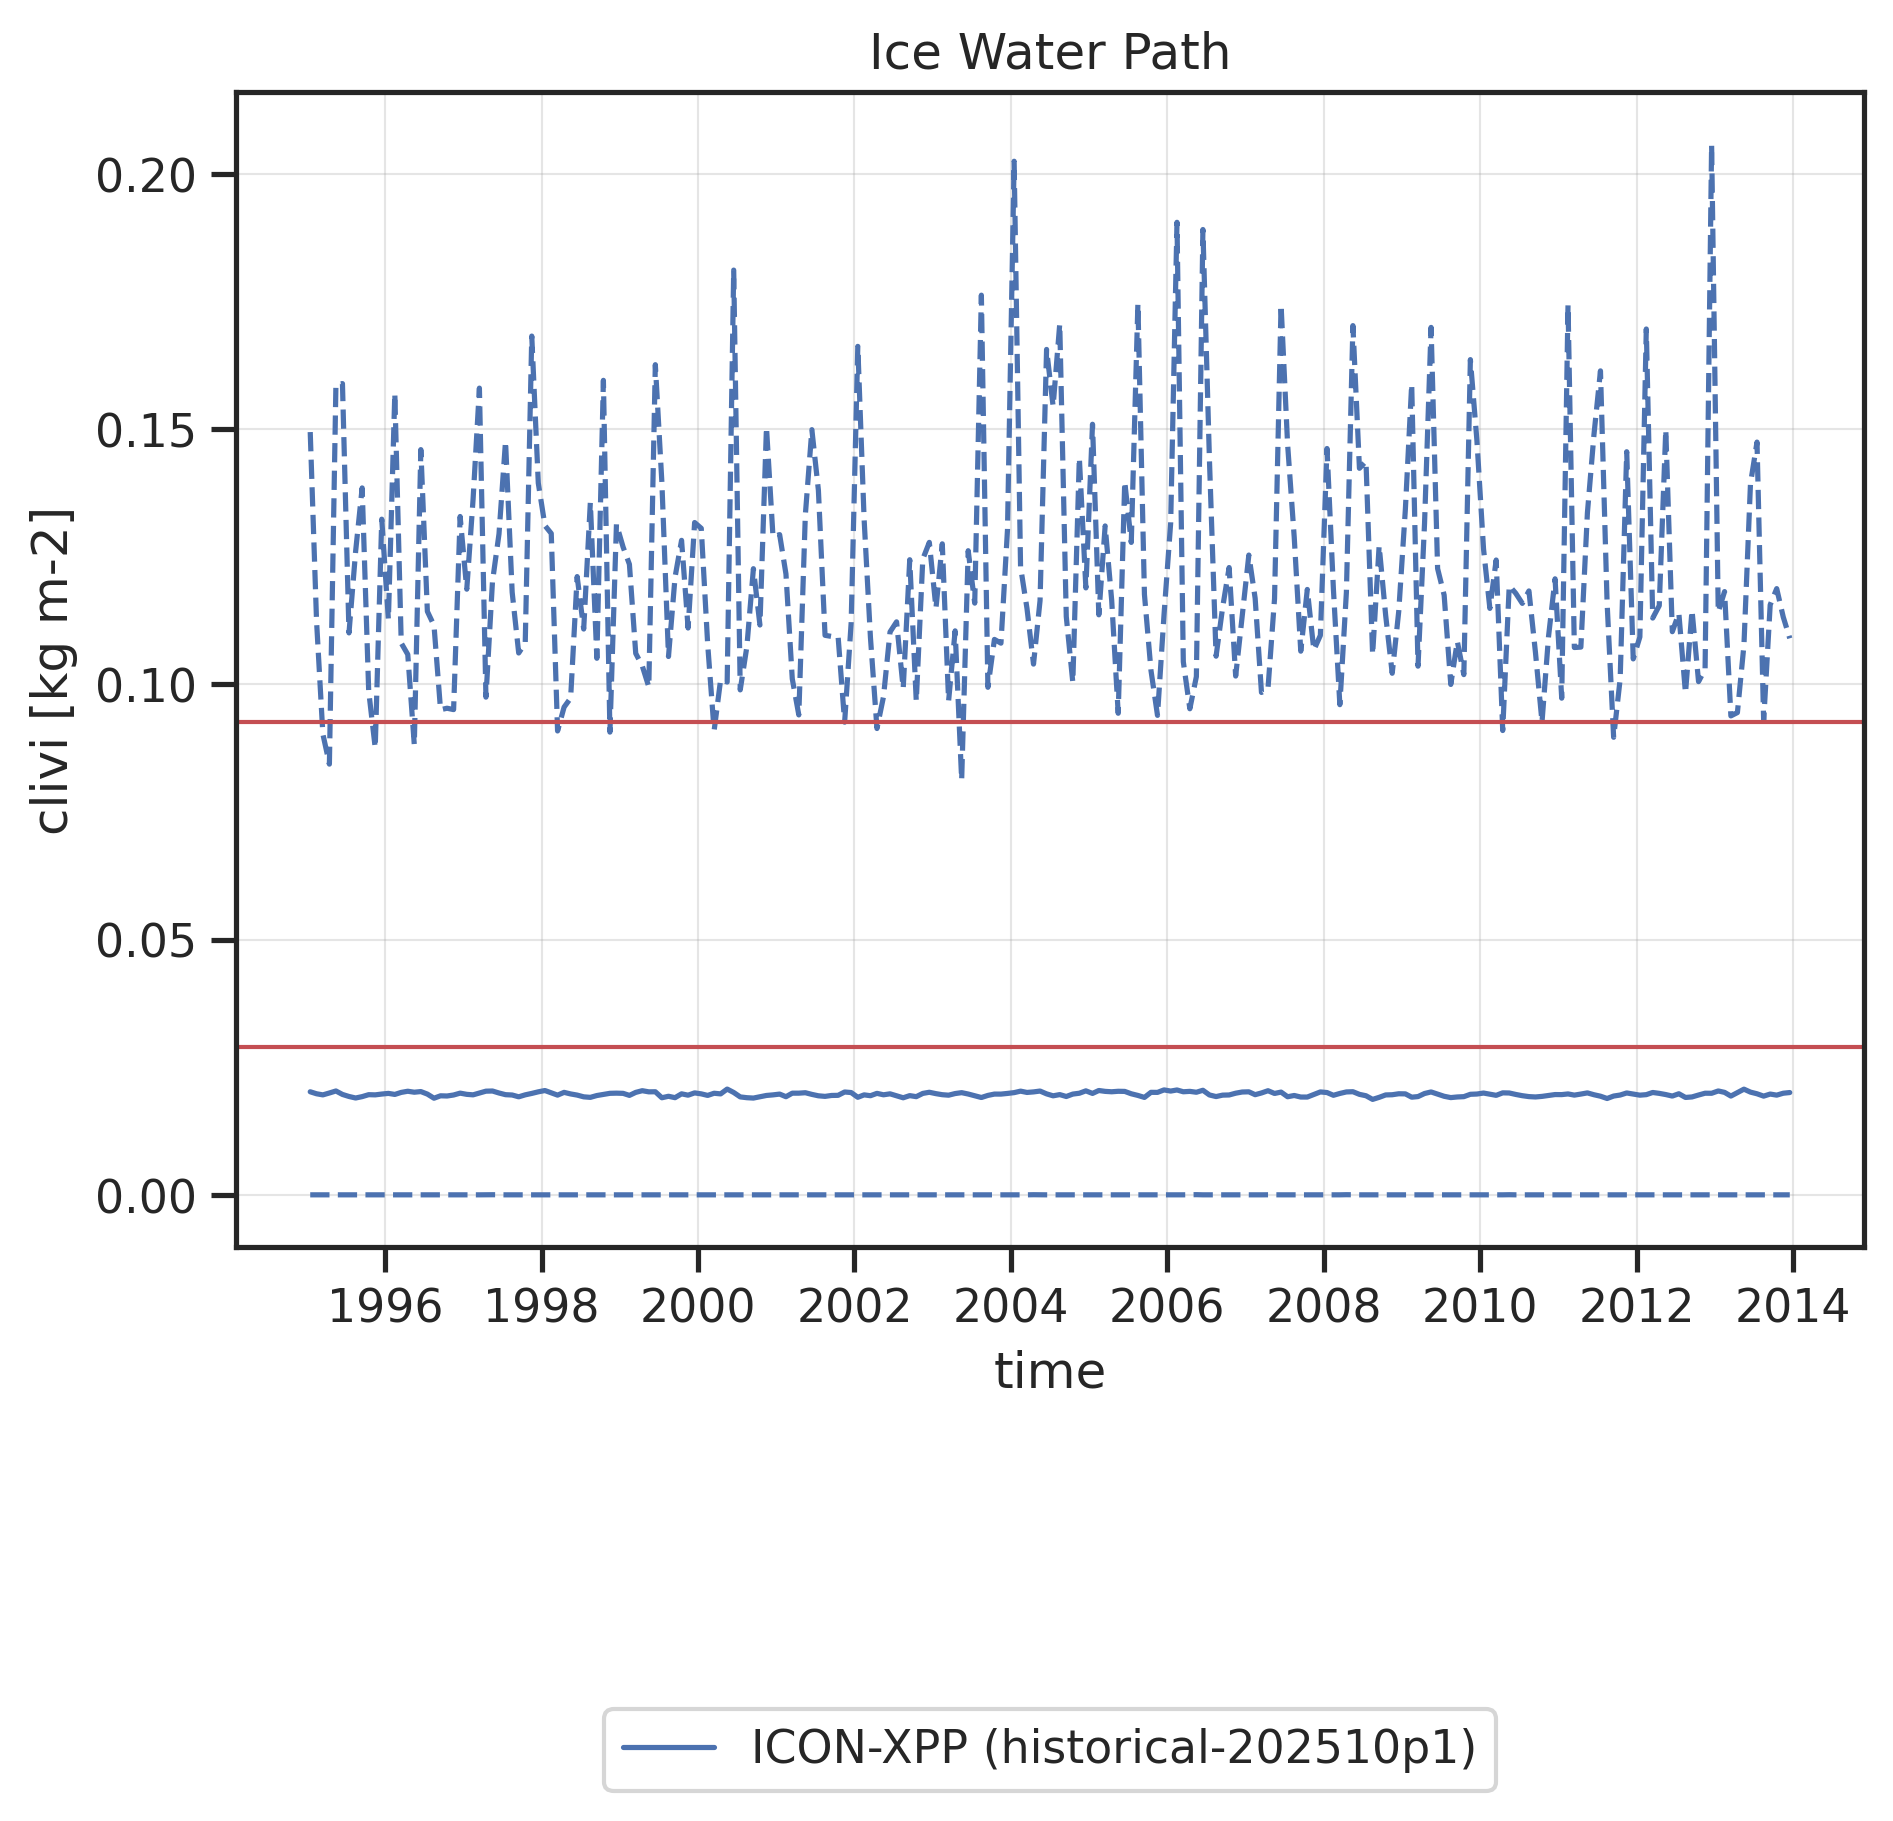
Time series of global mean (solid line) and global minimum/maximum (dashed lines) Ice Water Path. Red horizontal lines show "reasonable" ranges for the global mean calculated from minimum and maximum global mean values found in reference datasets (observations, reanalyses) across all months and all reference datasets.
Time series of global mean (solid line) and global minimum/maximum (dashed lines) Ice Water Path. Red horizontal lines show "reasonable" ranges for the global mean calculated from minimum and maximum global mean values found in reference datasets (observations, reanalyses) across all months and all reference datasets.
|
download |
references |
extra data citation |
provenance
Clt
Time series of global min/max/mean including "reasonable" ranges.
Clt: Timeseries
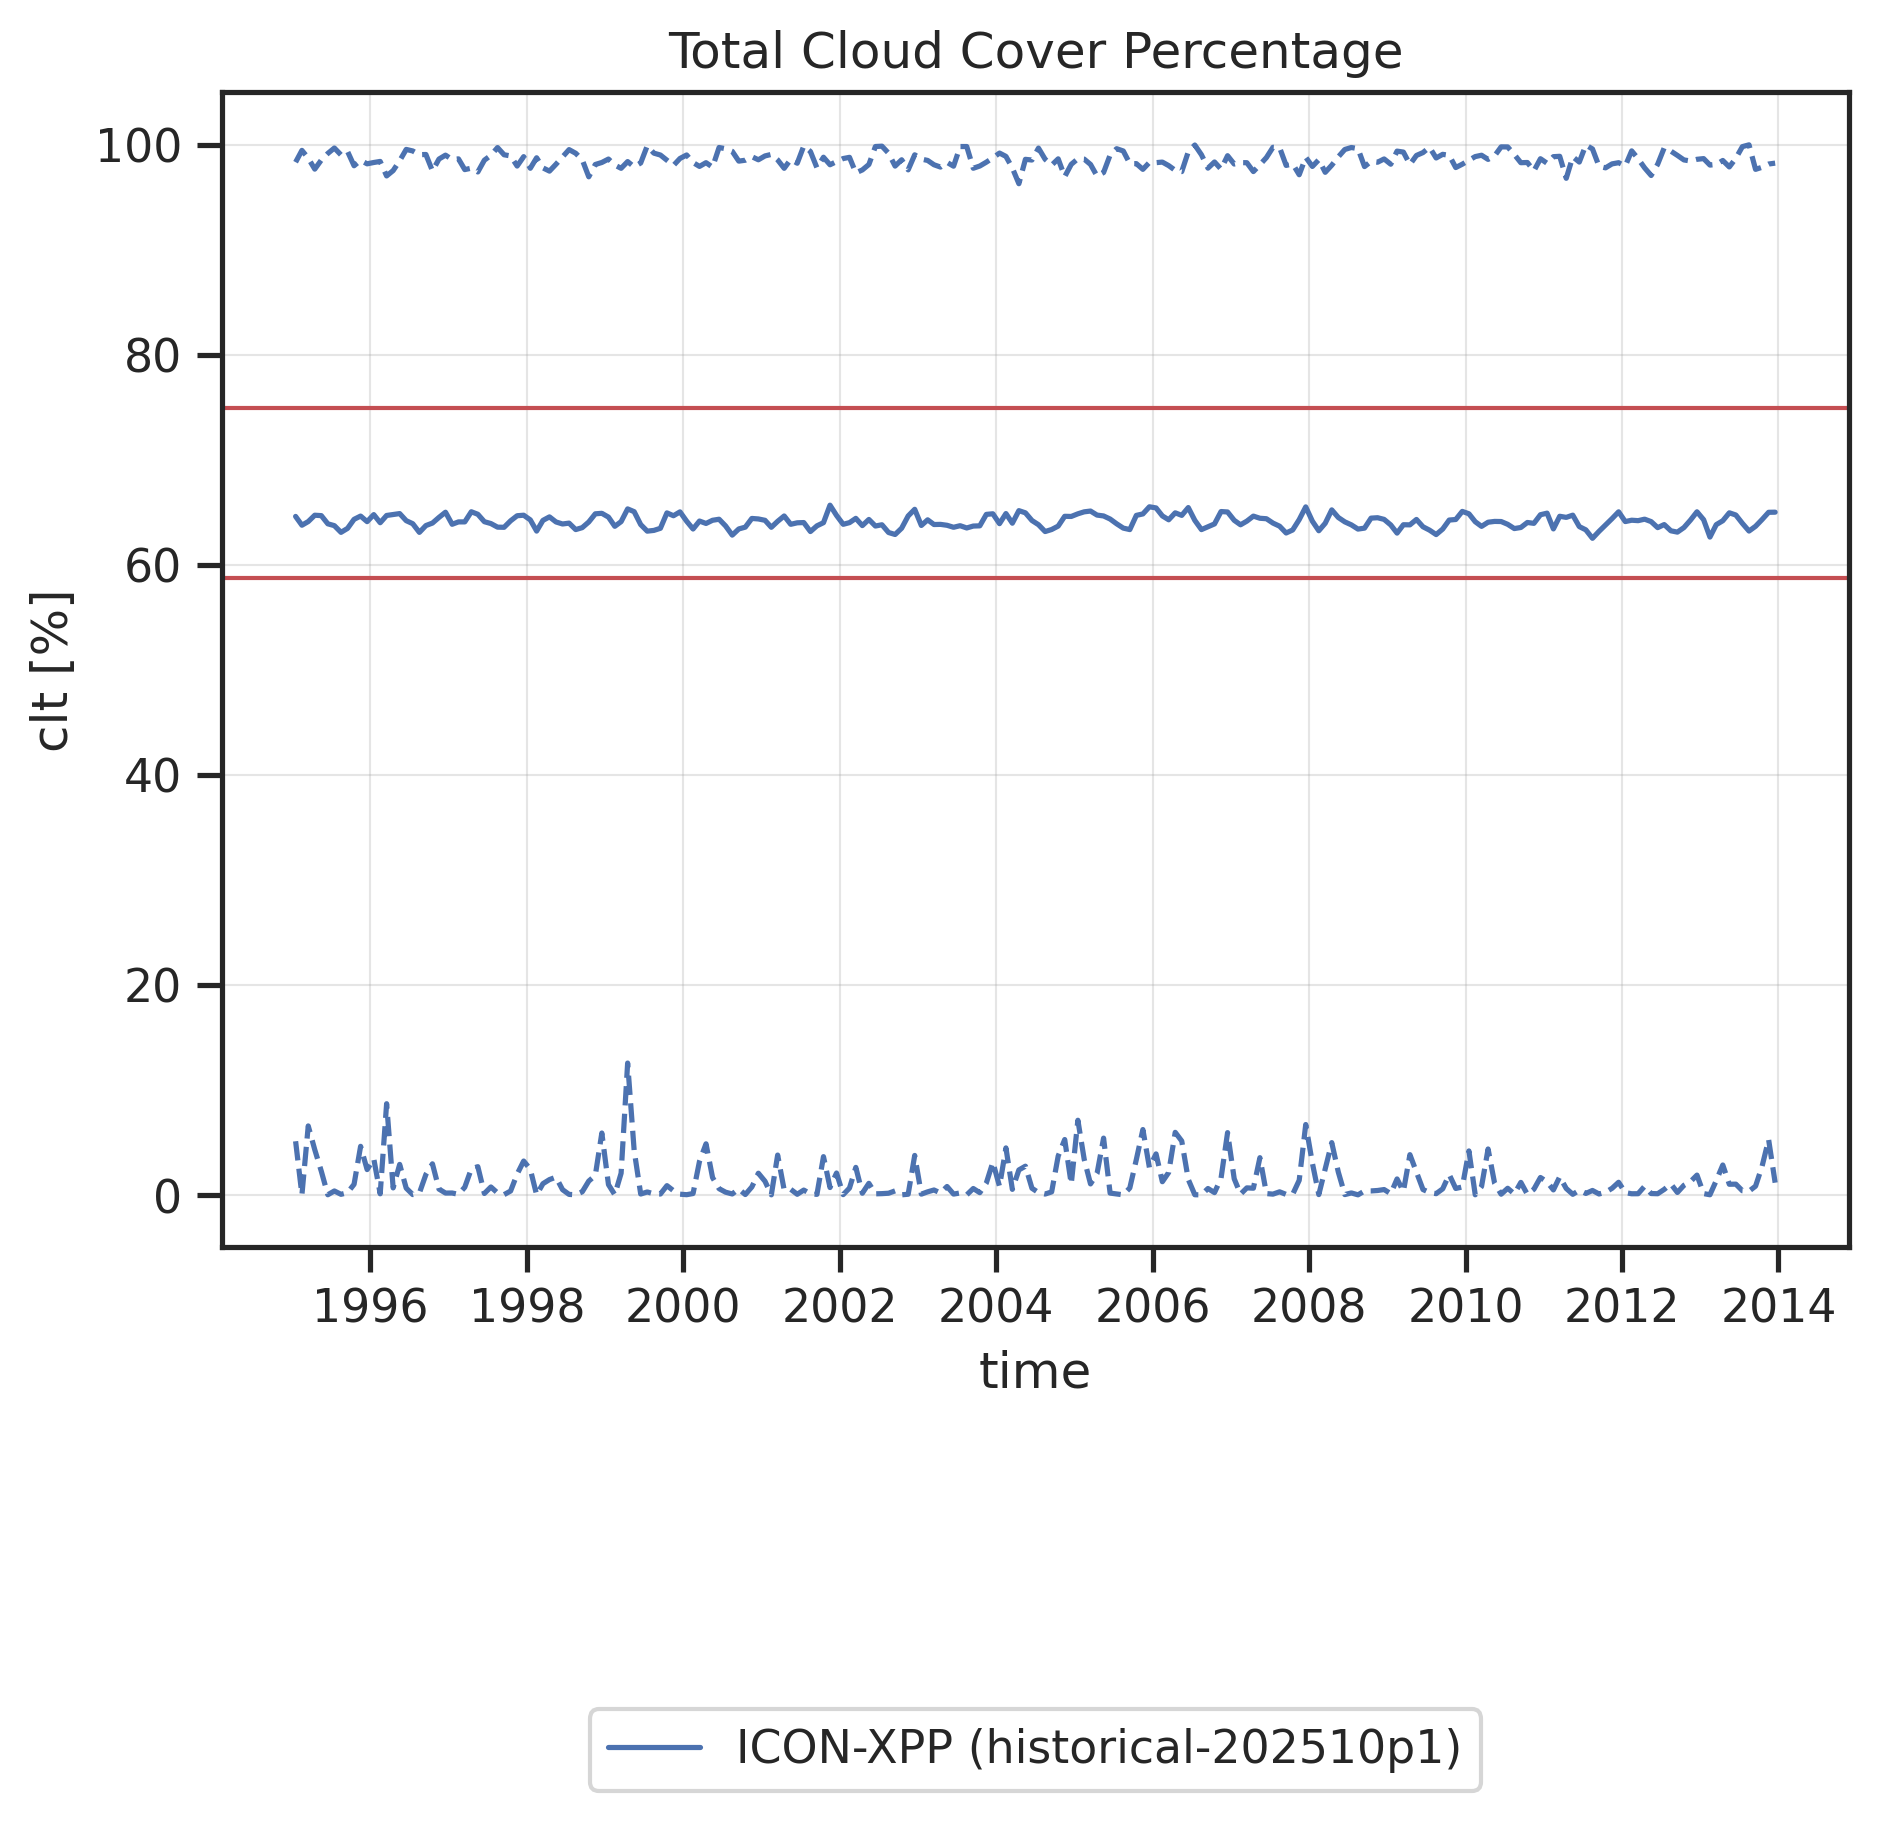
Time series of global mean (solid line) and global minimum/maximum (dashed lines) Total Cloud Cover Percentage. Red horizontal lines show "reasonable" ranges for the global mean calculated from minimum and maximum global mean values found in reference datasets (observations, reanalyses) across all months and all reference datasets.
Time series of global mean (solid line) and global minimum/maximum (dashed lines) Total Cloud Cover Percentage. Red horizontal lines show "reasonable" ranges for the global mean calculated from minimum and maximum global mean values found in reference datasets (observations, reanalyses) across all months and all reference datasets.
|
download |
references |
extra data citation |
provenance
Hfls
Time series of global min/max/mean including "reasonable" ranges.
Hfls: Timeseries
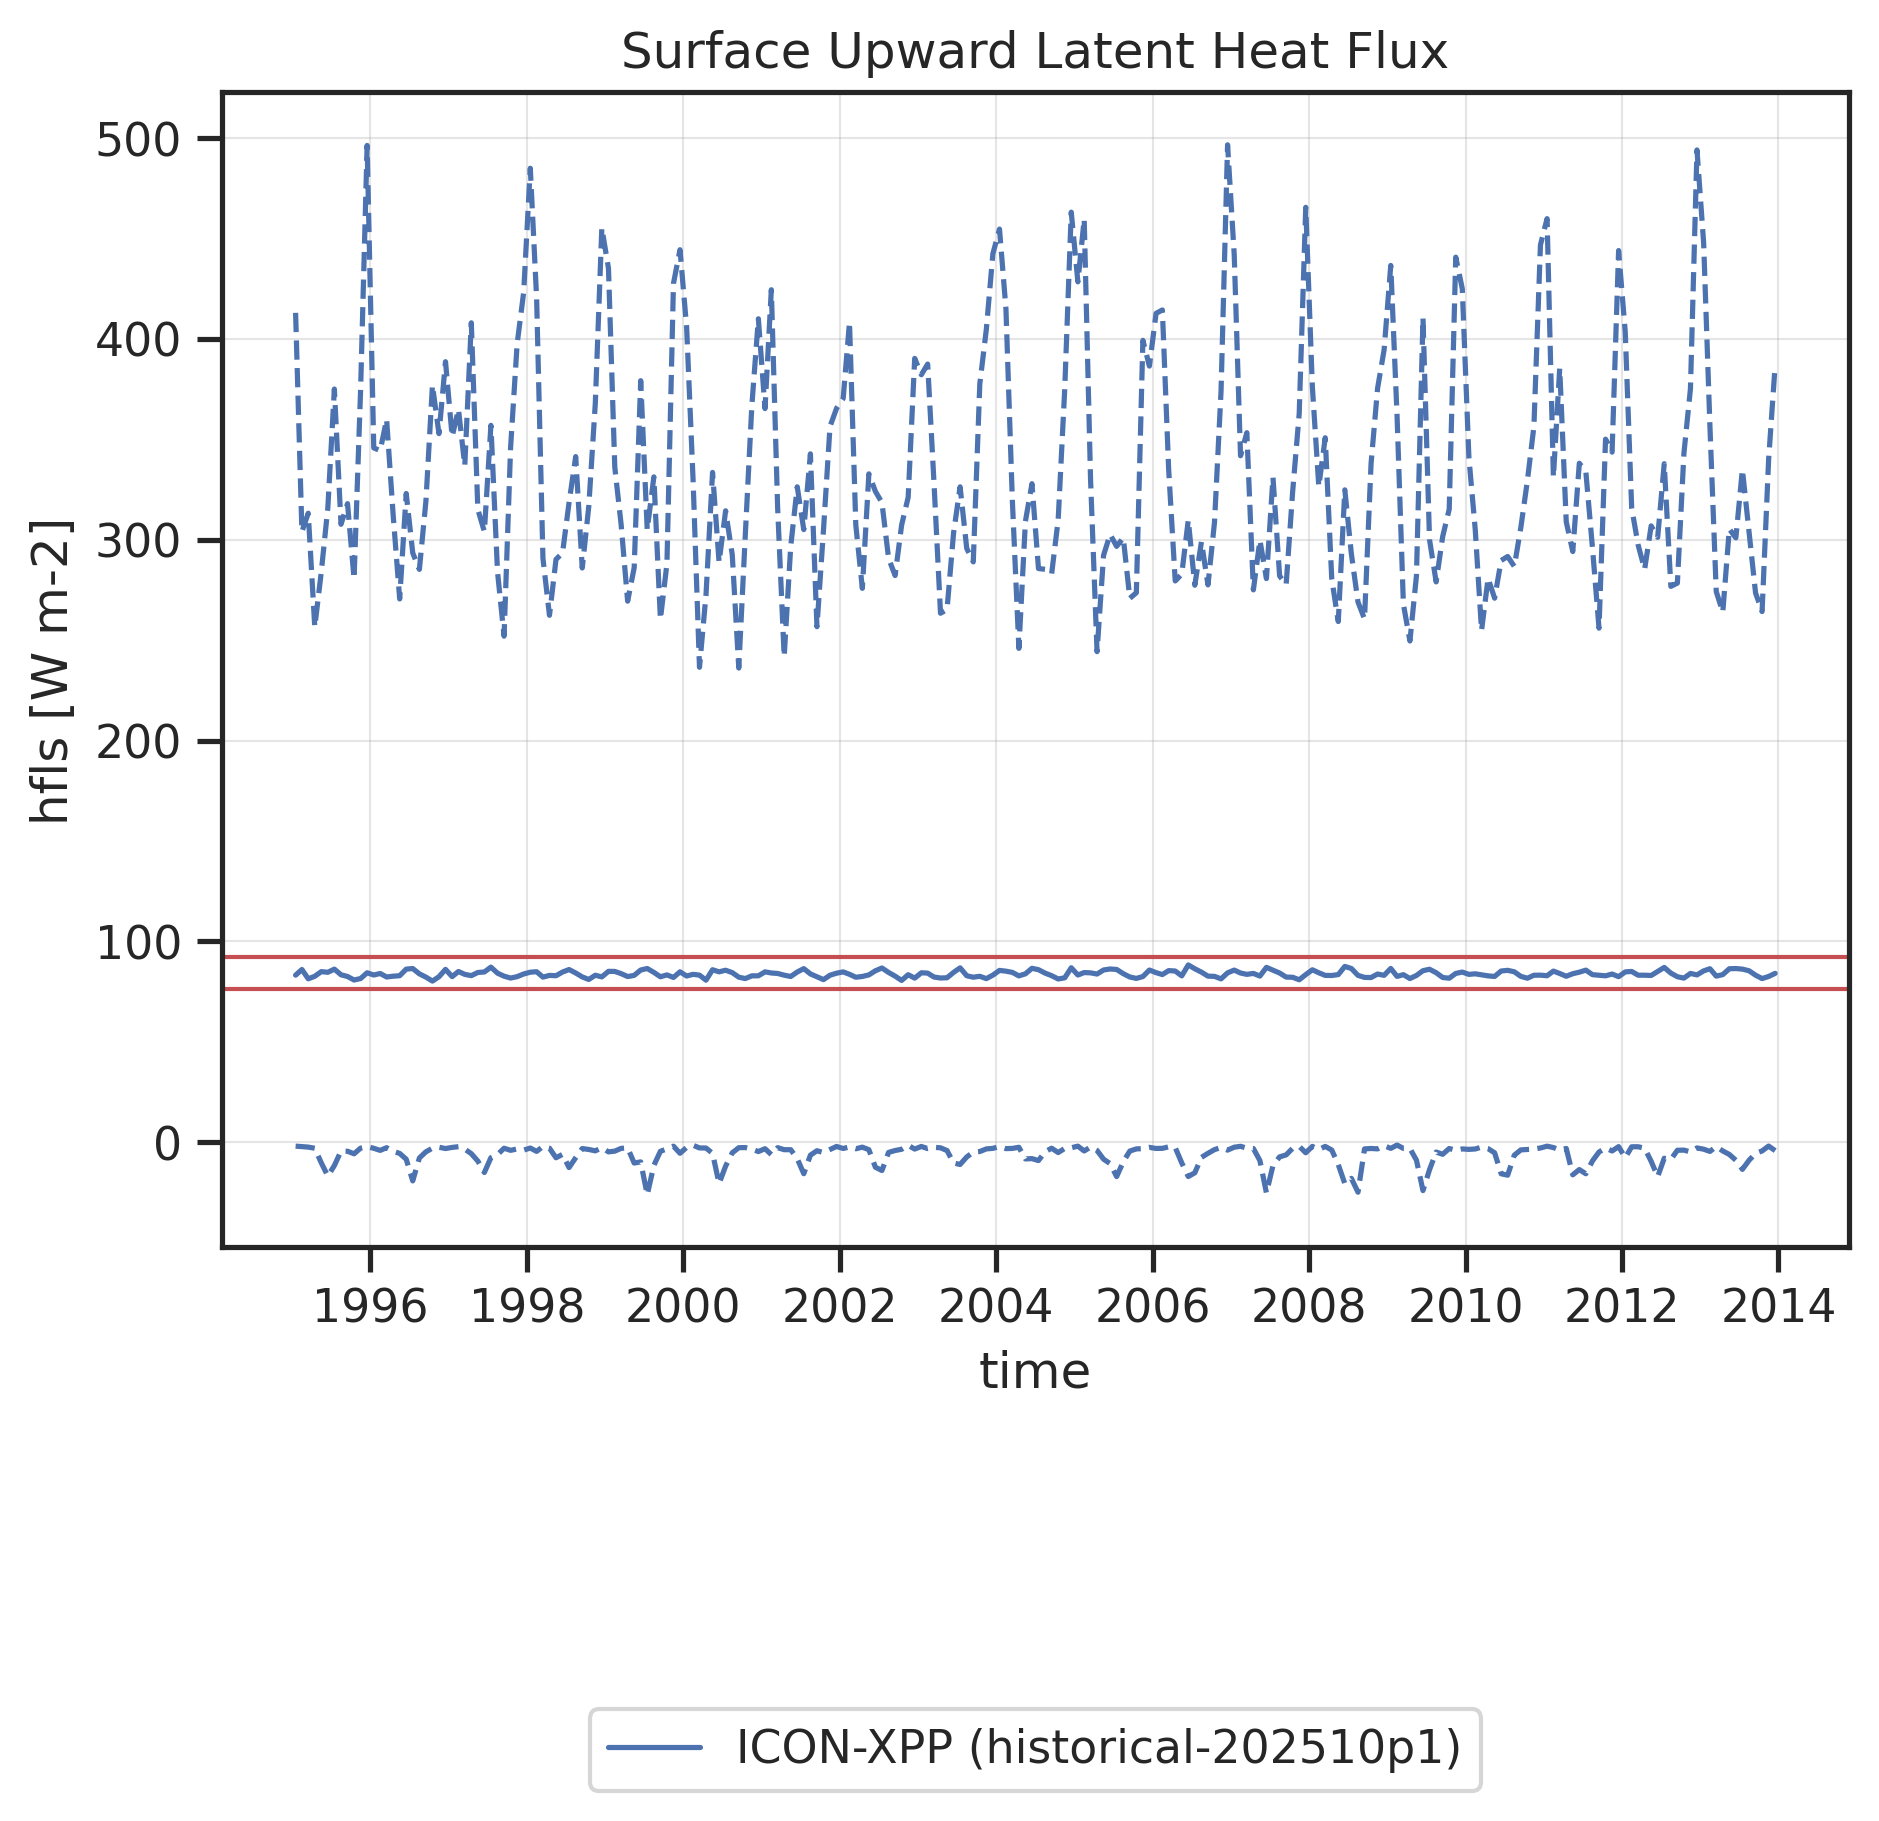
Time series of global mean (solid line) and global minimum/maximum (dashed lines) Surface Upward Latent Heat Flux. Red horizontal lines show "reasonable" ranges for the global mean calculated from minimum and maximum global mean values found in reference datasets (observations, reanalyses) across all months and all reference datasets.
Time series of global mean (solid line) and global minimum/maximum (dashed lines) Surface Upward Latent Heat Flux. Red horizontal lines show "reasonable" ranges for the global mean calculated from minimum and maximum global mean values found in reference datasets (observations, reanalyses) across all months and all reference datasets.
|
download |
references |
extra data citation |
provenance
Hfss
Time series of global min/max/mean including "reasonable" ranges.
Hfss: Timeseries
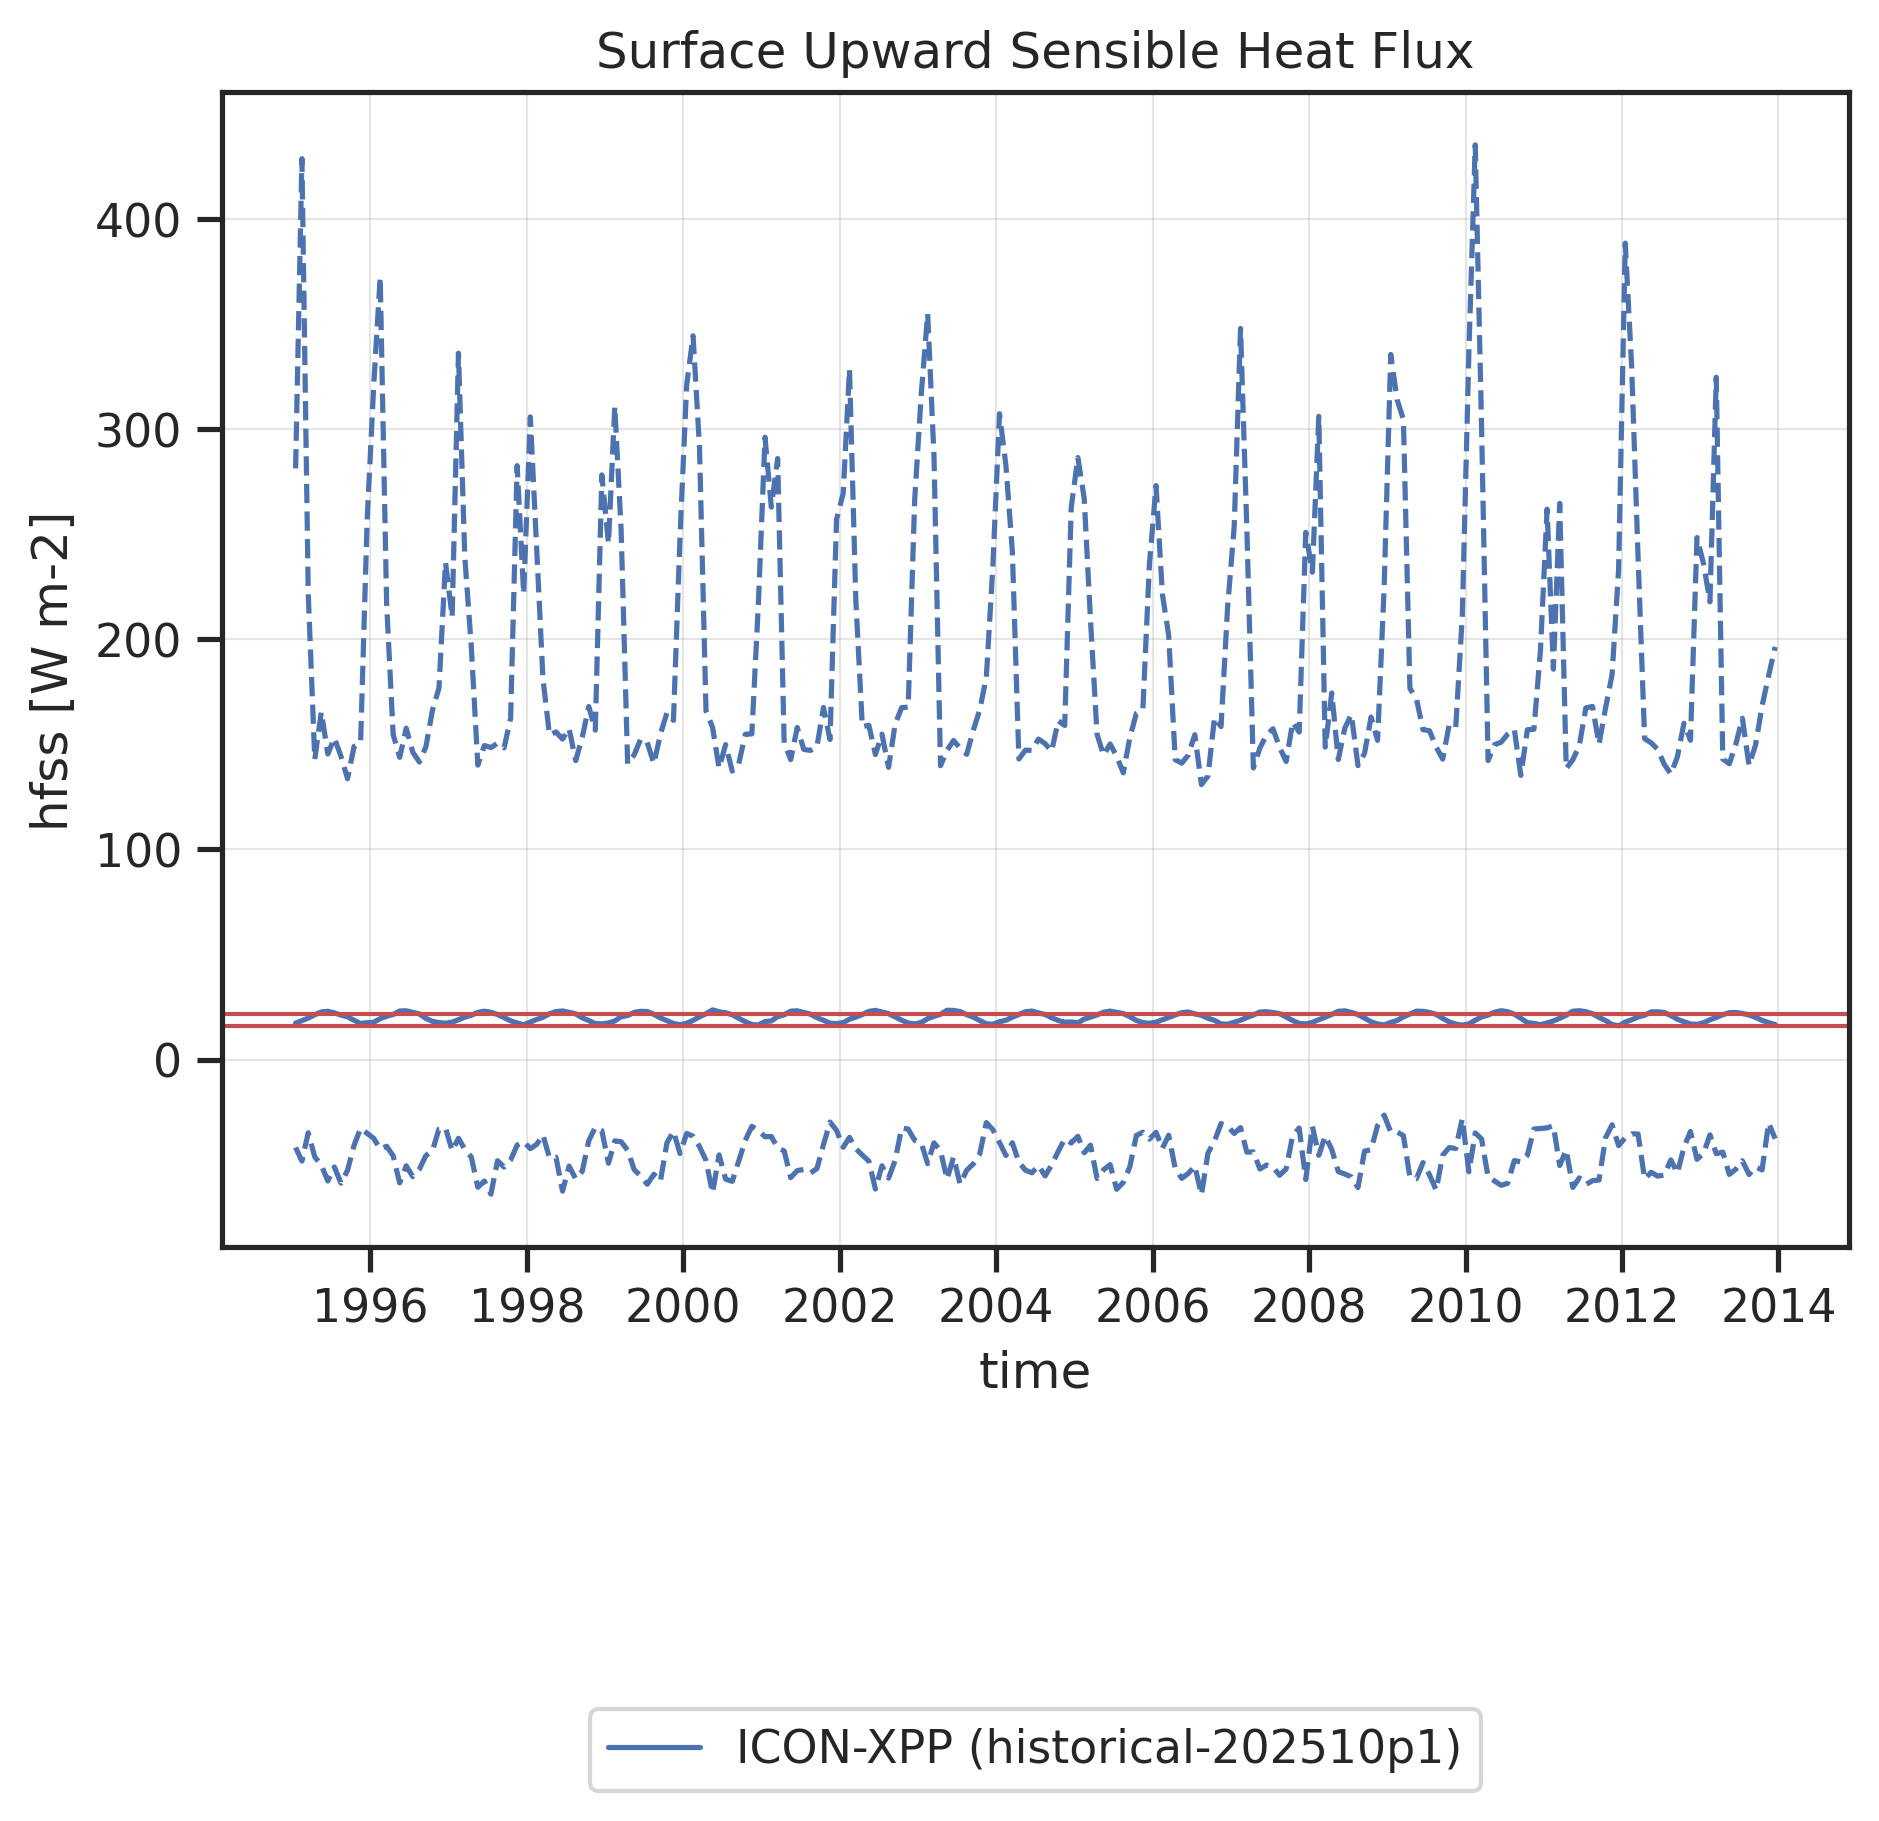
Time series of global mean (solid line) and global minimum/maximum (dashed lines) Surface Upward Sensible Heat Flux. Red horizontal lines show "reasonable" ranges for the global mean calculated from minimum and maximum global mean values found in reference datasets (observations, reanalyses) across all months and all reference datasets.
Time series of global mean (solid line) and global minimum/maximum (dashed lines) Surface Upward Sensible Heat Flux. Red horizontal lines show "reasonable" ranges for the global mean calculated from minimum and maximum global mean values found in reference datasets (observations, reanalyses) across all months and all reference datasets.
|
download |
references |
extra data citation |
provenance
Lwp
Time series of global min/max/mean including "reasonable" ranges.
Lwp: Timeseries
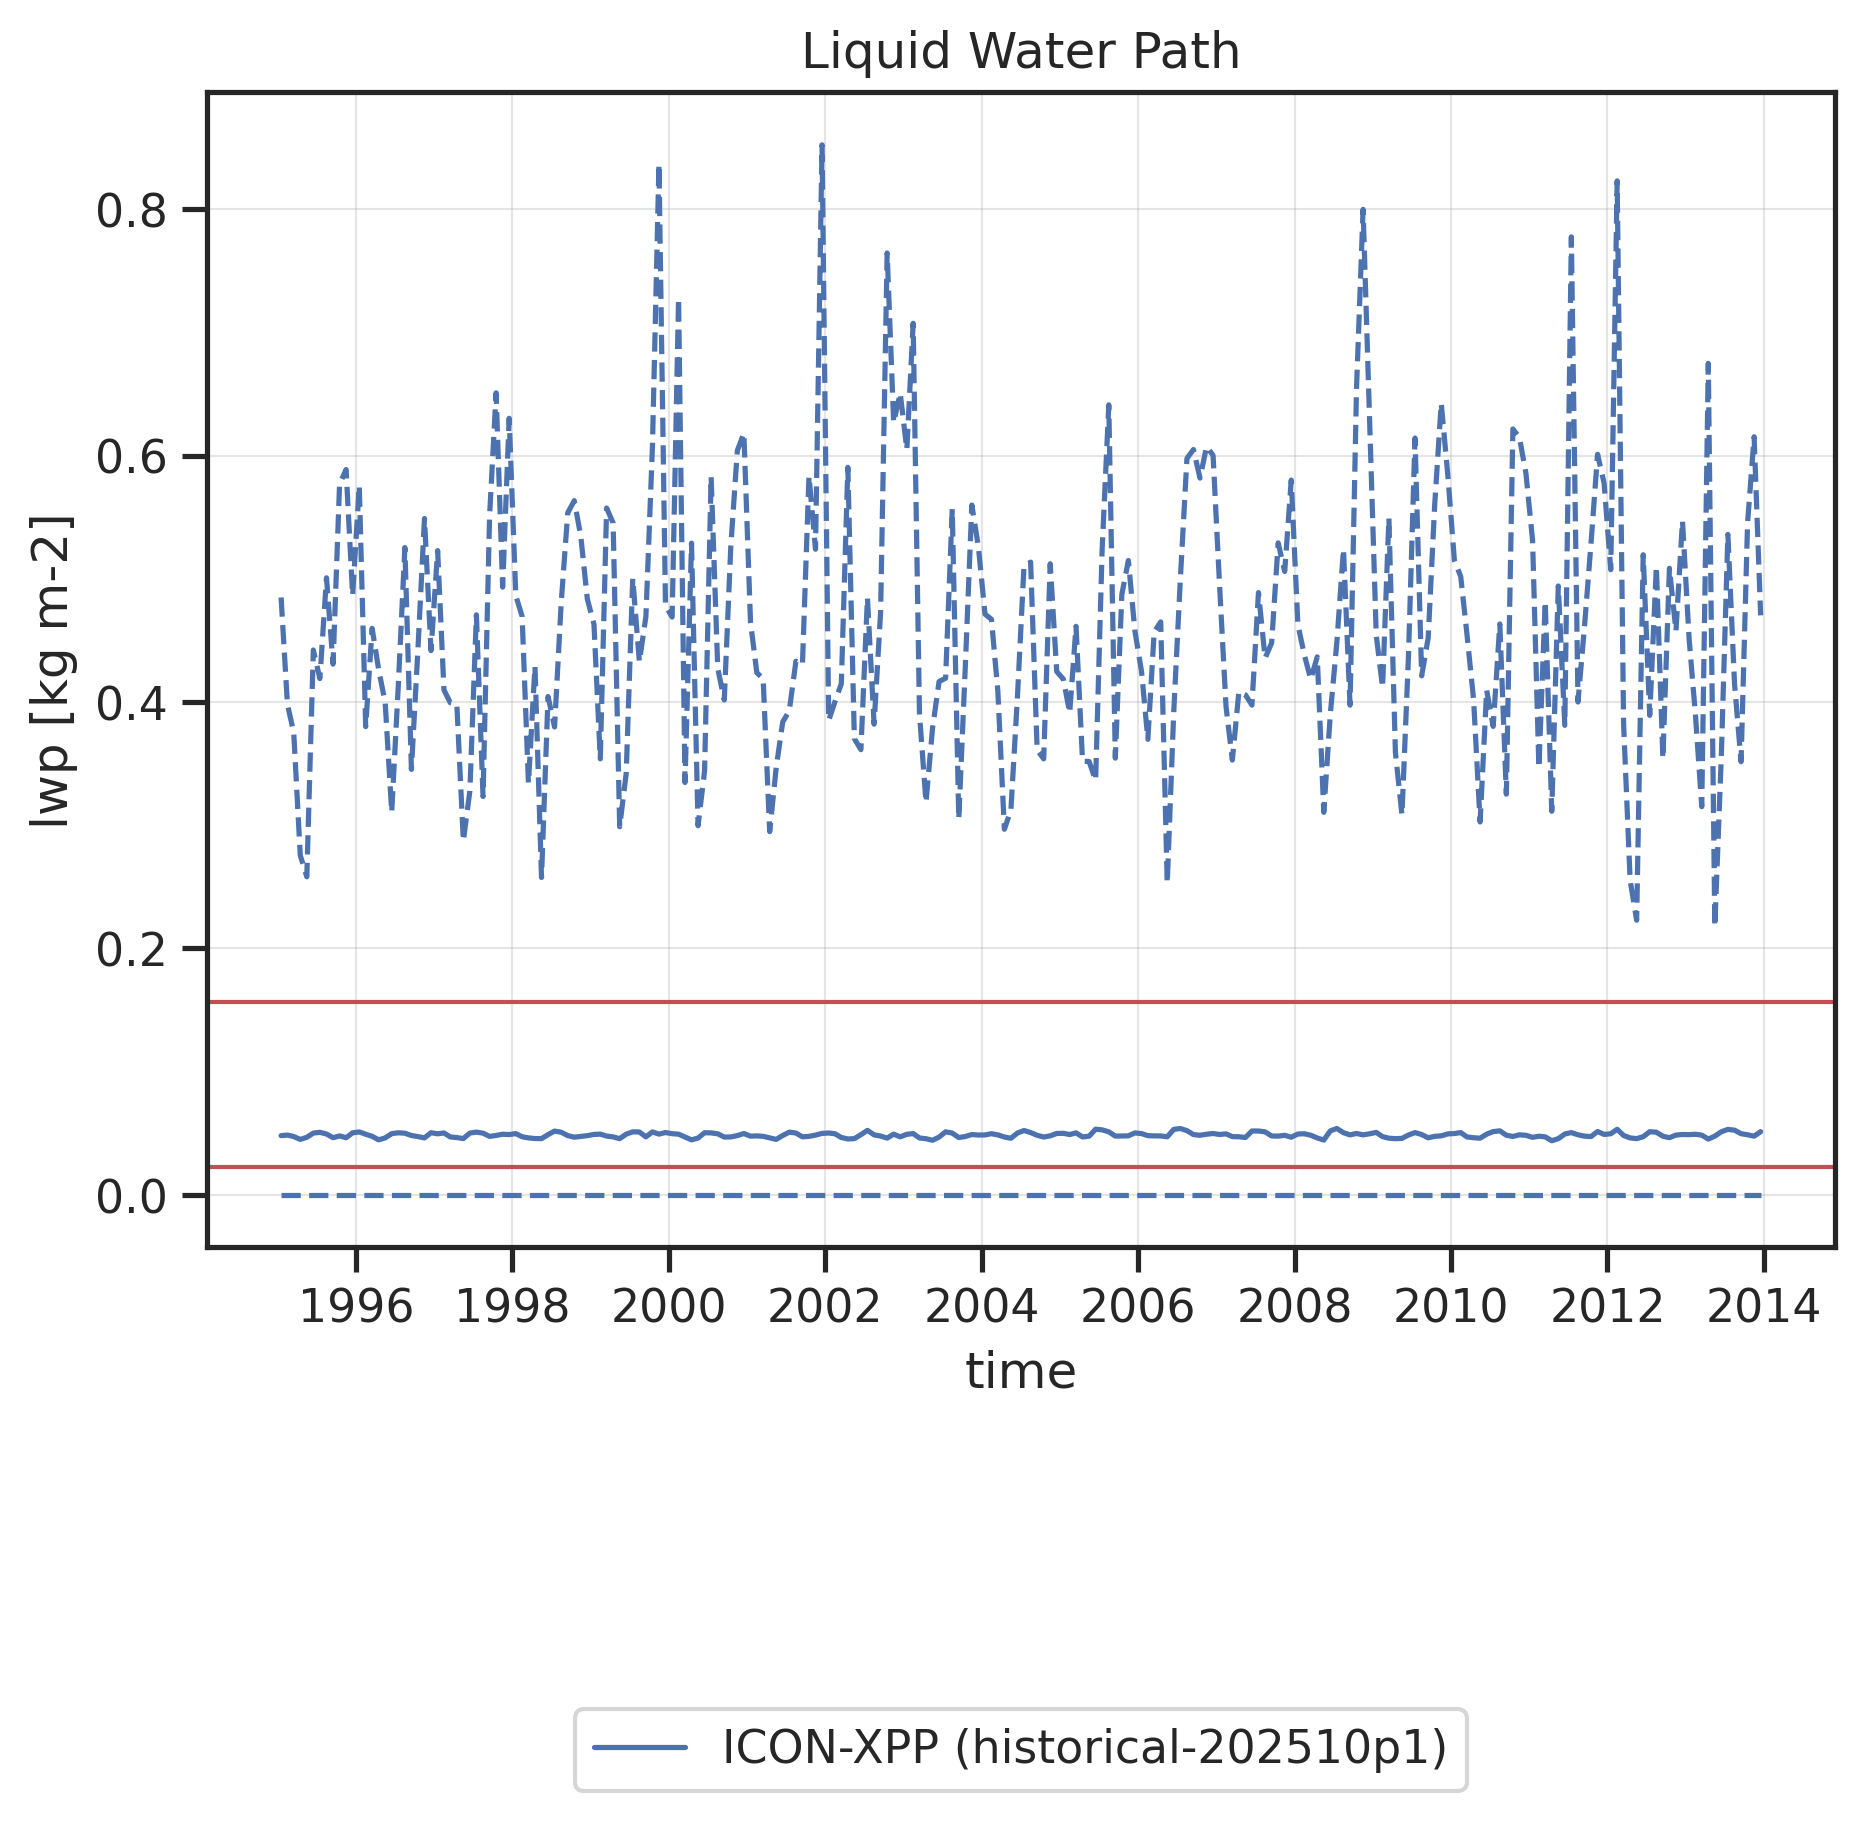
Time series of global mean (solid line) and global minimum/maximum (dashed lines) Liquid Water Path. Red horizontal lines show "reasonable" ranges for the global mean calculated from minimum and maximum global mean values found in reference datasets (observations, reanalyses) across all months and all reference datasets.
Time series of global mean (solid line) and global minimum/maximum (dashed lines) Liquid Water Path. Red horizontal lines show "reasonable" ranges for the global mean calculated from minimum and maximum global mean values found in reference datasets (observations, reanalyses) across all months and all reference datasets.
|
download |
references |
extra data citation |
provenance
Pr
Time series of global min/max/mean including "reasonable" ranges.
Pr: Timeseries
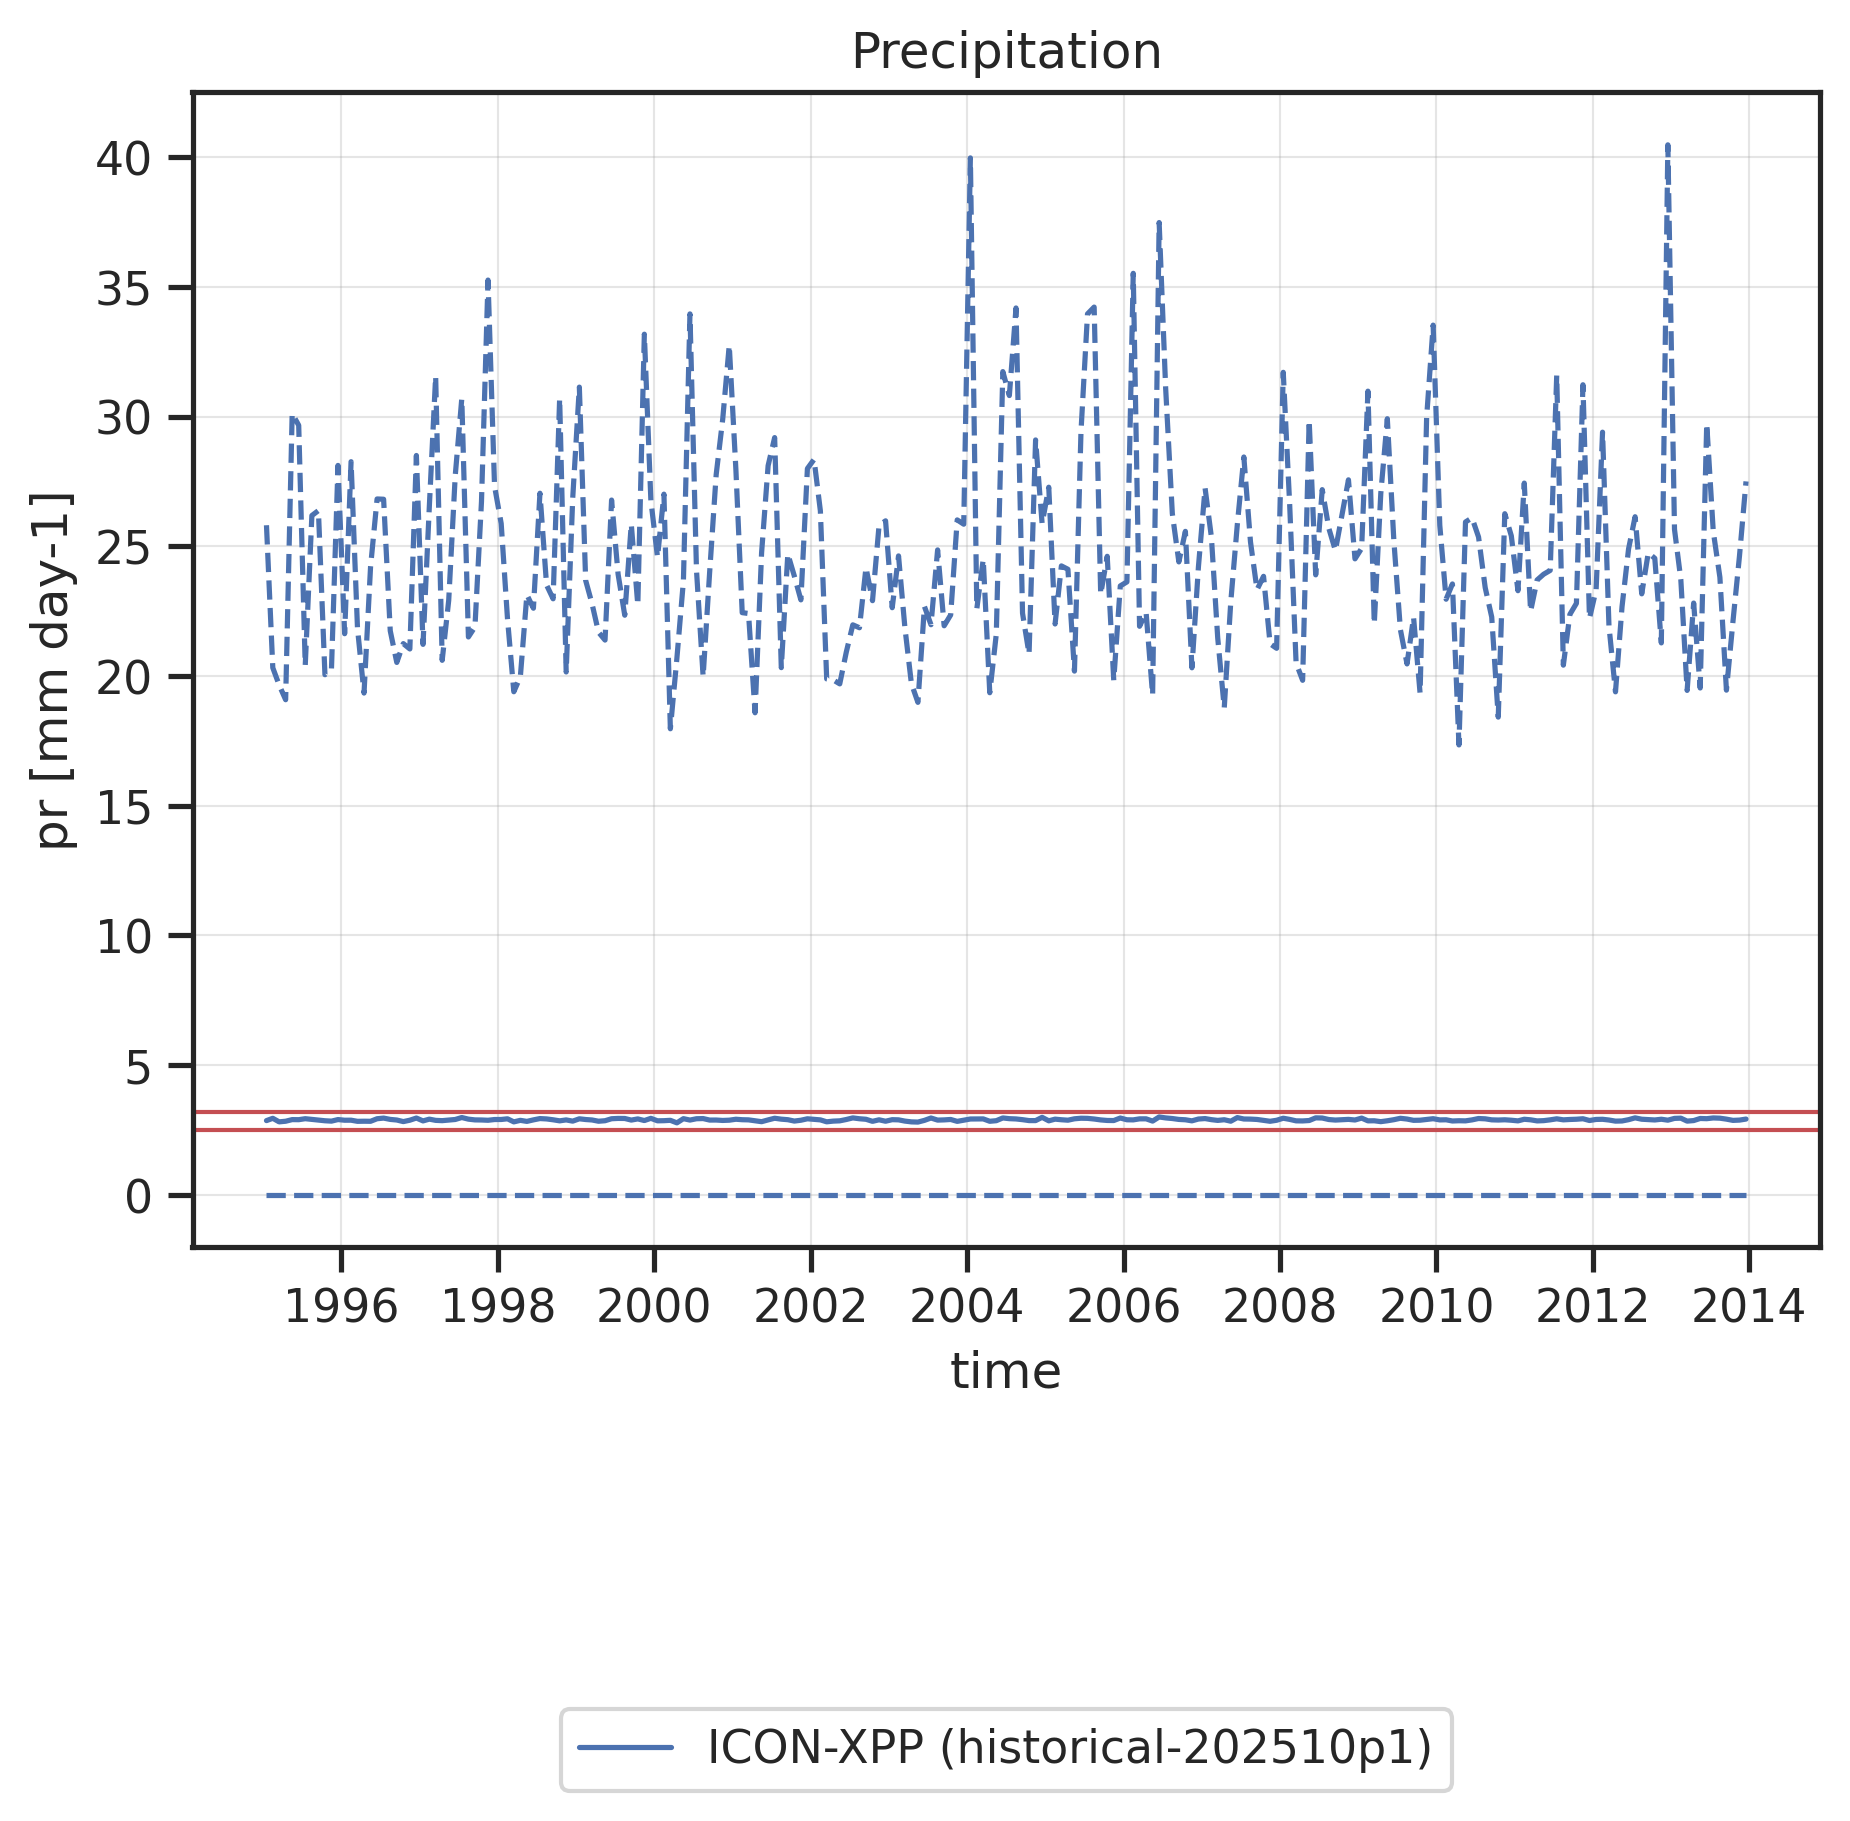
Time series of global mean (solid line) and global minimum/maximum (dashed lines) Precipitation. Red horizontal lines show "reasonable" ranges for the global mean calculated from minimum and maximum global mean values found in reference datasets (observations, reanalyses) across all months and all reference datasets.
Time series of global mean (solid line) and global minimum/maximum (dashed lines) Precipitation. Red horizontal lines show "reasonable" ranges for the global mean calculated from minimum and maximum global mean values found in reference datasets (observations, reanalyses) across all months and all reference datasets.
|
download |
references |
extra data citation |
provenance
Prw
Time series of global min/max/mean including "reasonable" ranges.
Prw: Timeseries
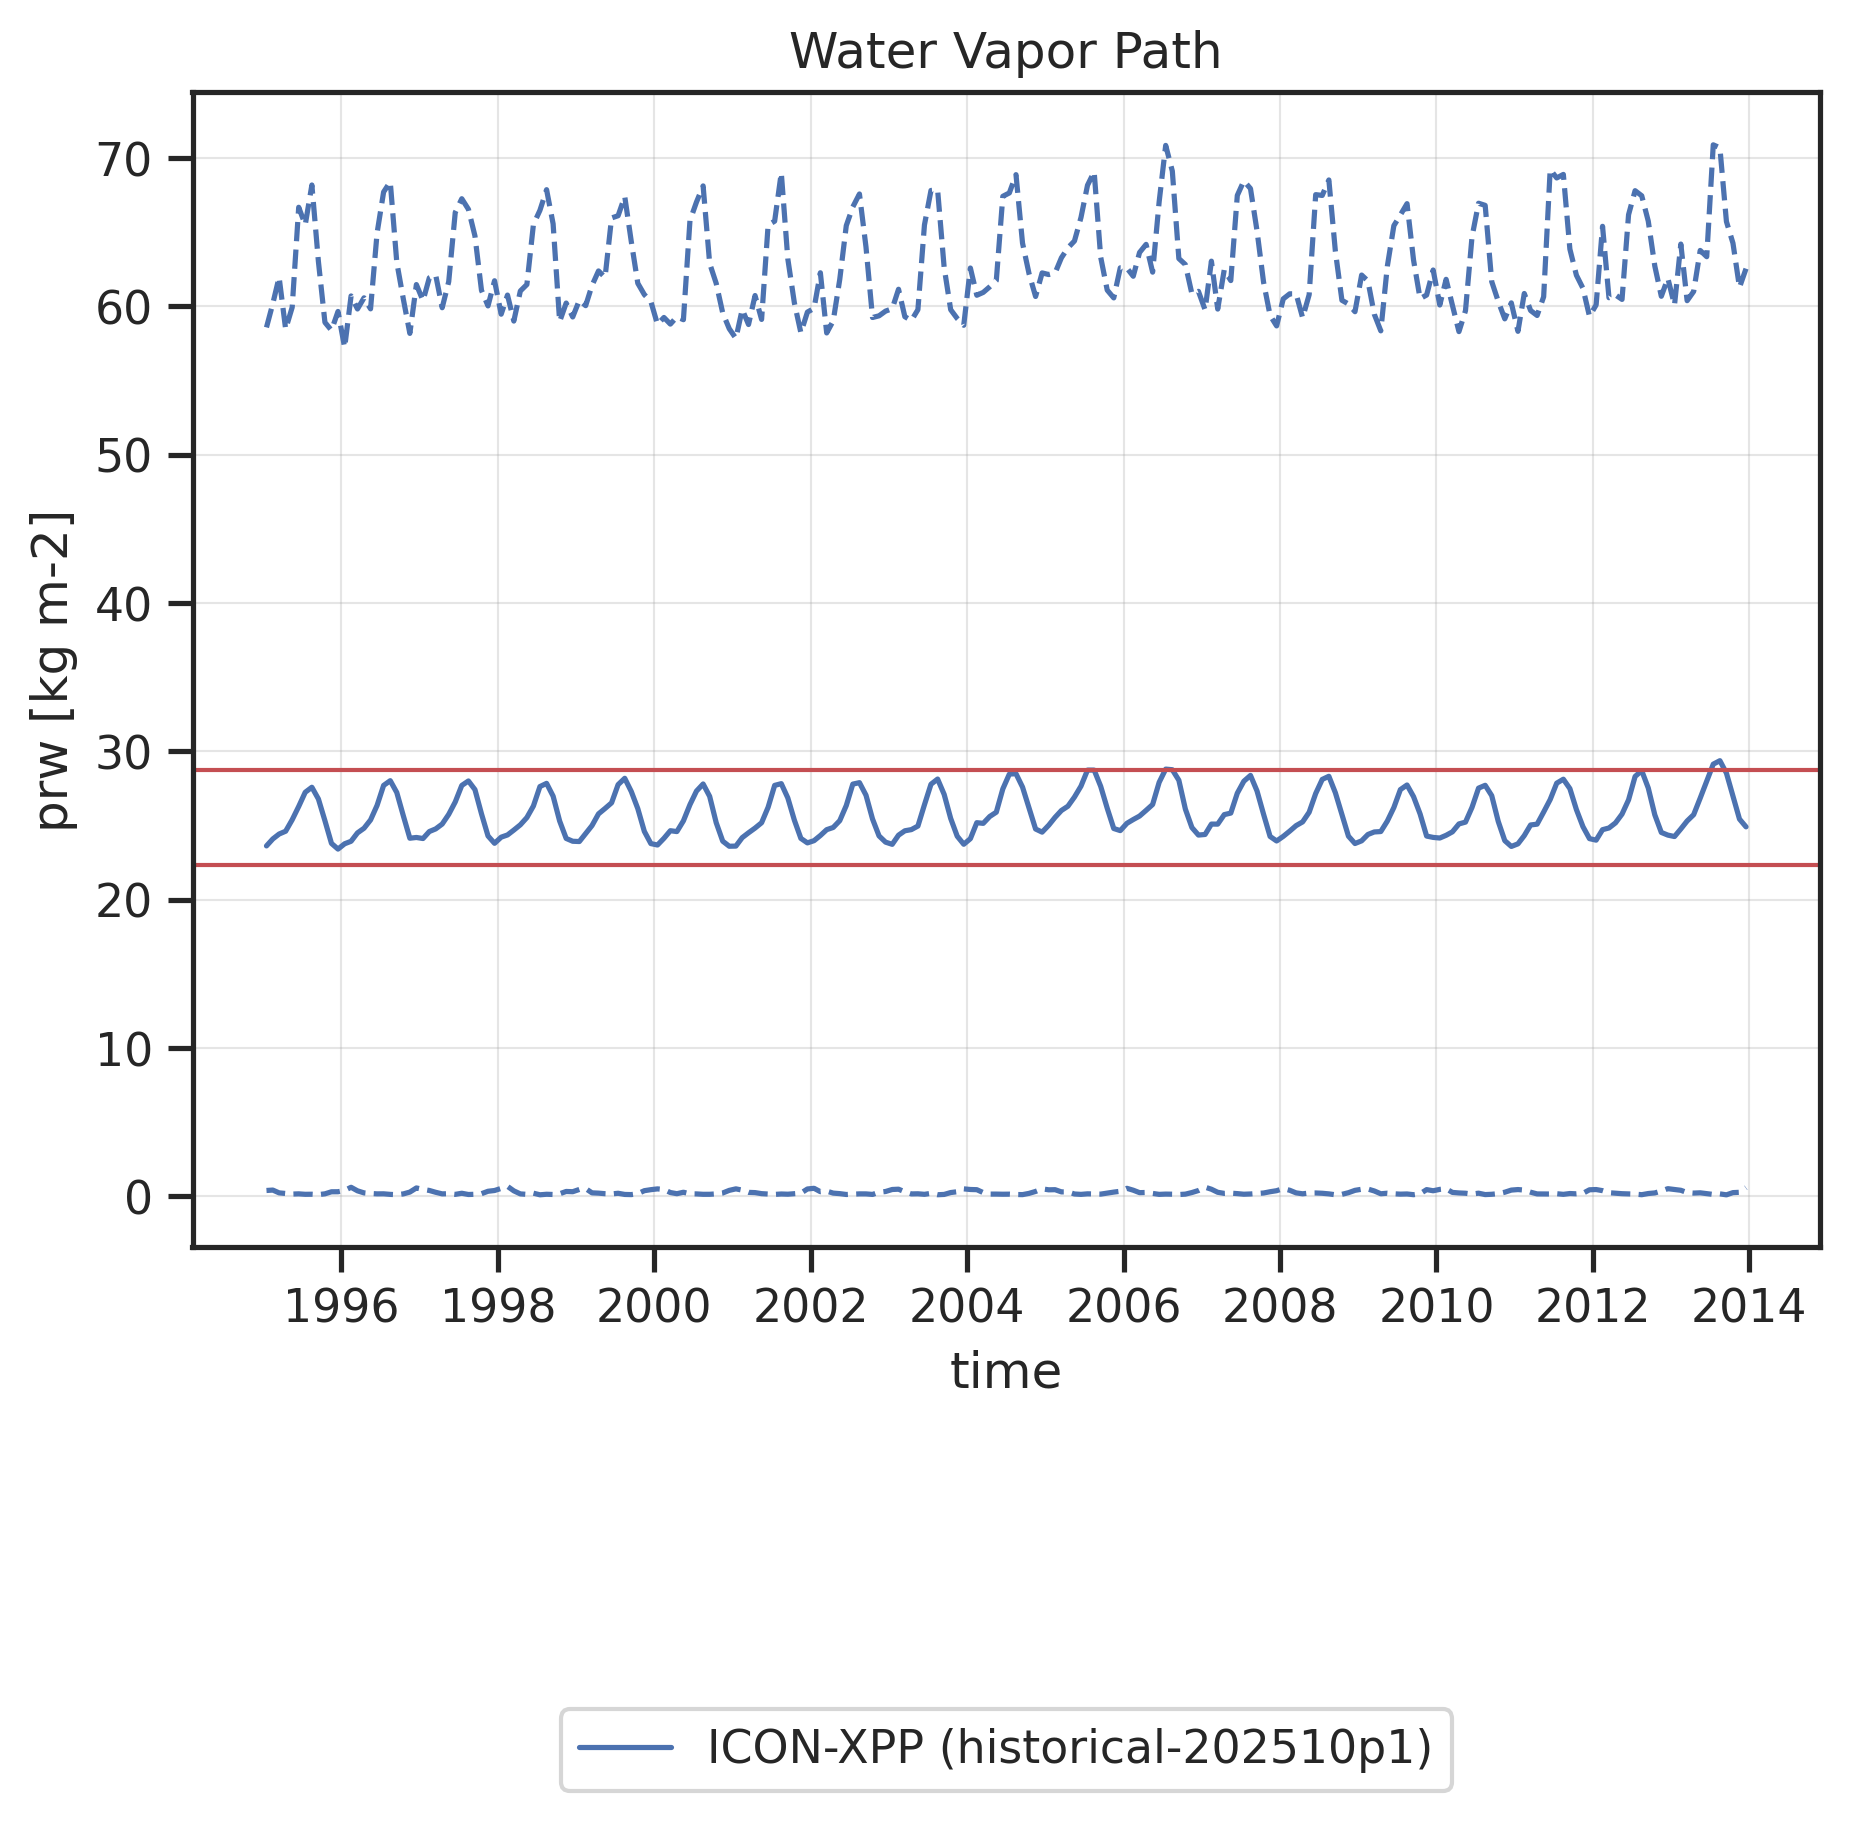
Time series of global mean (solid line) and global minimum/maximum (dashed lines) Water Vapor Path. Red horizontal lines show "reasonable" ranges for the global mean calculated from minimum and maximum global mean values found in reference datasets (observations, reanalyses) across all months and all reference datasets.
Time series of global mean (solid line) and global minimum/maximum (dashed lines) Water Vapor Path. Red horizontal lines show "reasonable" ranges for the global mean calculated from minimum and maximum global mean values found in reference datasets (observations, reanalyses) across all months and all reference datasets.
|
download |
references |
extra data citation |
provenance
Rlut
Time series of global min/max/mean including "reasonable" ranges.
Rlut: Timeseries
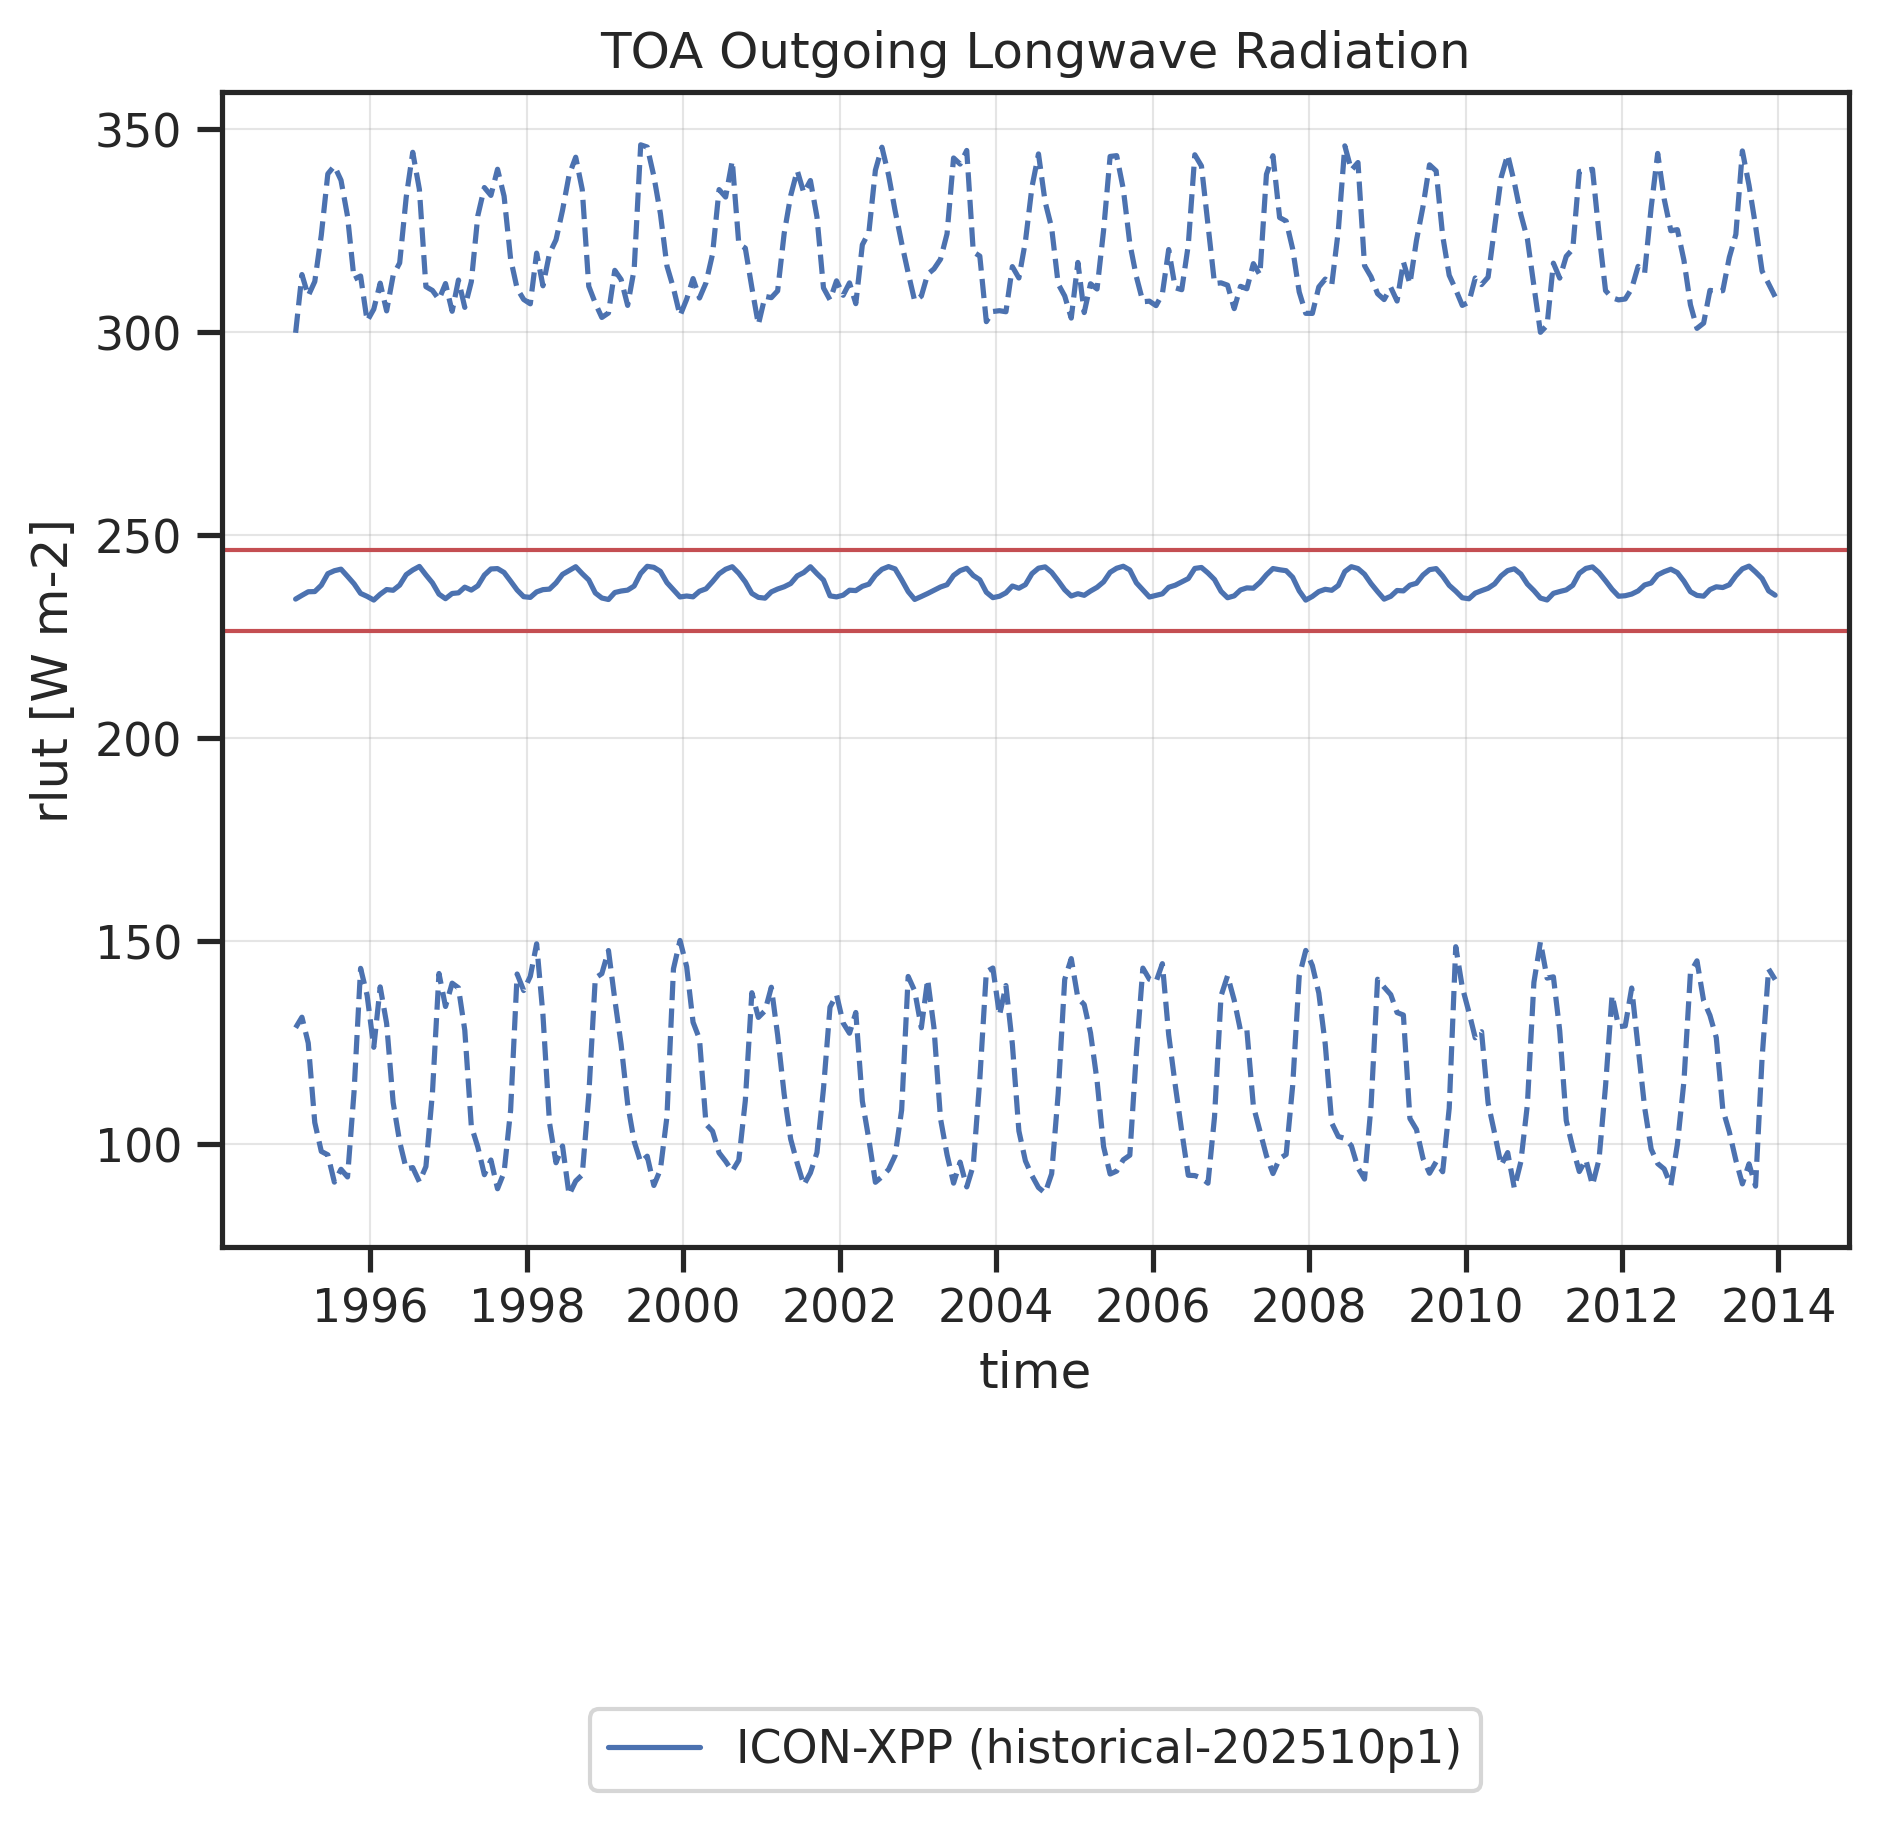
Time series of global mean (solid line) and global minimum/maximum (dashed lines) TOA Outgoing Longwave Radiation. Red horizontal lines show "reasonable" ranges for the global mean calculated from minimum and maximum global mean values found in reference datasets (observations, reanalyses) across all months and all reference datasets.
Time series of global mean (solid line) and global minimum/maximum (dashed lines) TOA Outgoing Longwave Radiation. Red horizontal lines show "reasonable" ranges for the global mean calculated from minimum and maximum global mean values found in reference datasets (observations, reanalyses) across all months and all reference datasets.
|
download |
references |
extra data citation |
provenance
Rtnt
Time series of global min/max/mean including "reasonable" ranges.
Rtnt: Timeseries
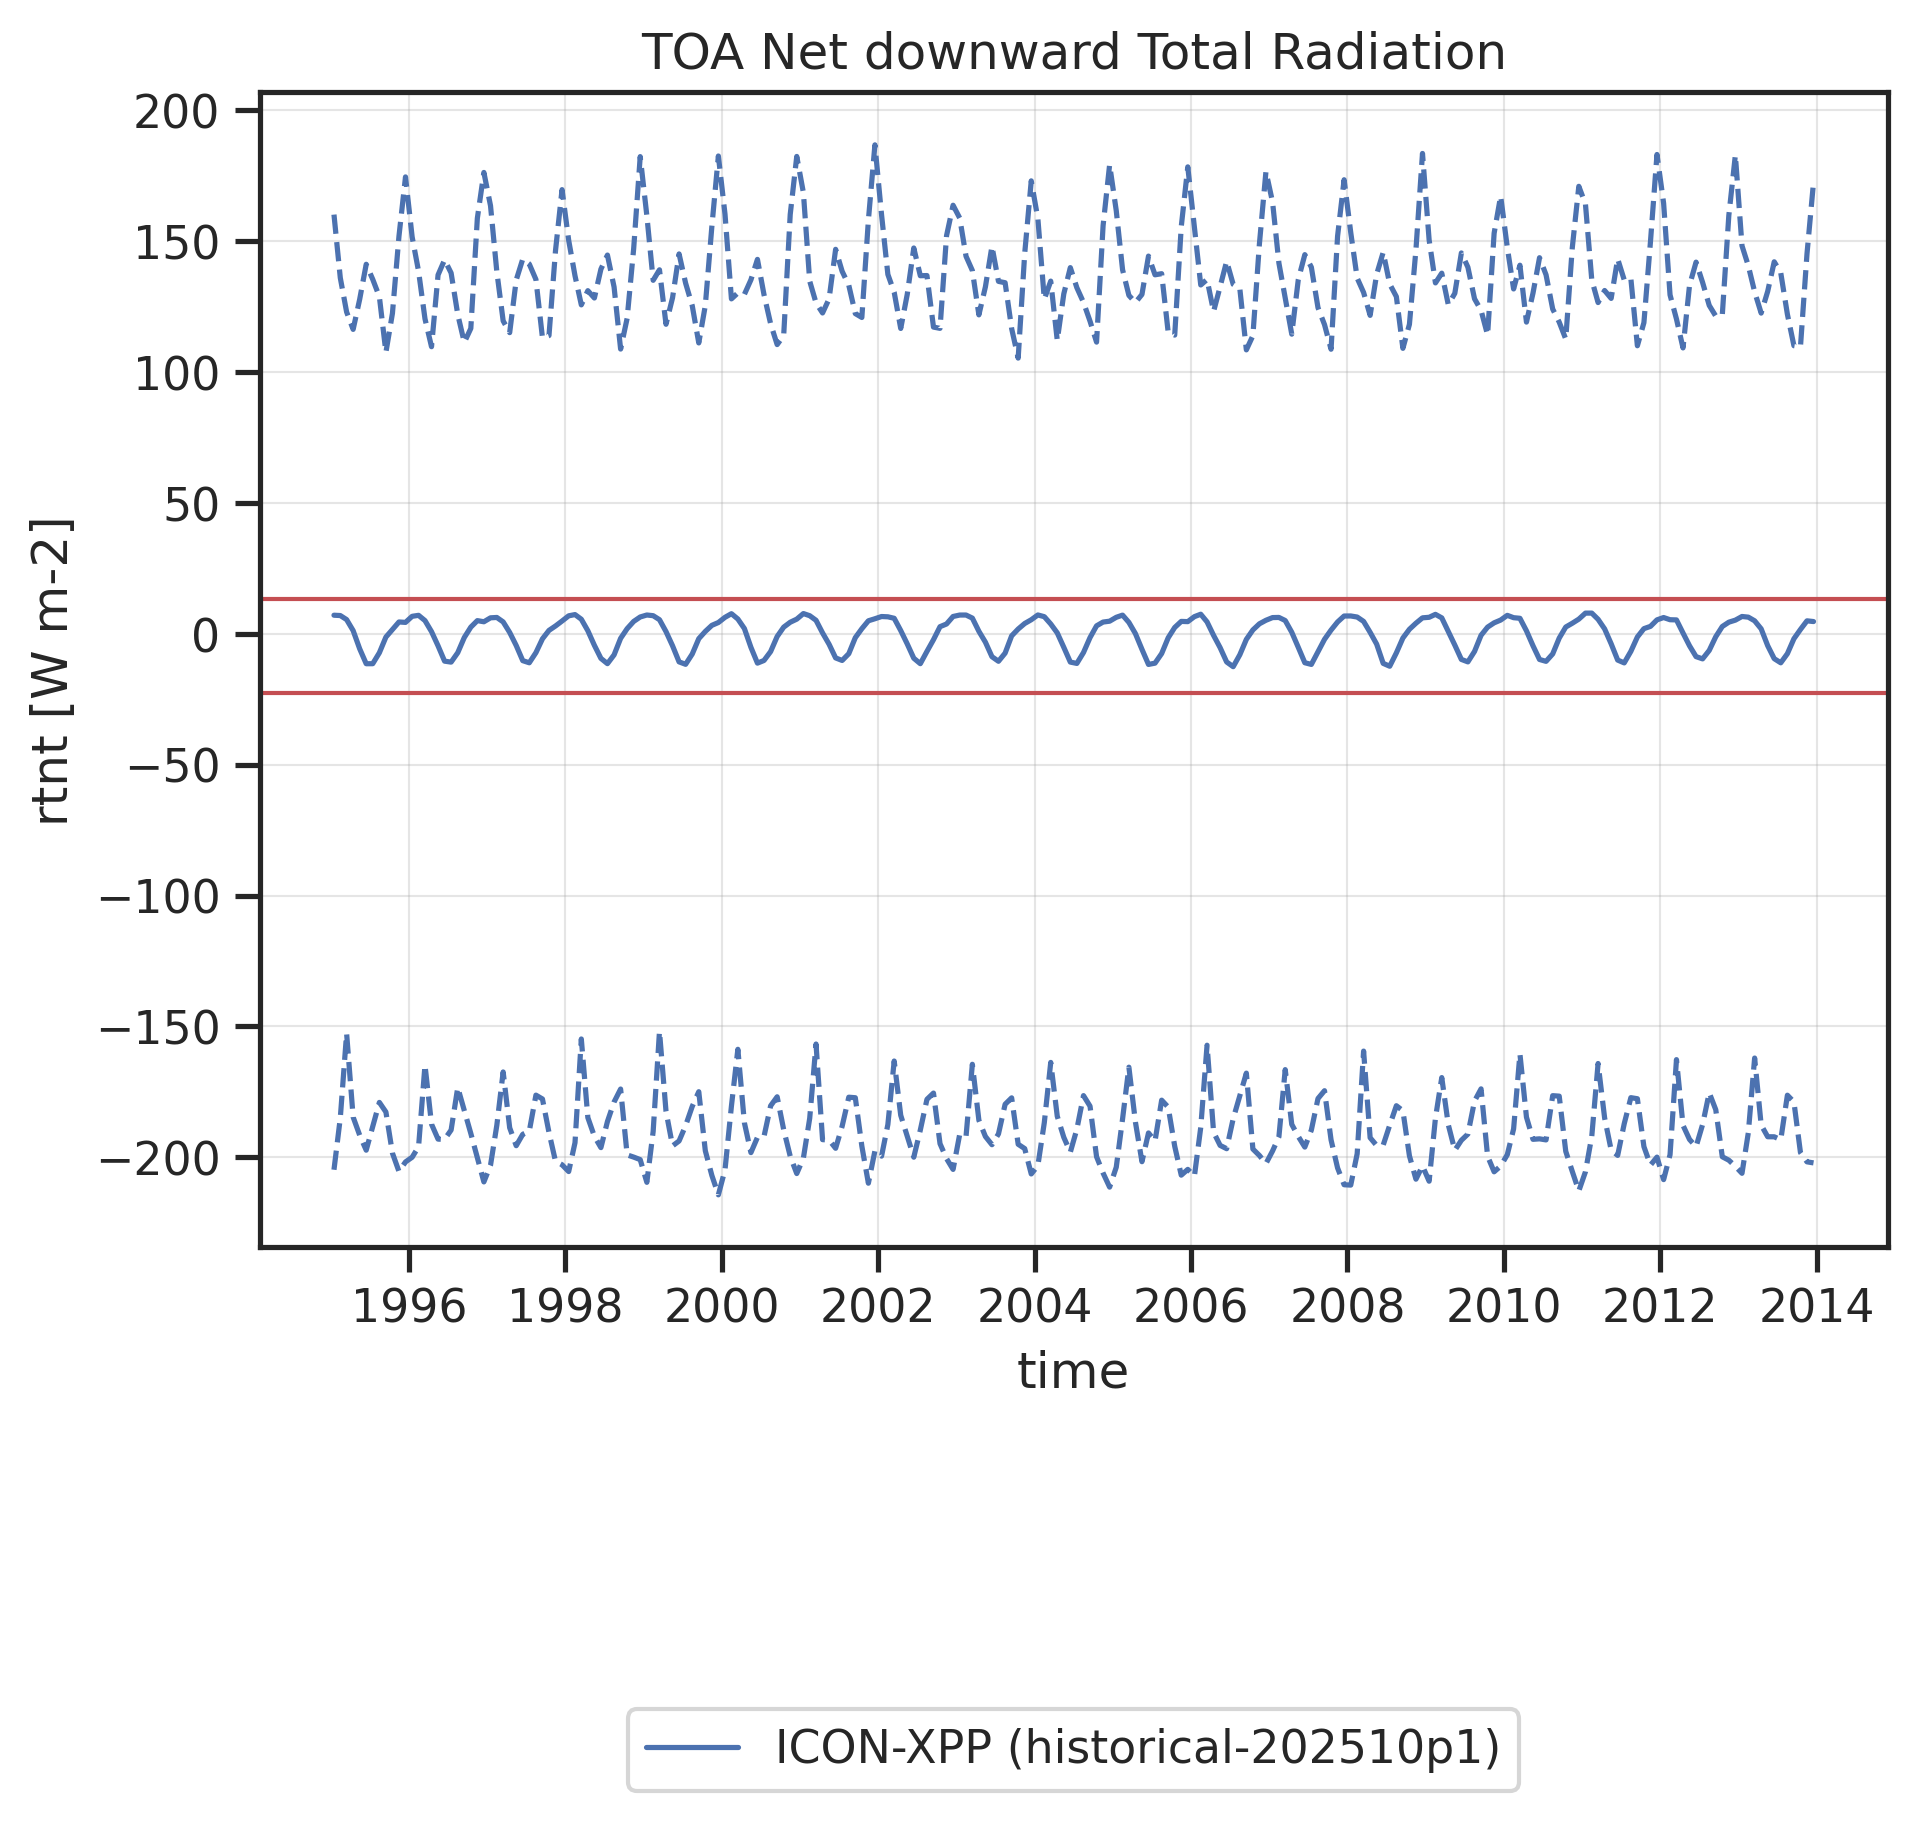
Time series of global mean (solid line) and global minimum/maximum (dashed lines) TOA Net downward Total Radiation. Red horizontal lines show "reasonable" ranges for the global mean calculated from minimum and maximum global mean values found in reference datasets (observations, reanalyses) across all months and all reference datasets.
Time series of global mean (solid line) and global minimum/maximum (dashed lines) TOA Net downward Total Radiation. Red horizontal lines show "reasonable" ranges for the global mean calculated from minimum and maximum global mean values found in reference datasets (observations, reanalyses) across all months and all reference datasets.
|
download |
references |
extra data citation |
provenance
Rsut
Time series of global min/max/mean including "reasonable" ranges.
Rsut: Timeseries
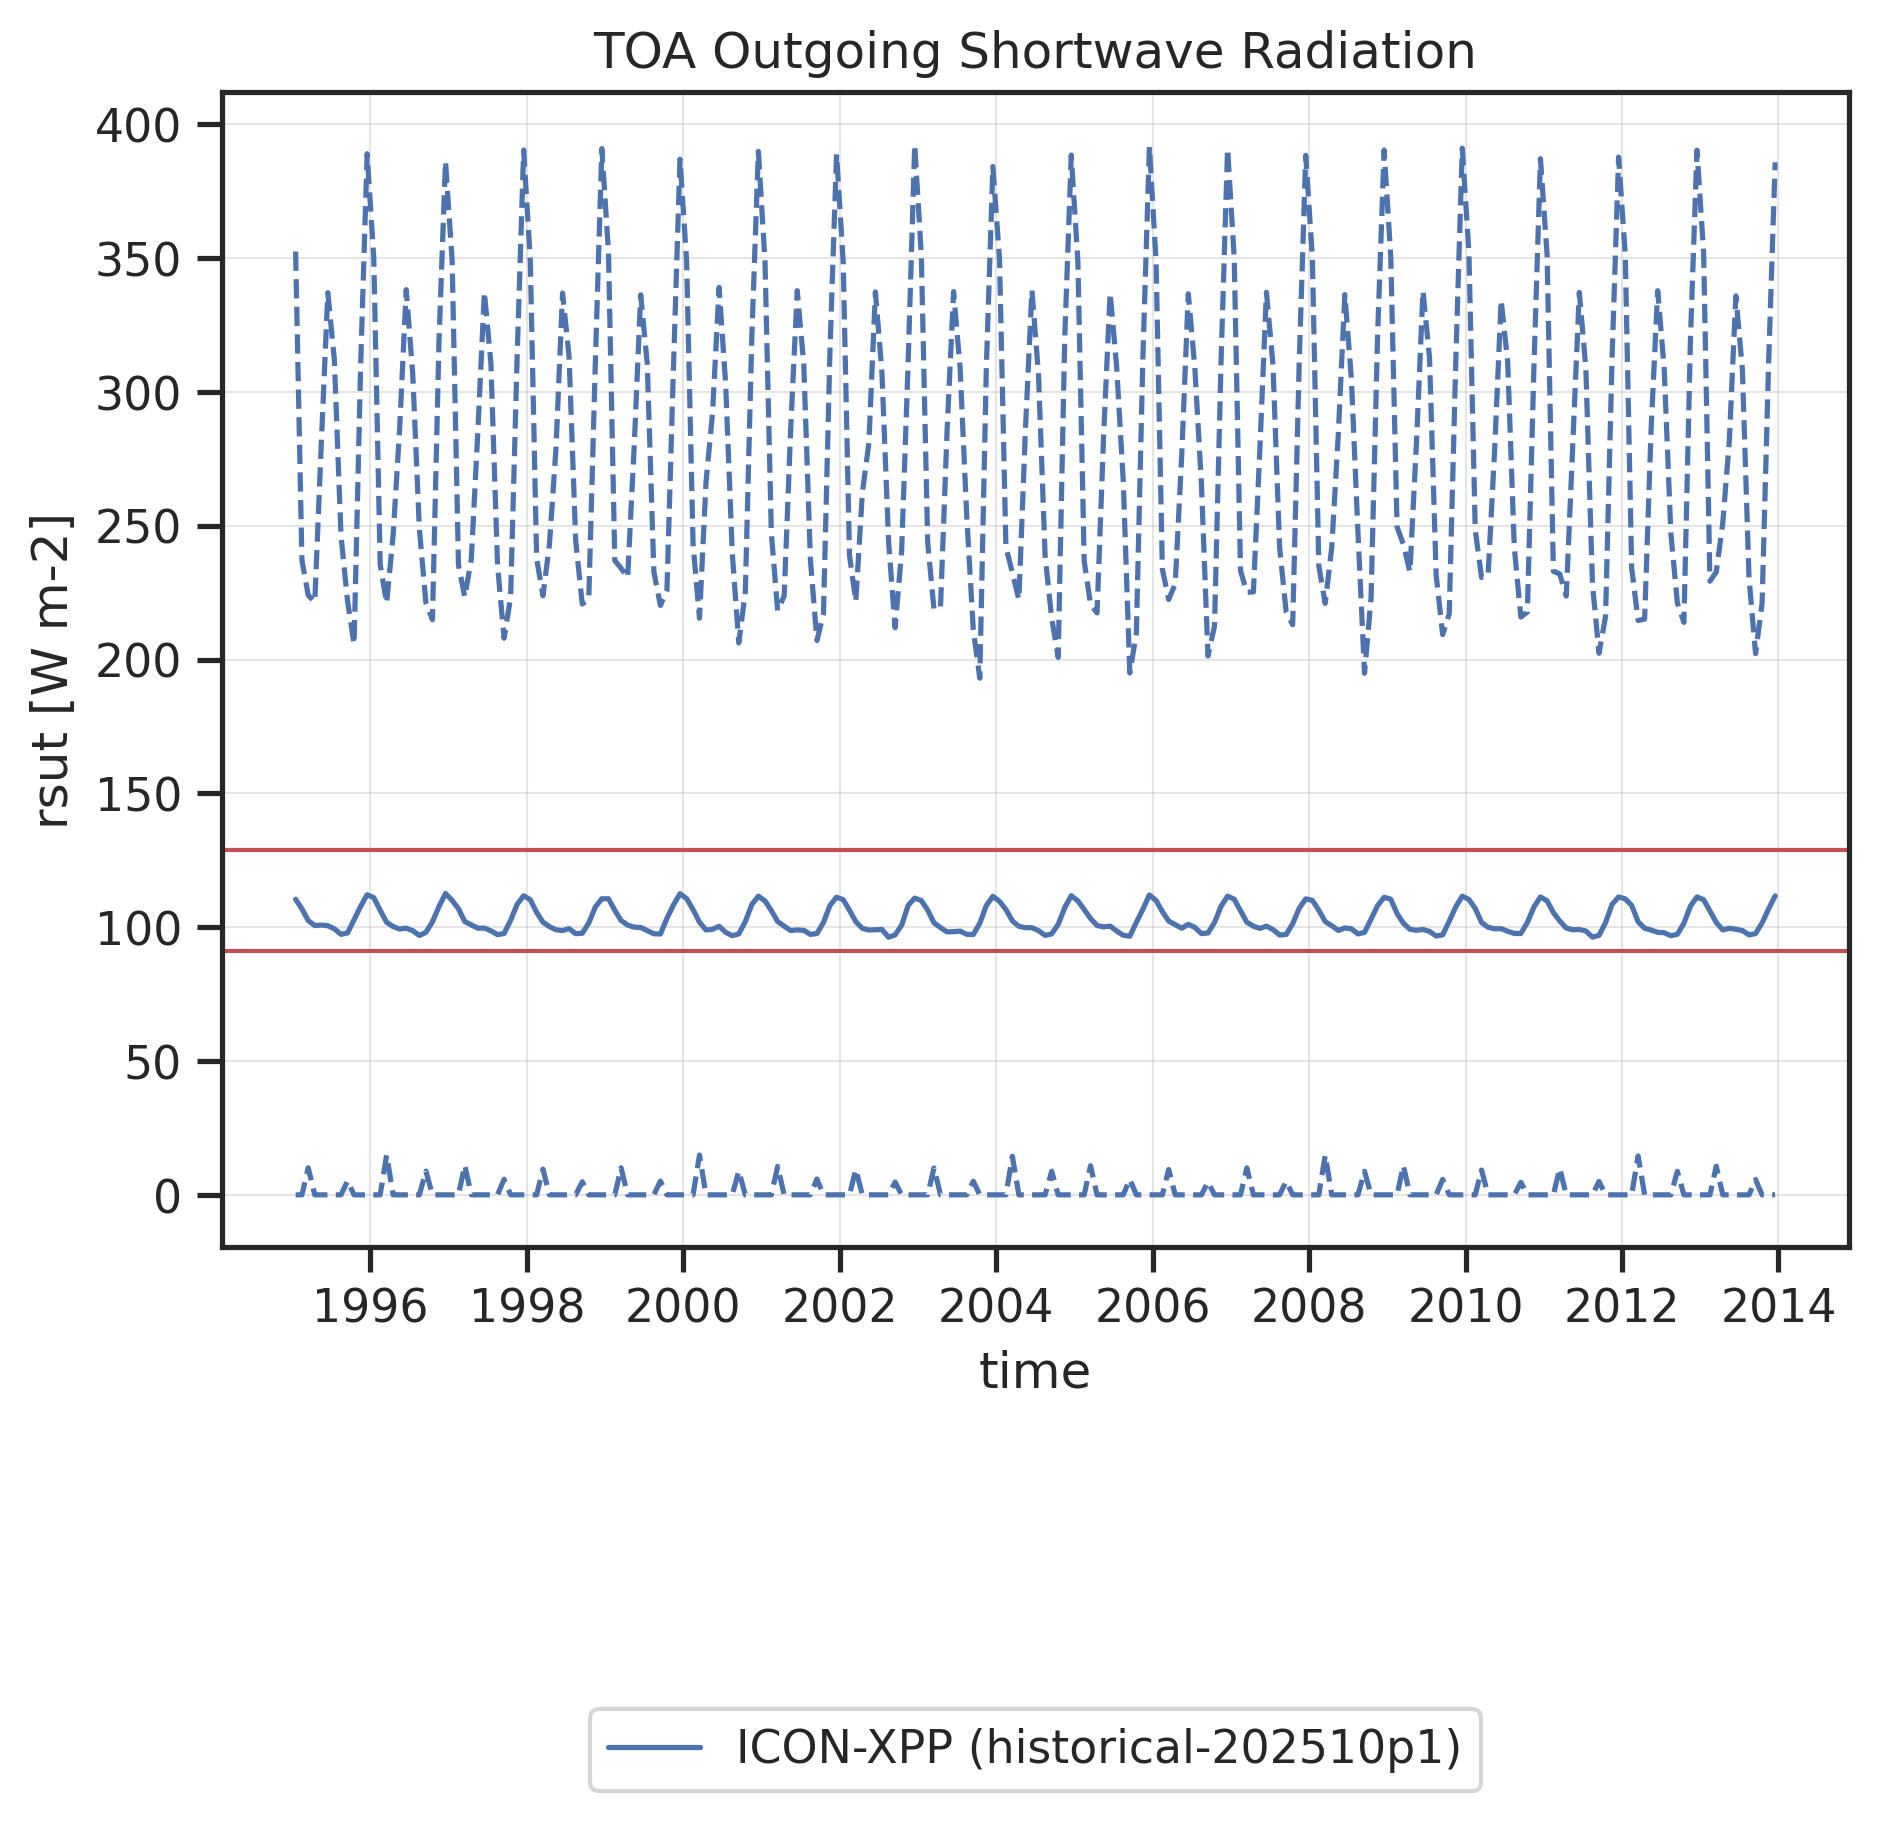
Time series of global mean (solid line) and global minimum/maximum (dashed lines) TOA Outgoing Shortwave Radiation. Red horizontal lines show "reasonable" ranges for the global mean calculated from minimum and maximum global mean values found in reference datasets (observations, reanalyses) across all months and all reference datasets.
Time series of global mean (solid line) and global minimum/maximum (dashed lines) TOA Outgoing Shortwave Radiation. Red horizontal lines show "reasonable" ranges for the global mean calculated from minimum and maximum global mean values found in reference datasets (observations, reanalyses) across all months and all reference datasets.
|
download |
references |
extra data citation |
provenance
Tas
Time series of global min/max/mean including "reasonable" ranges.
Tas: Timeseries
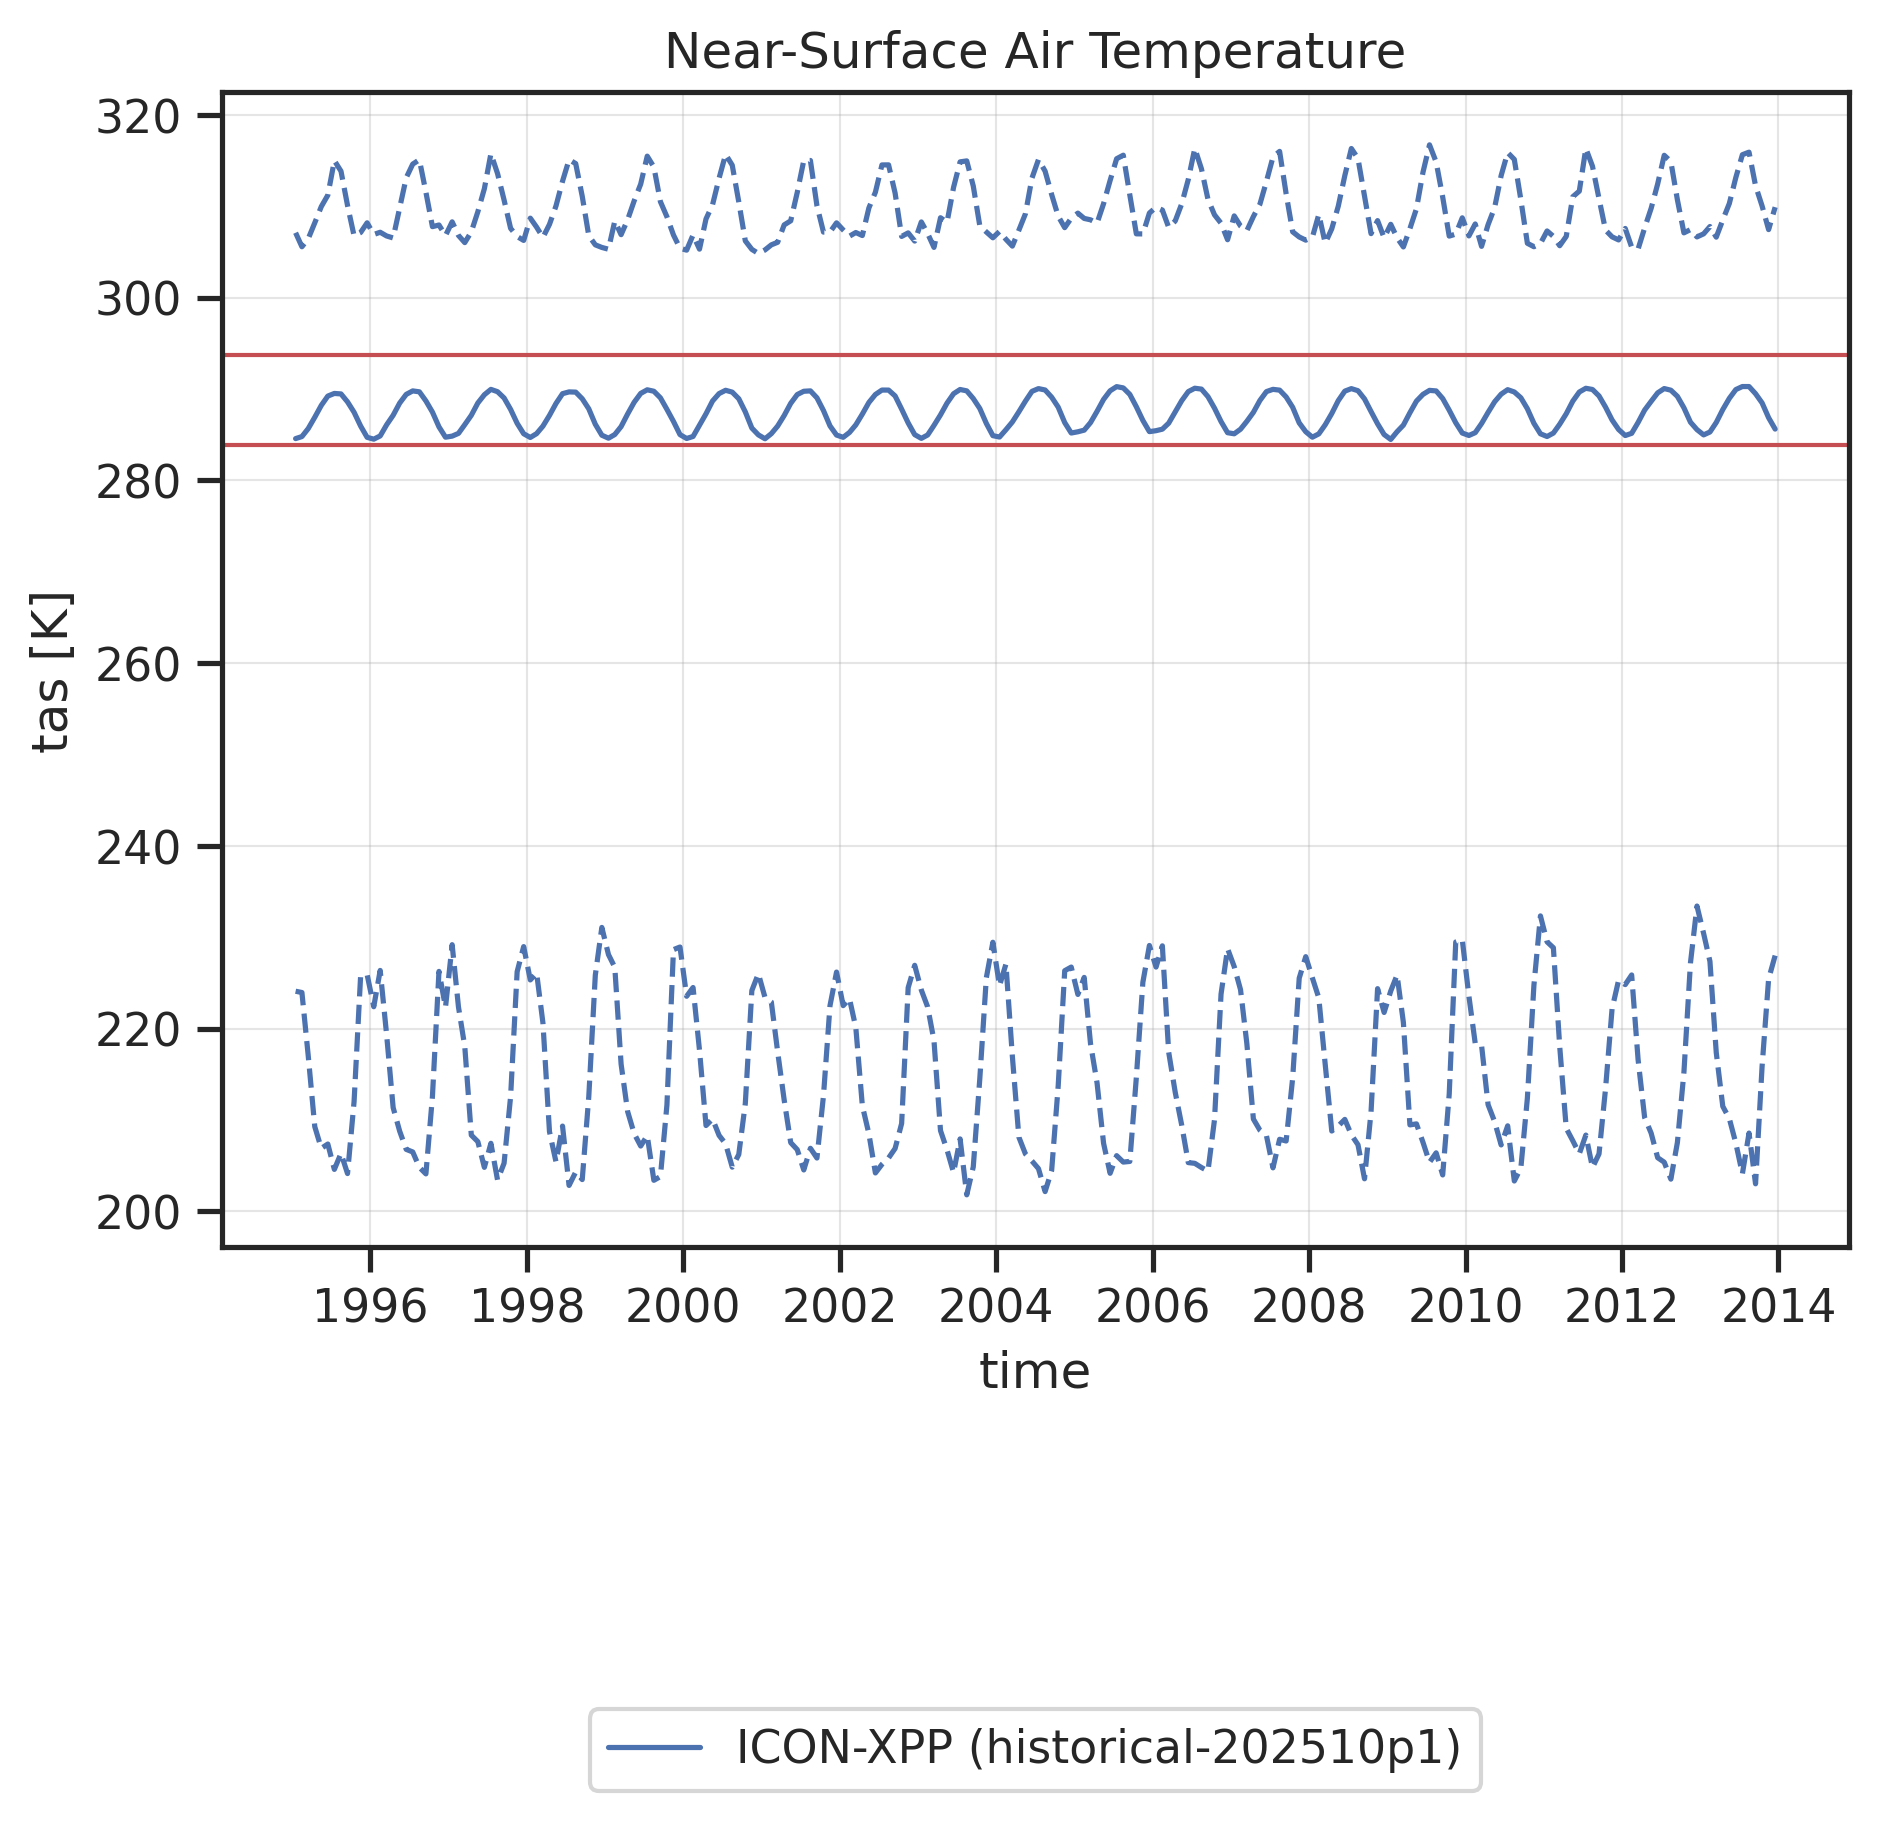
Time series of global mean (solid line) and global minimum/maximum (dashed lines) Near-Surface Air Temperature. Red horizontal lines show "reasonable" ranges for the global mean calculated from minimum and maximum global mean values found in reference datasets (observations, reanalyses) across all months and all reference datasets.
Time series of global mean (solid line) and global minimum/maximum (dashed lines) Near-Surface Air Temperature. Red horizontal lines show "reasonable" ranges for the global mean calculated from minimum and maximum global mean values found in reference datasets (observations, reanalyses) across all months and all reference datasets.
|
download |
references |
extra data citation |
provenance
Tauu
Time series of global min/max/mean including "reasonable" ranges.
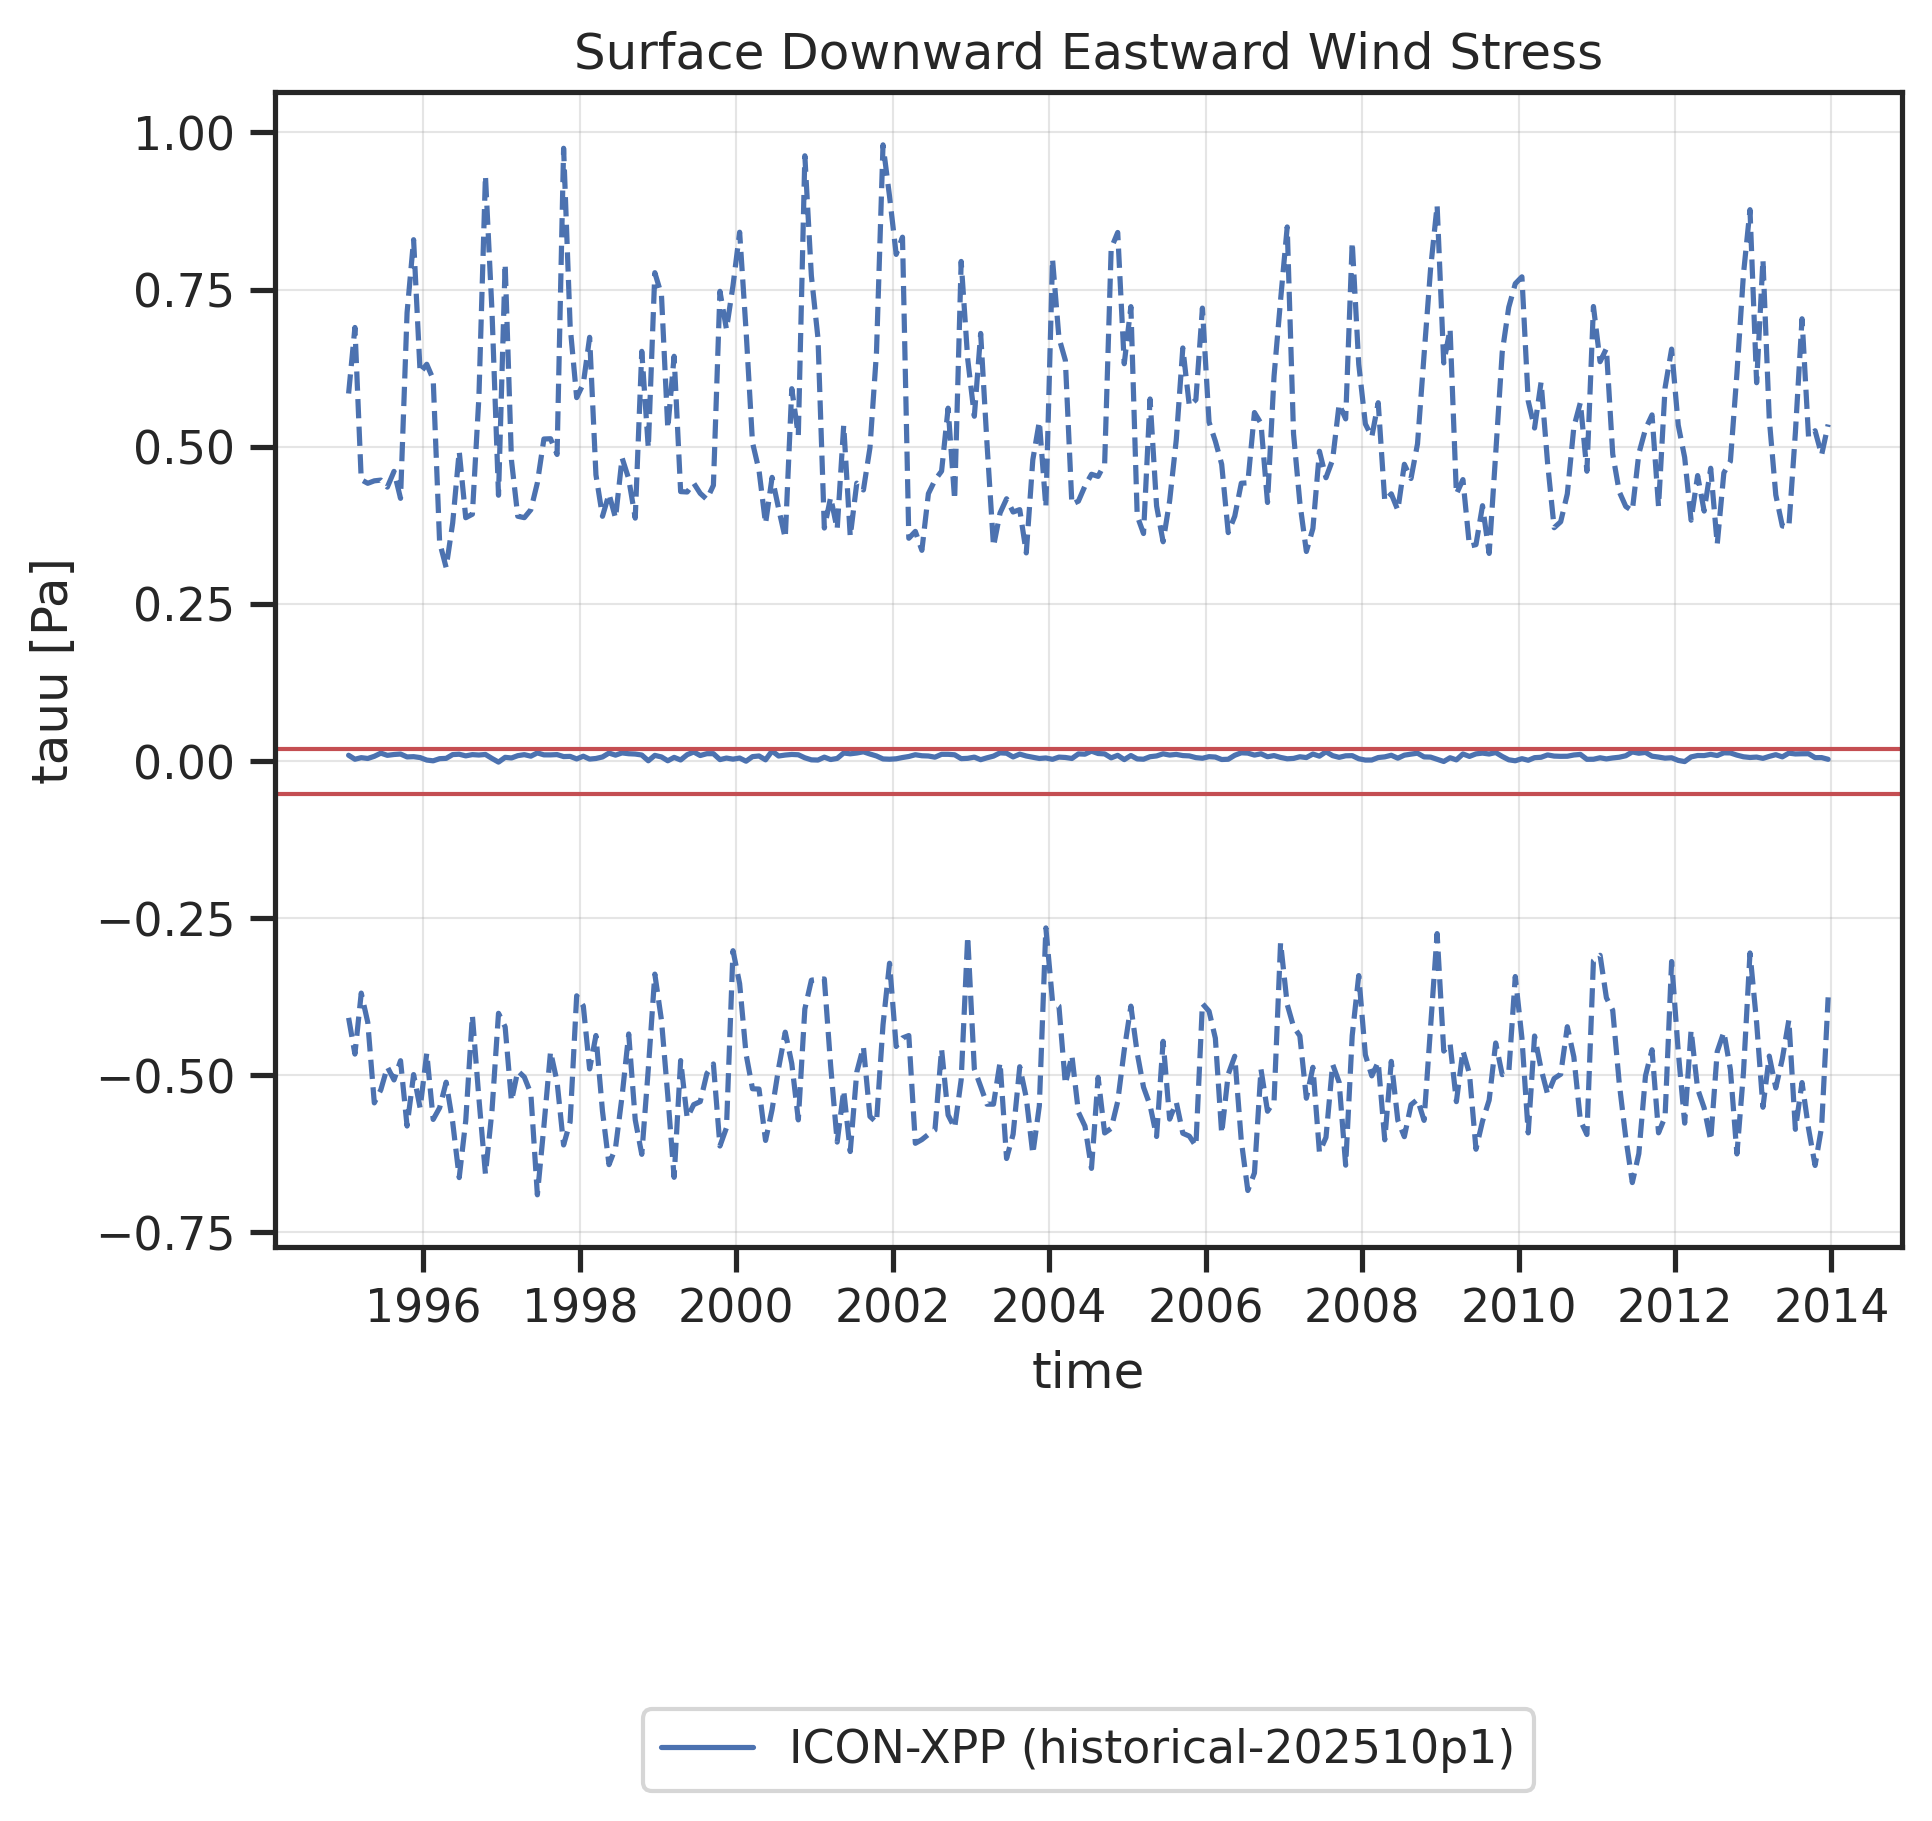
Tauu: Timeseries
Time series of global mean (solid line) and global minimum/maximum (dashed lines) Surface Downward Eastward Wind Stress. Red horizontal lines show "reasonable" ranges for the global mean calculated from minimum and maximum global mean values found in reference datasets (observations, reanalyses) across all months and all reference datasets.
Time series of global mean (solid line) and global minimum/maximum (dashed lines) Surface Downward Eastward Wind Stress. Red horizontal lines show "reasonable" ranges for the global mean calculated from minimum and maximum global mean values found in reference datasets (observations, reanalyses) across all months and all reference datasets.
|
download |
references |
extra data citation |
provenance