<p>Map plots of ocean variables.</p> <p><i>Note</i></p> <p>Time ranges for the different datasets differ: <ul> <li>ICON-XPP: 19950101/20140101</li> <li>WOA: 20000101/20001231</li> </ul></p>
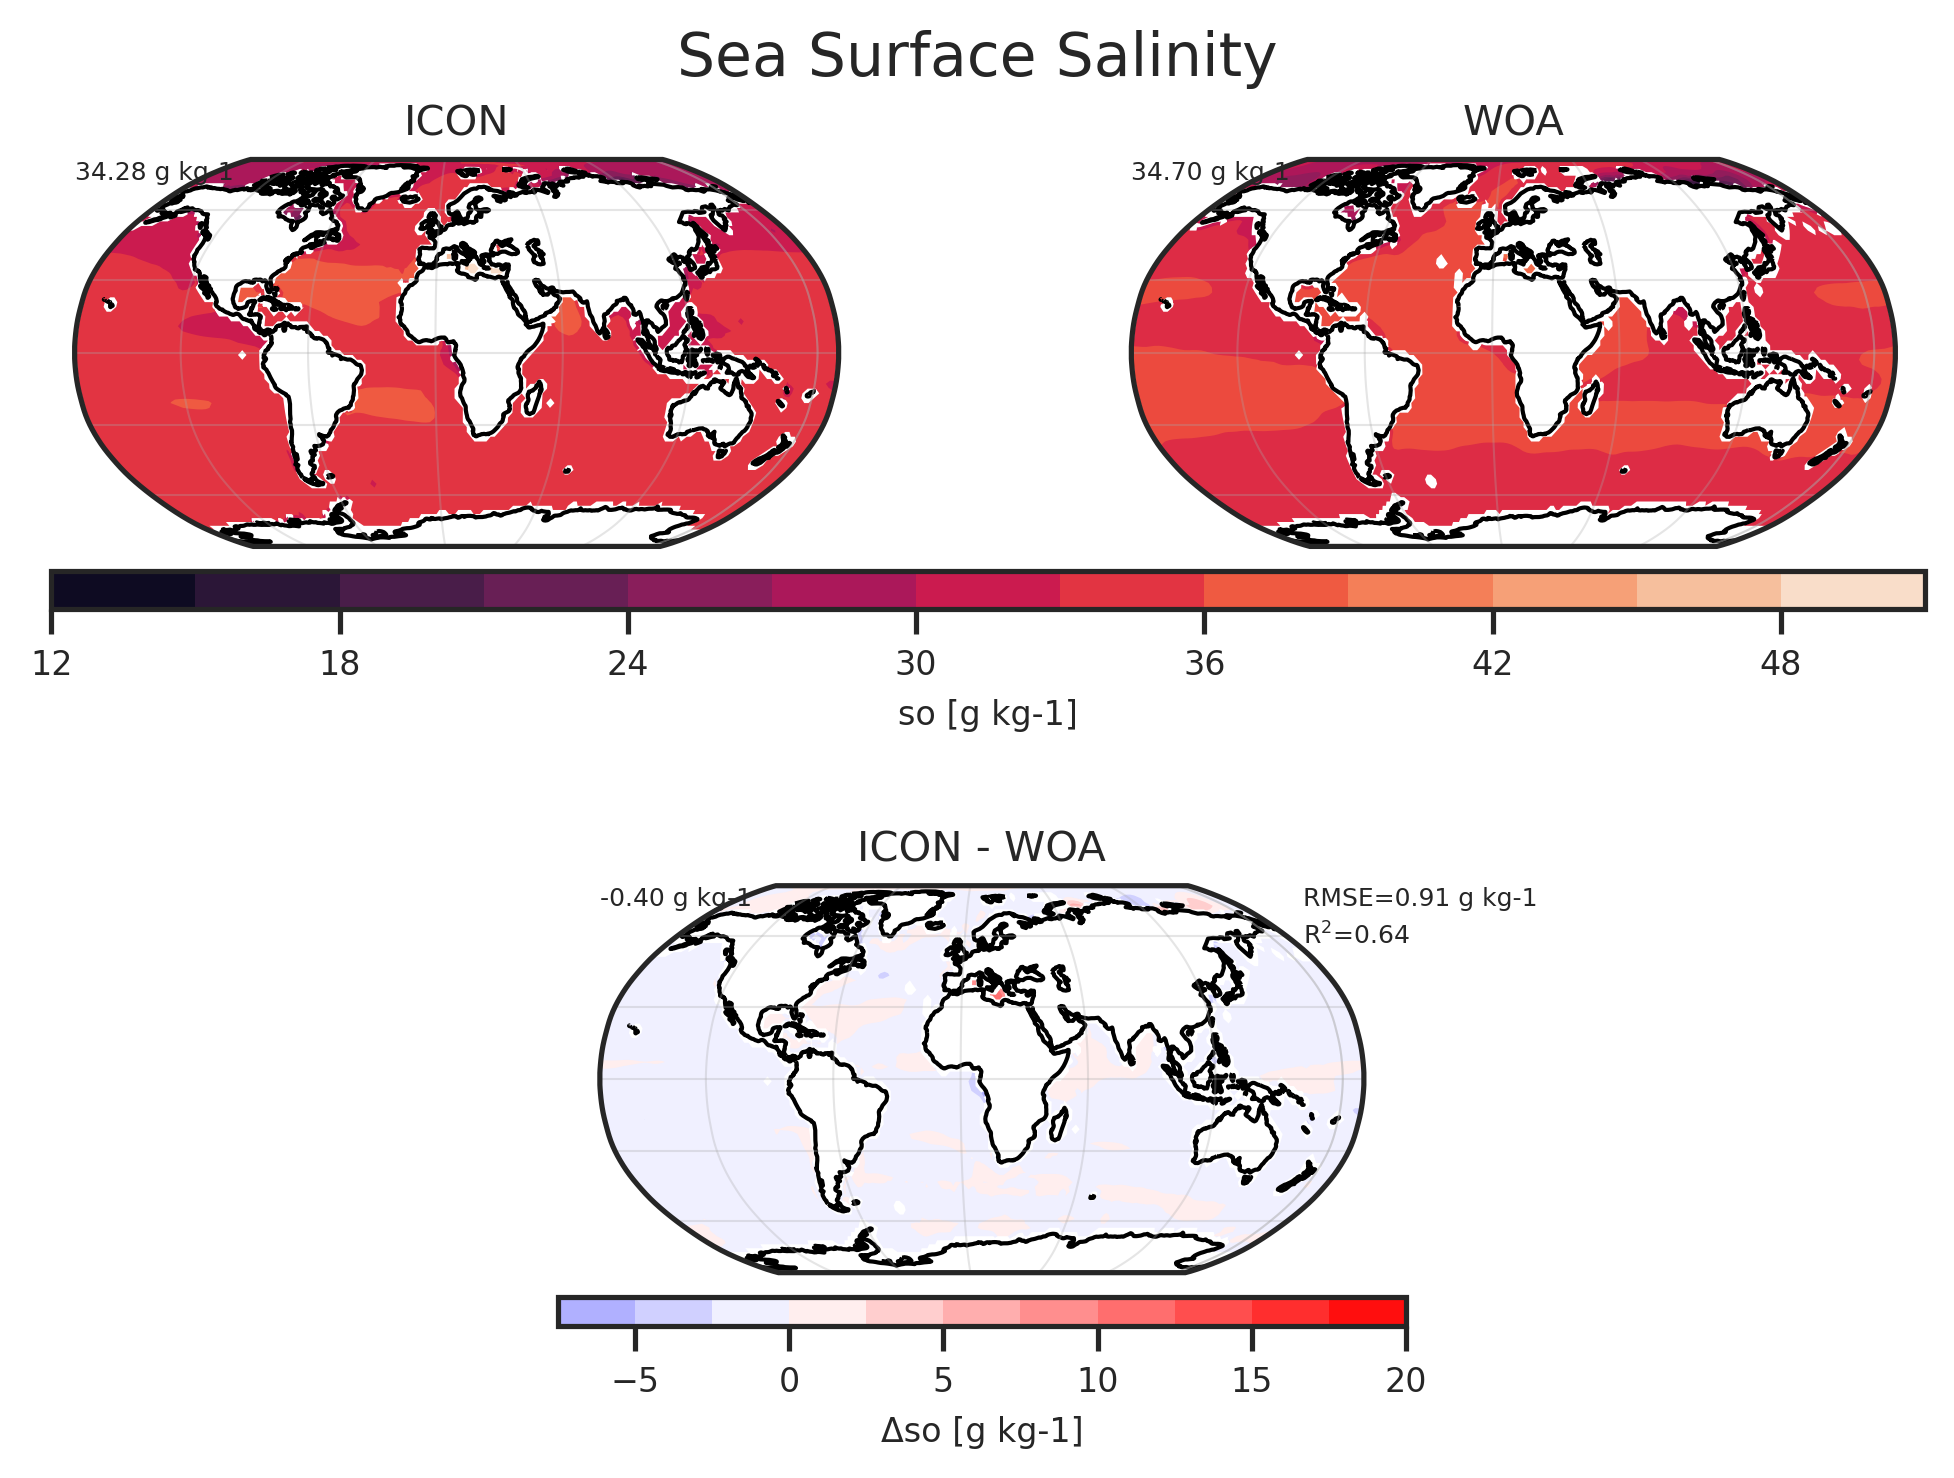
Map plots of sea surface salinity.
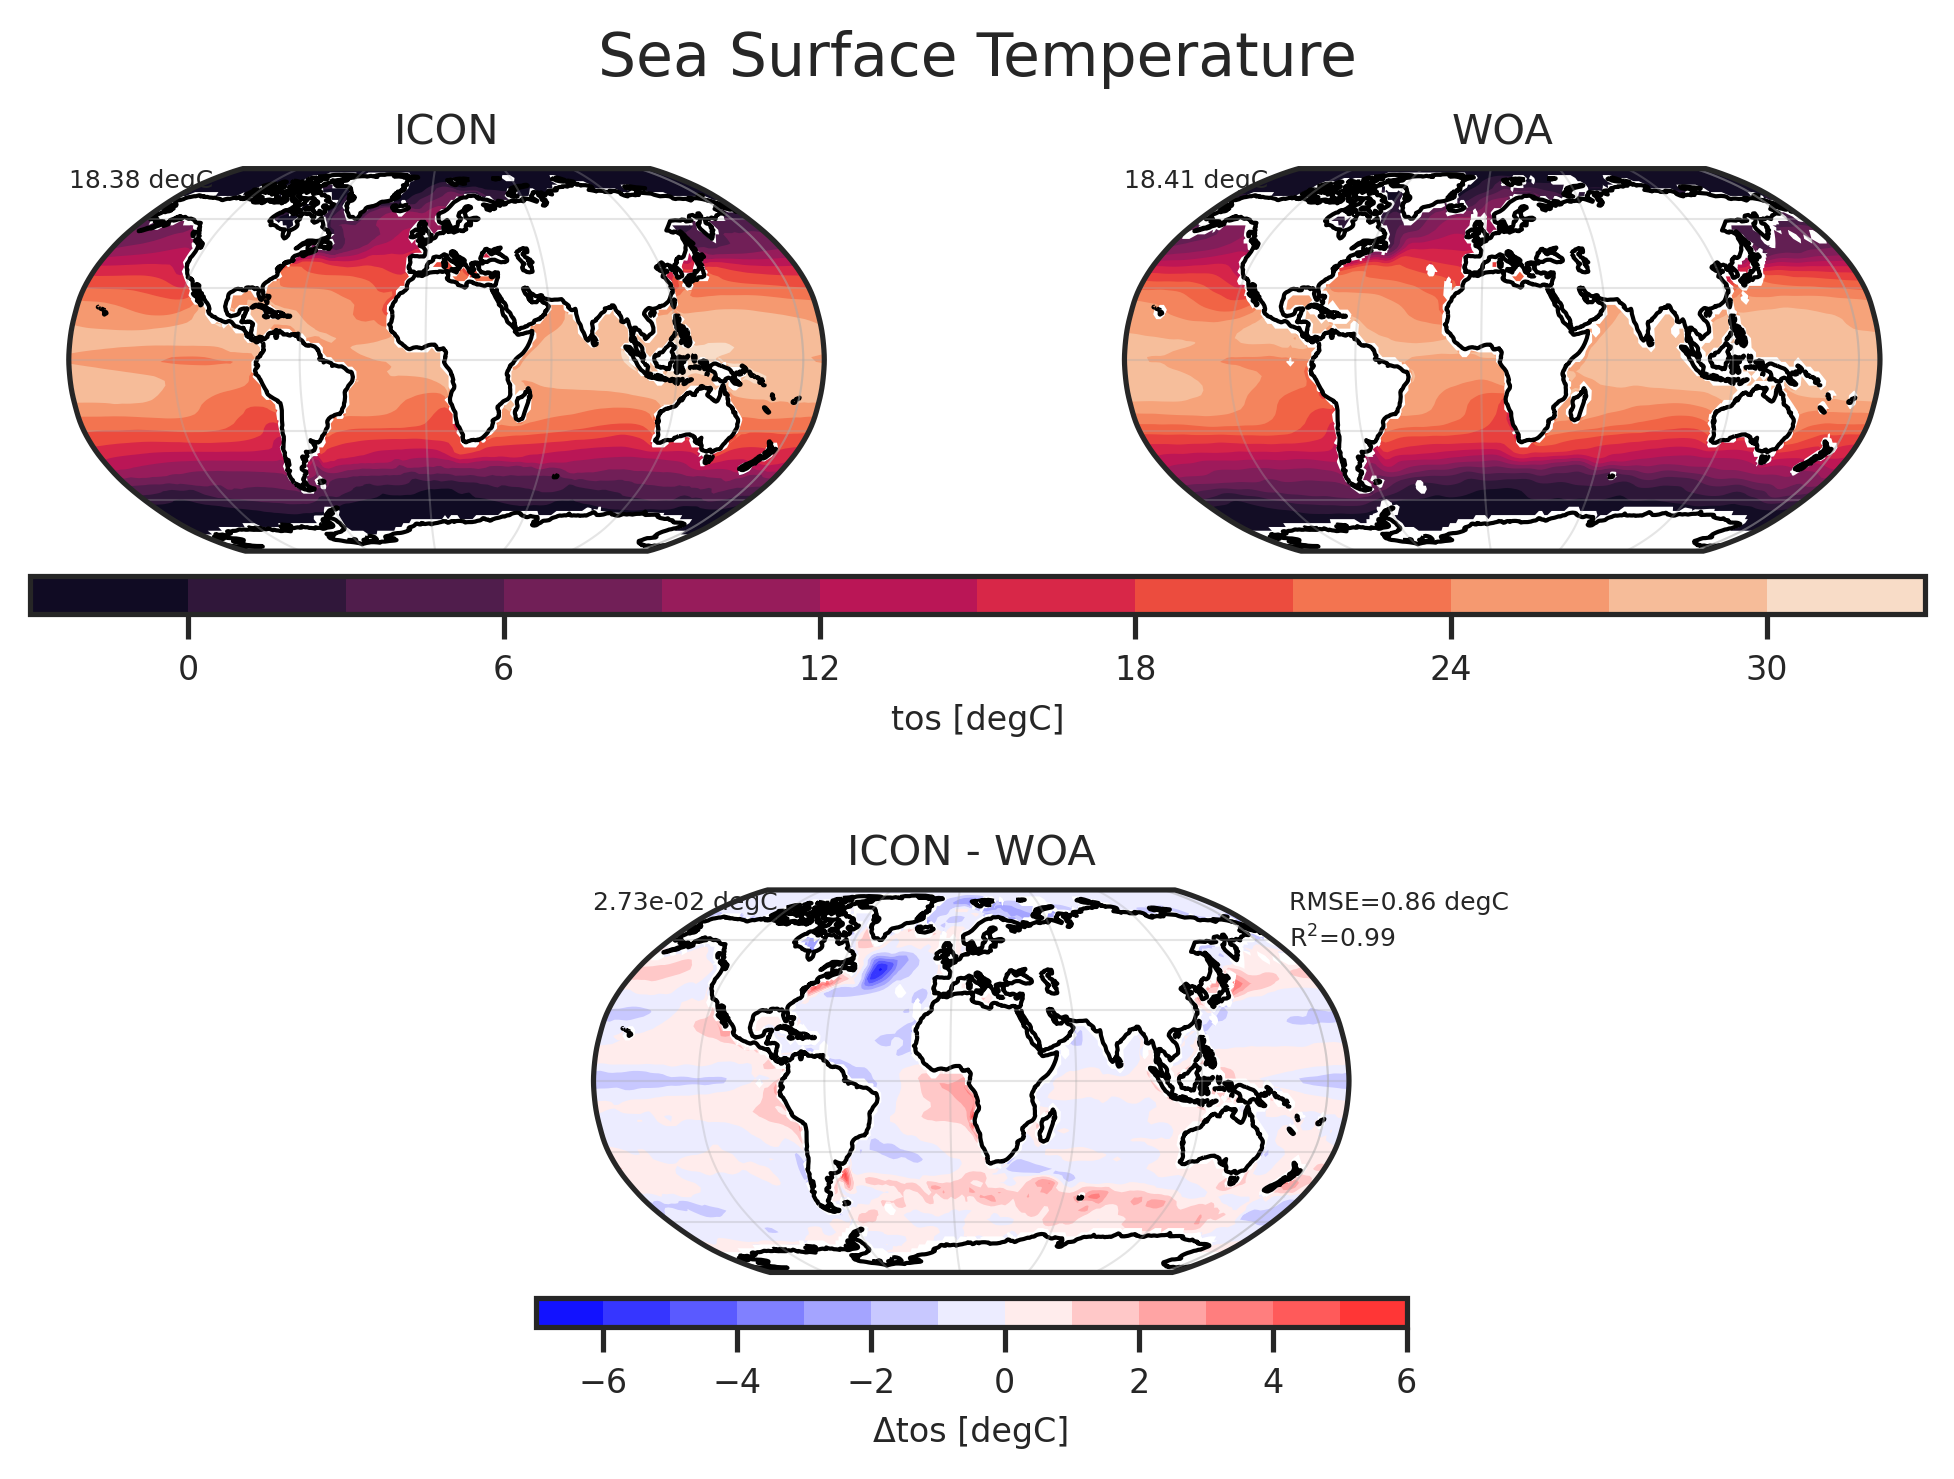
Map plots of sea surface temperature.
main_log.txt | main_log_debug.txt | recipe_ocean_maps.yml | figures | data