2D histograms for different consistency checks.
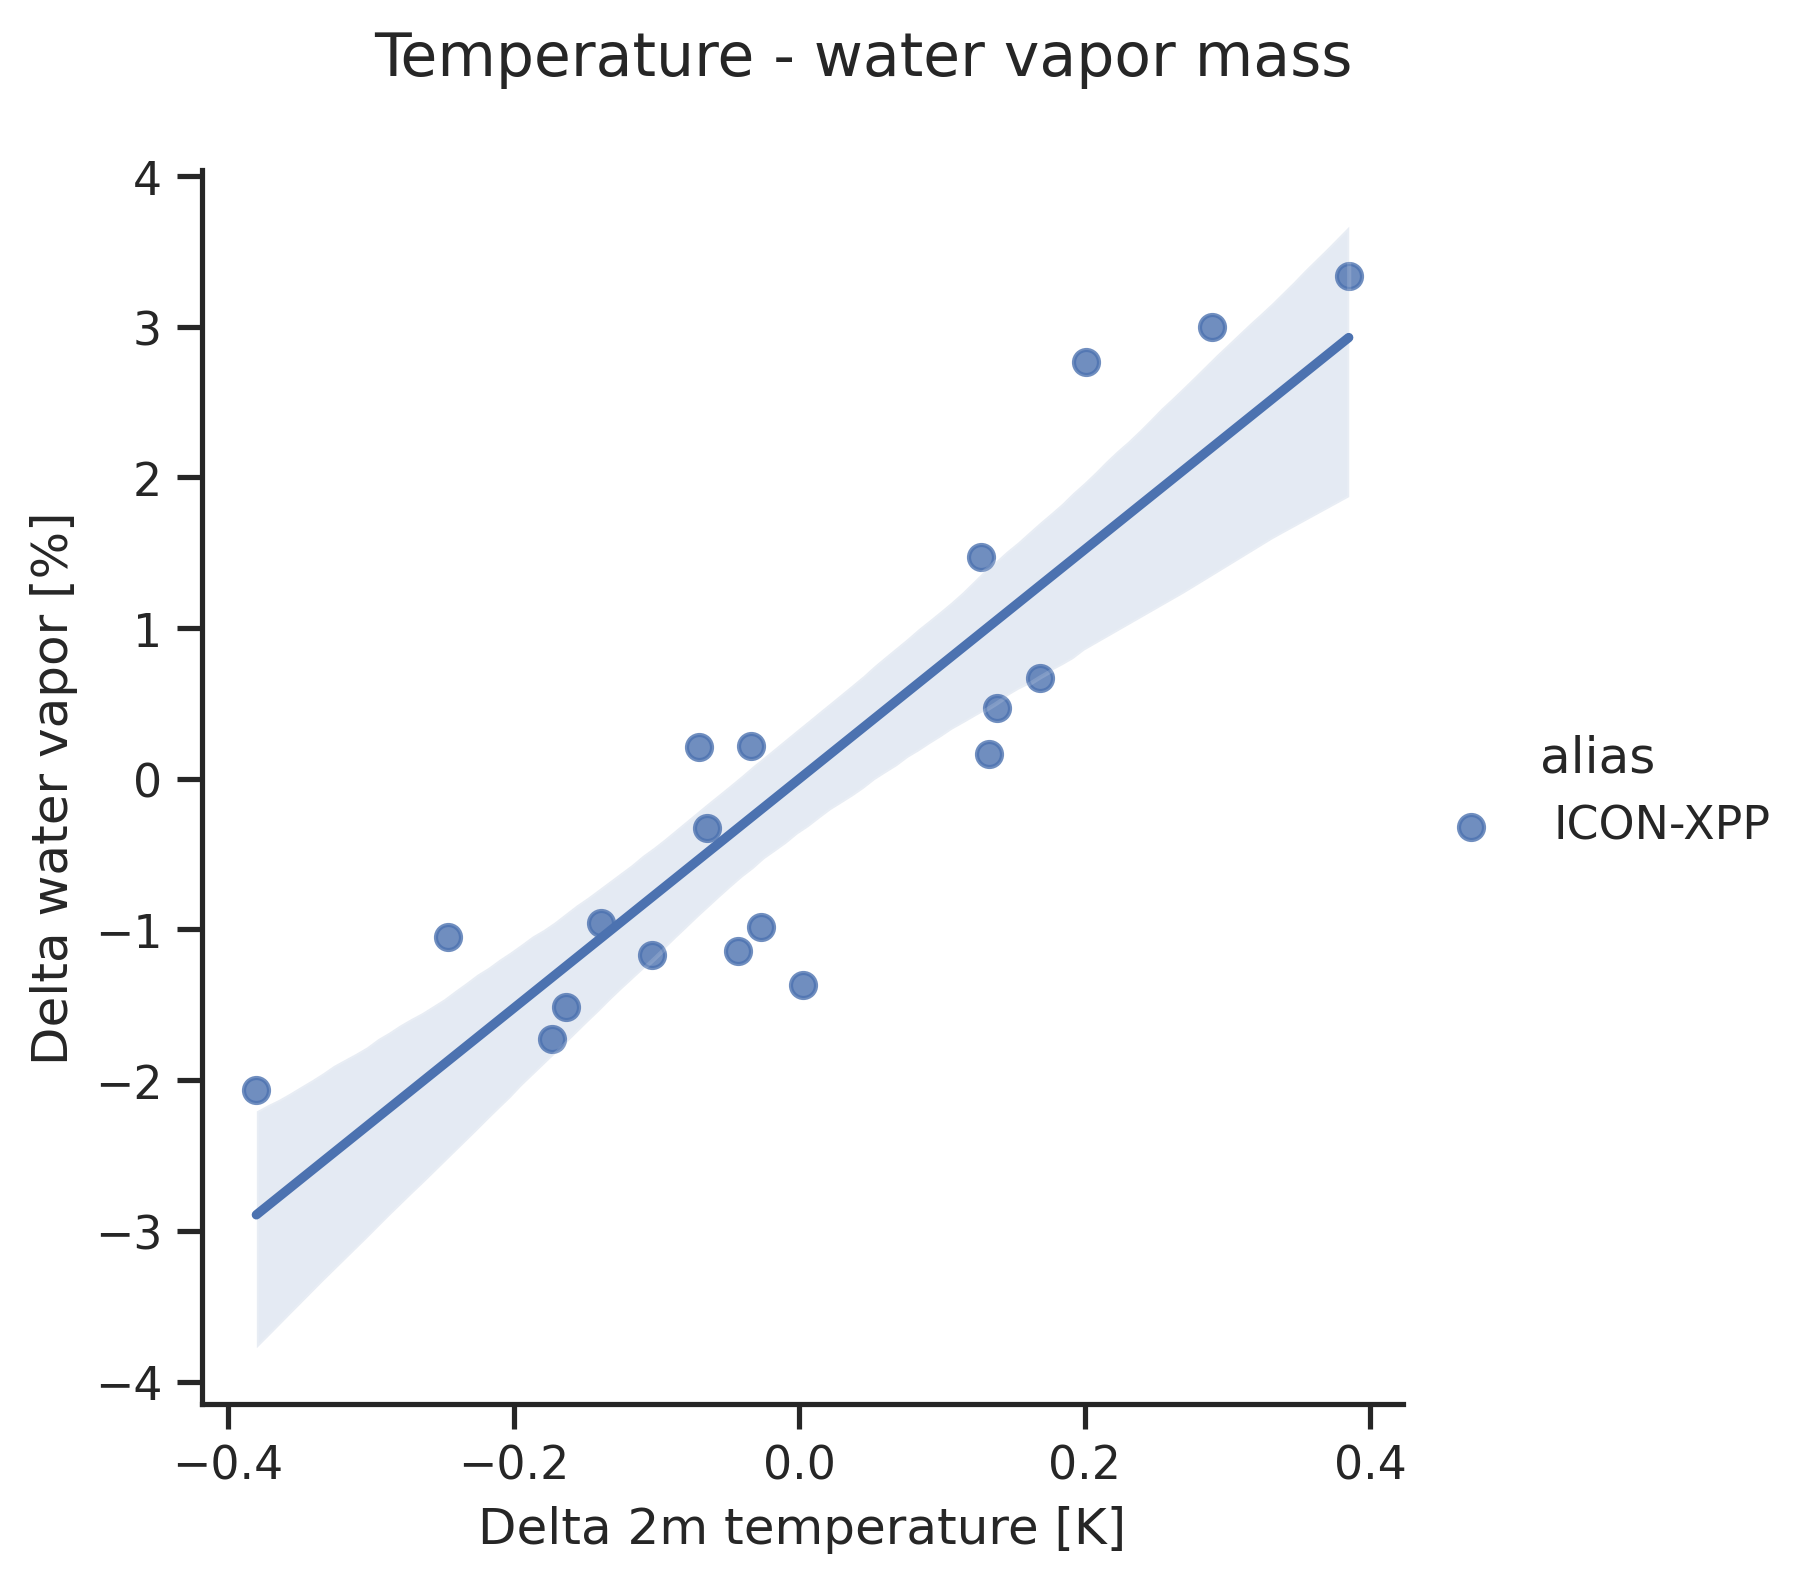
Scatter plot of tas anomalies vs. prw anomalies.
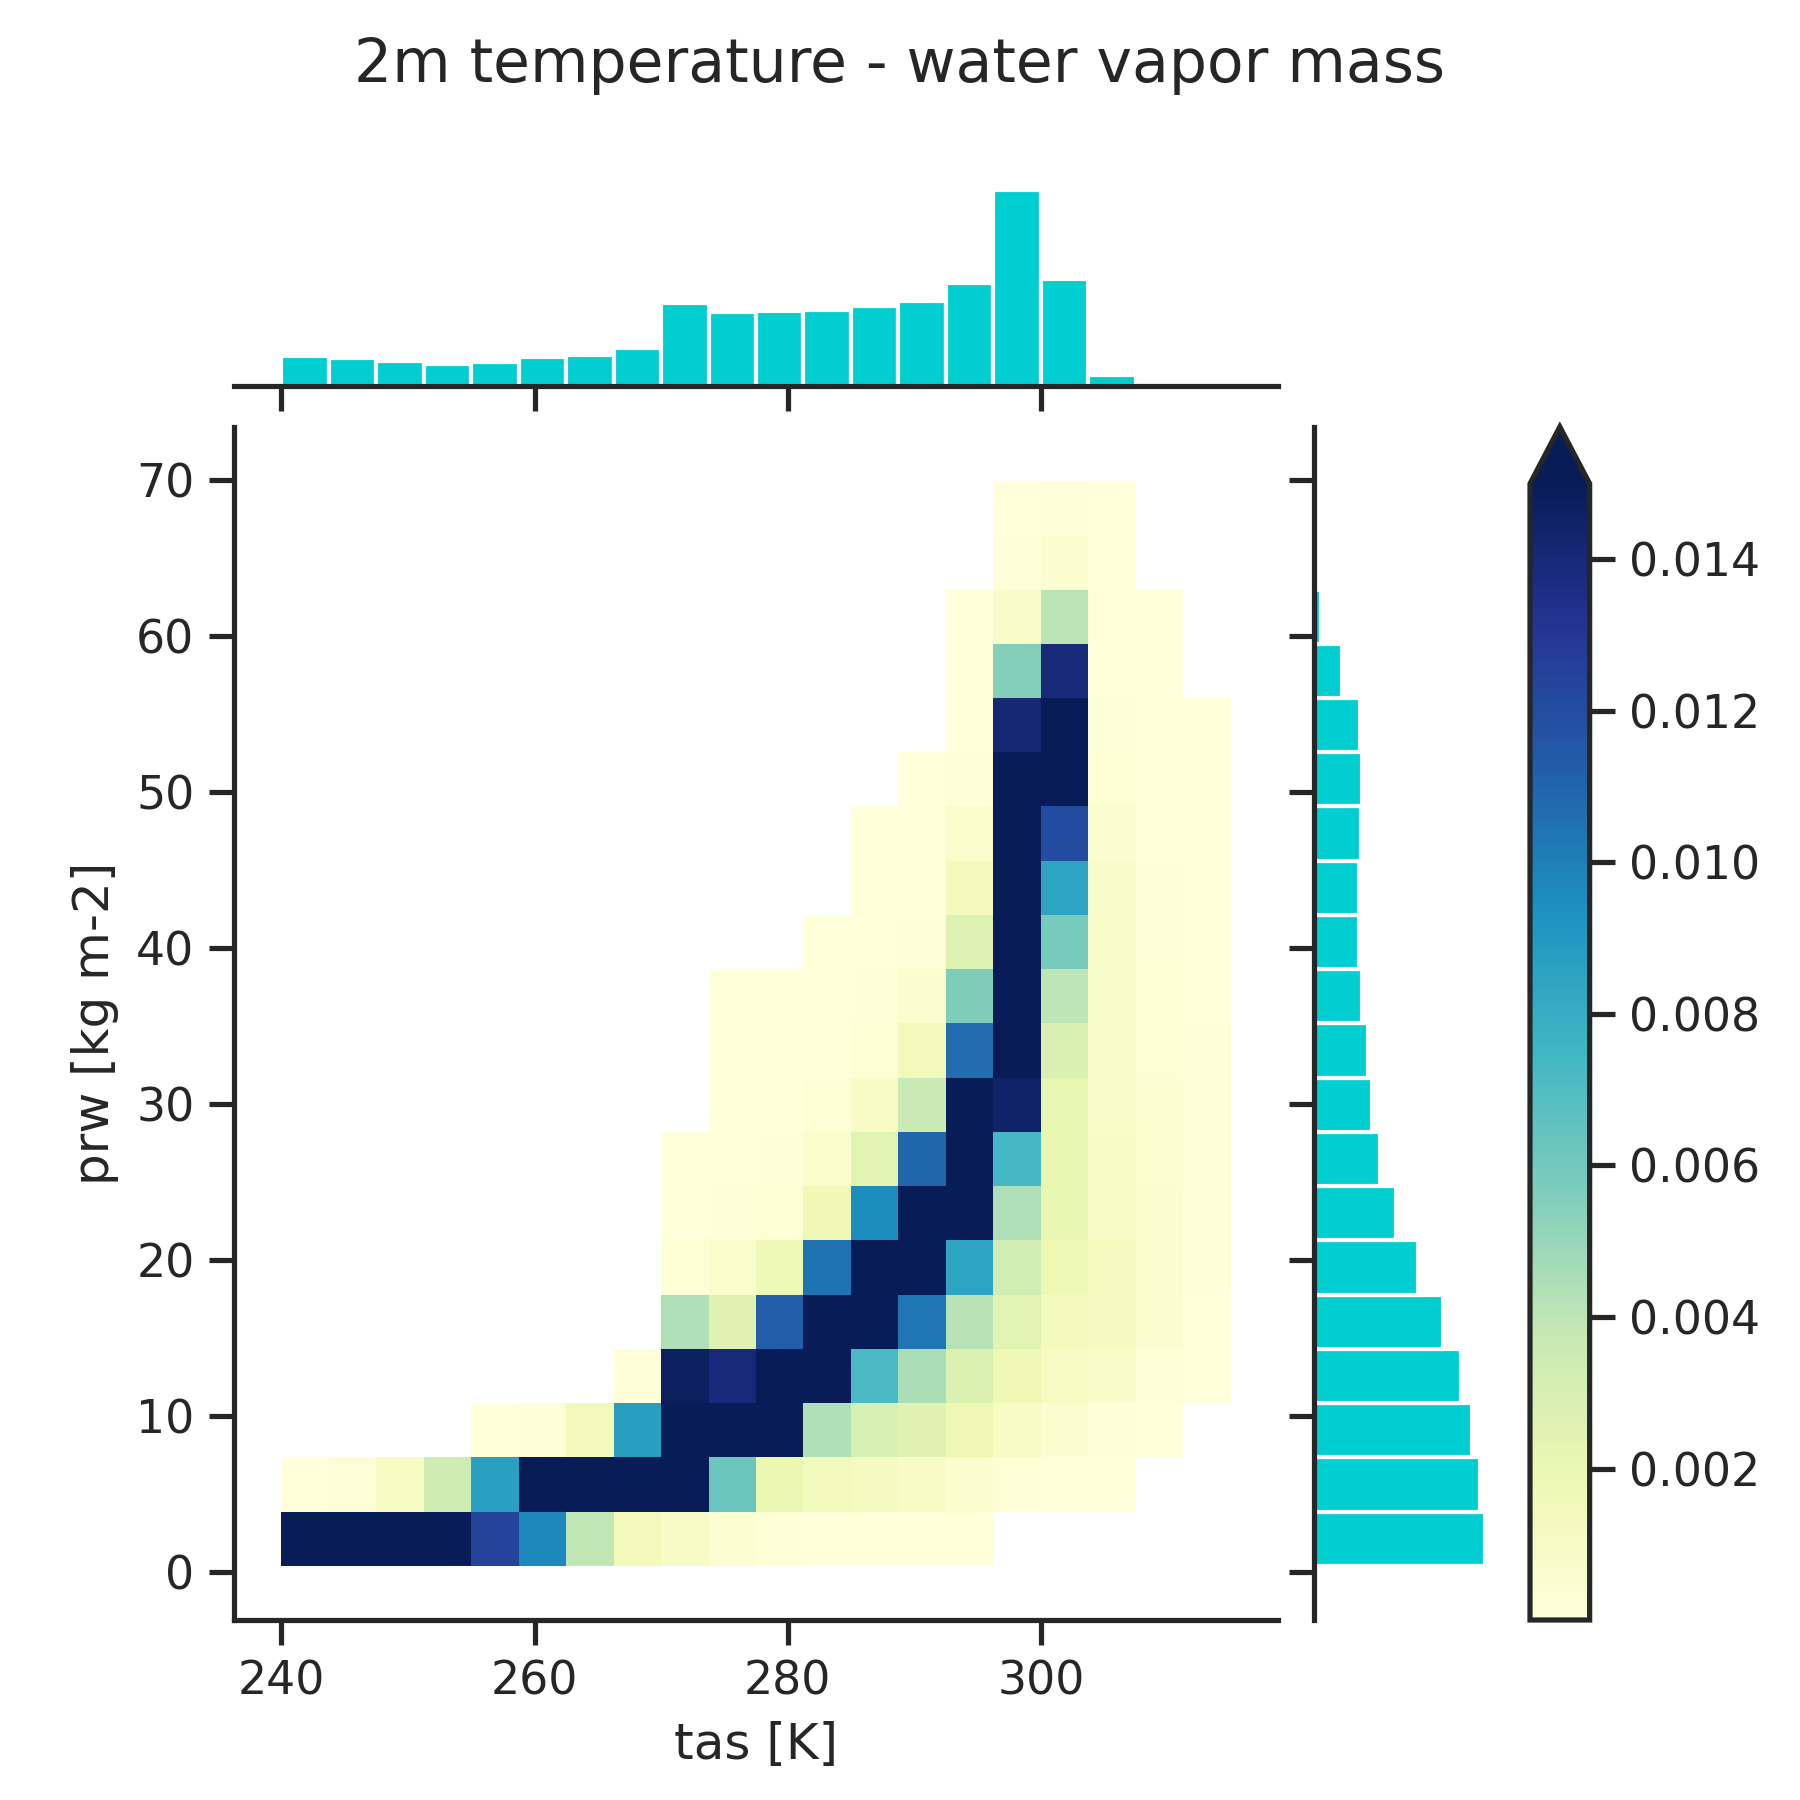
Scatter plot of prw vs. tas.
main_log.txt | main_log_debug.txt | recipe_consistency_checks_scatterplot.yml | figures | data