Diagnostic to plot yearly means of the spacial mean of selected
Climatic Impact-Drivers discussed in Elling et al. 2026.
Plot_Days_Tmax_40
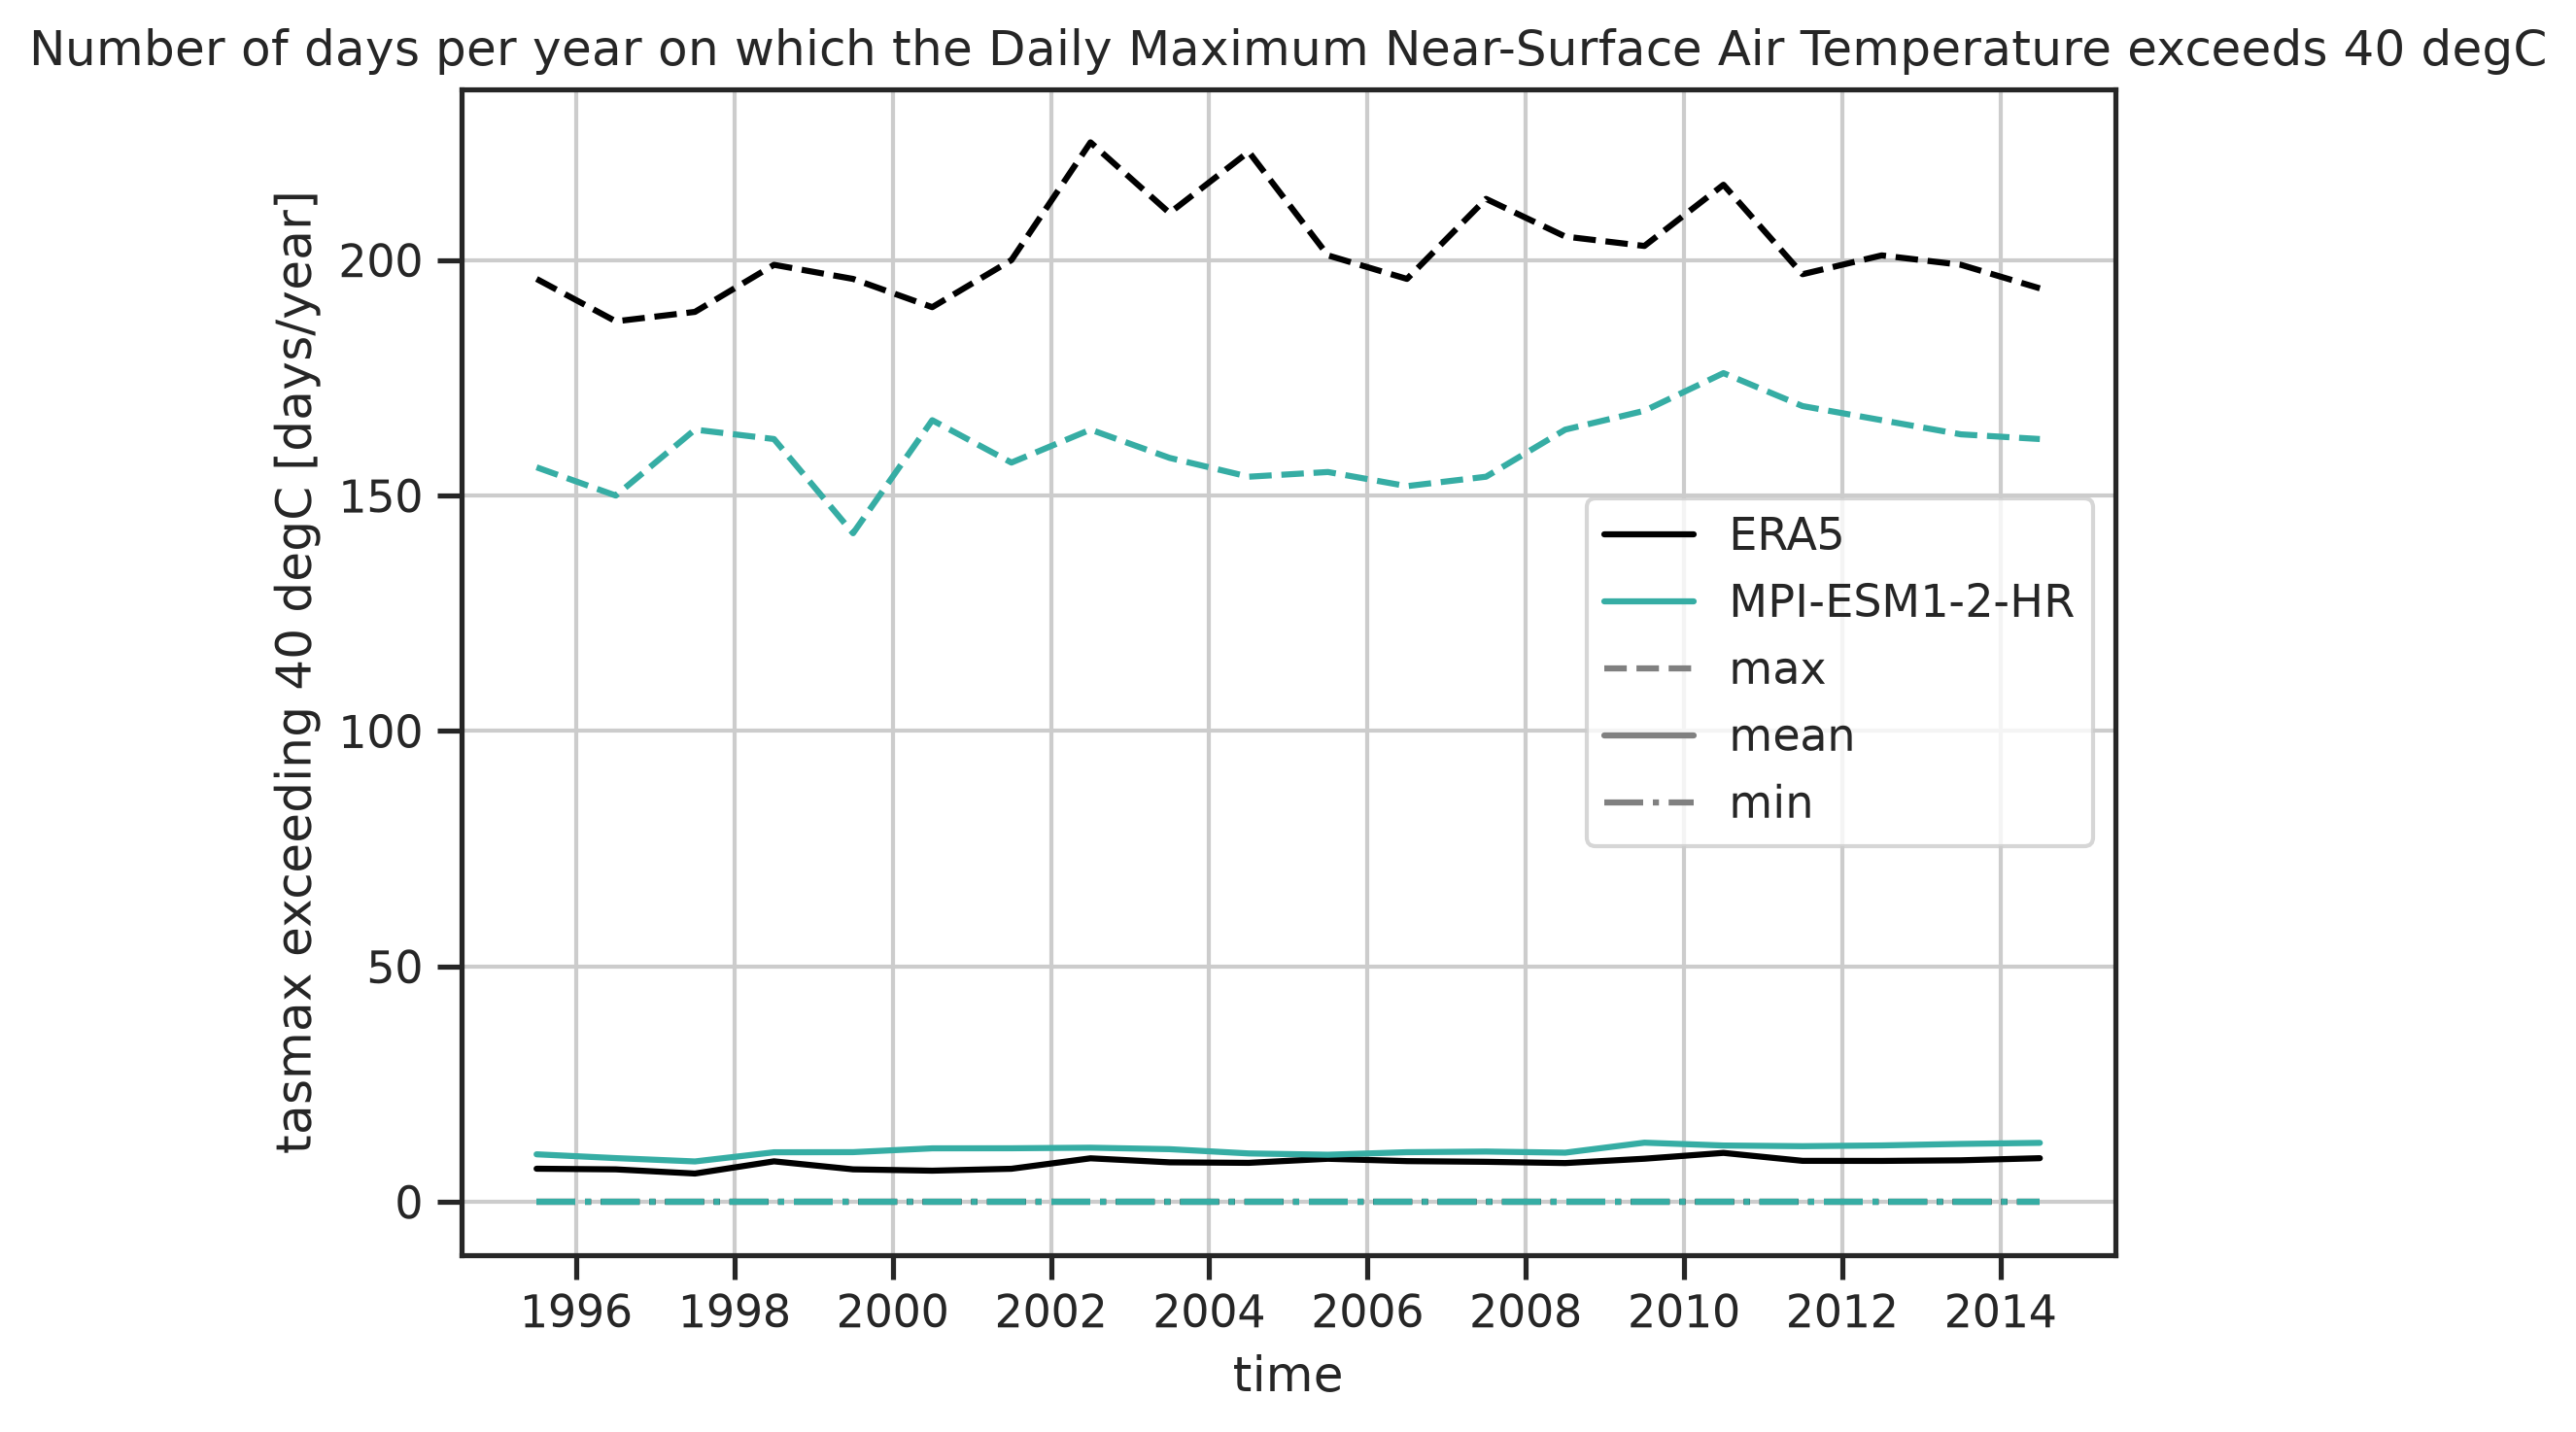
Map showing number of days where the temperature exceeds 40°C.
Plot Days Tmax 40: Diag Number Of Exceeding Days
Data files
Plot Days Tmax 40: Tasmax
Data files
-
/home/b/b309141/scratch/esmvaltool_output/recipe_impacts_timeseries_20260916_123934/preproc/plot_days_tmax_40/tasmax/CMIP6_MPI-ESM1-2-HR_day_historical_r1i1p1f1_tasmax_gn_19950101-20141231.nc |
download |
references |
extra data citation |
provenance
-
/home/b/b309141/scratch/esmvaltool_output/recipe_impacts_timeseries_20260916_123934/preproc/plot_days_tmax_40/tasmax/OBS6_ERA5_reanaly_1_day_tasmax_19950101-20141231.nc |
download |
references |
extra data citation |
provenance
Plot_Days_Tmin_0
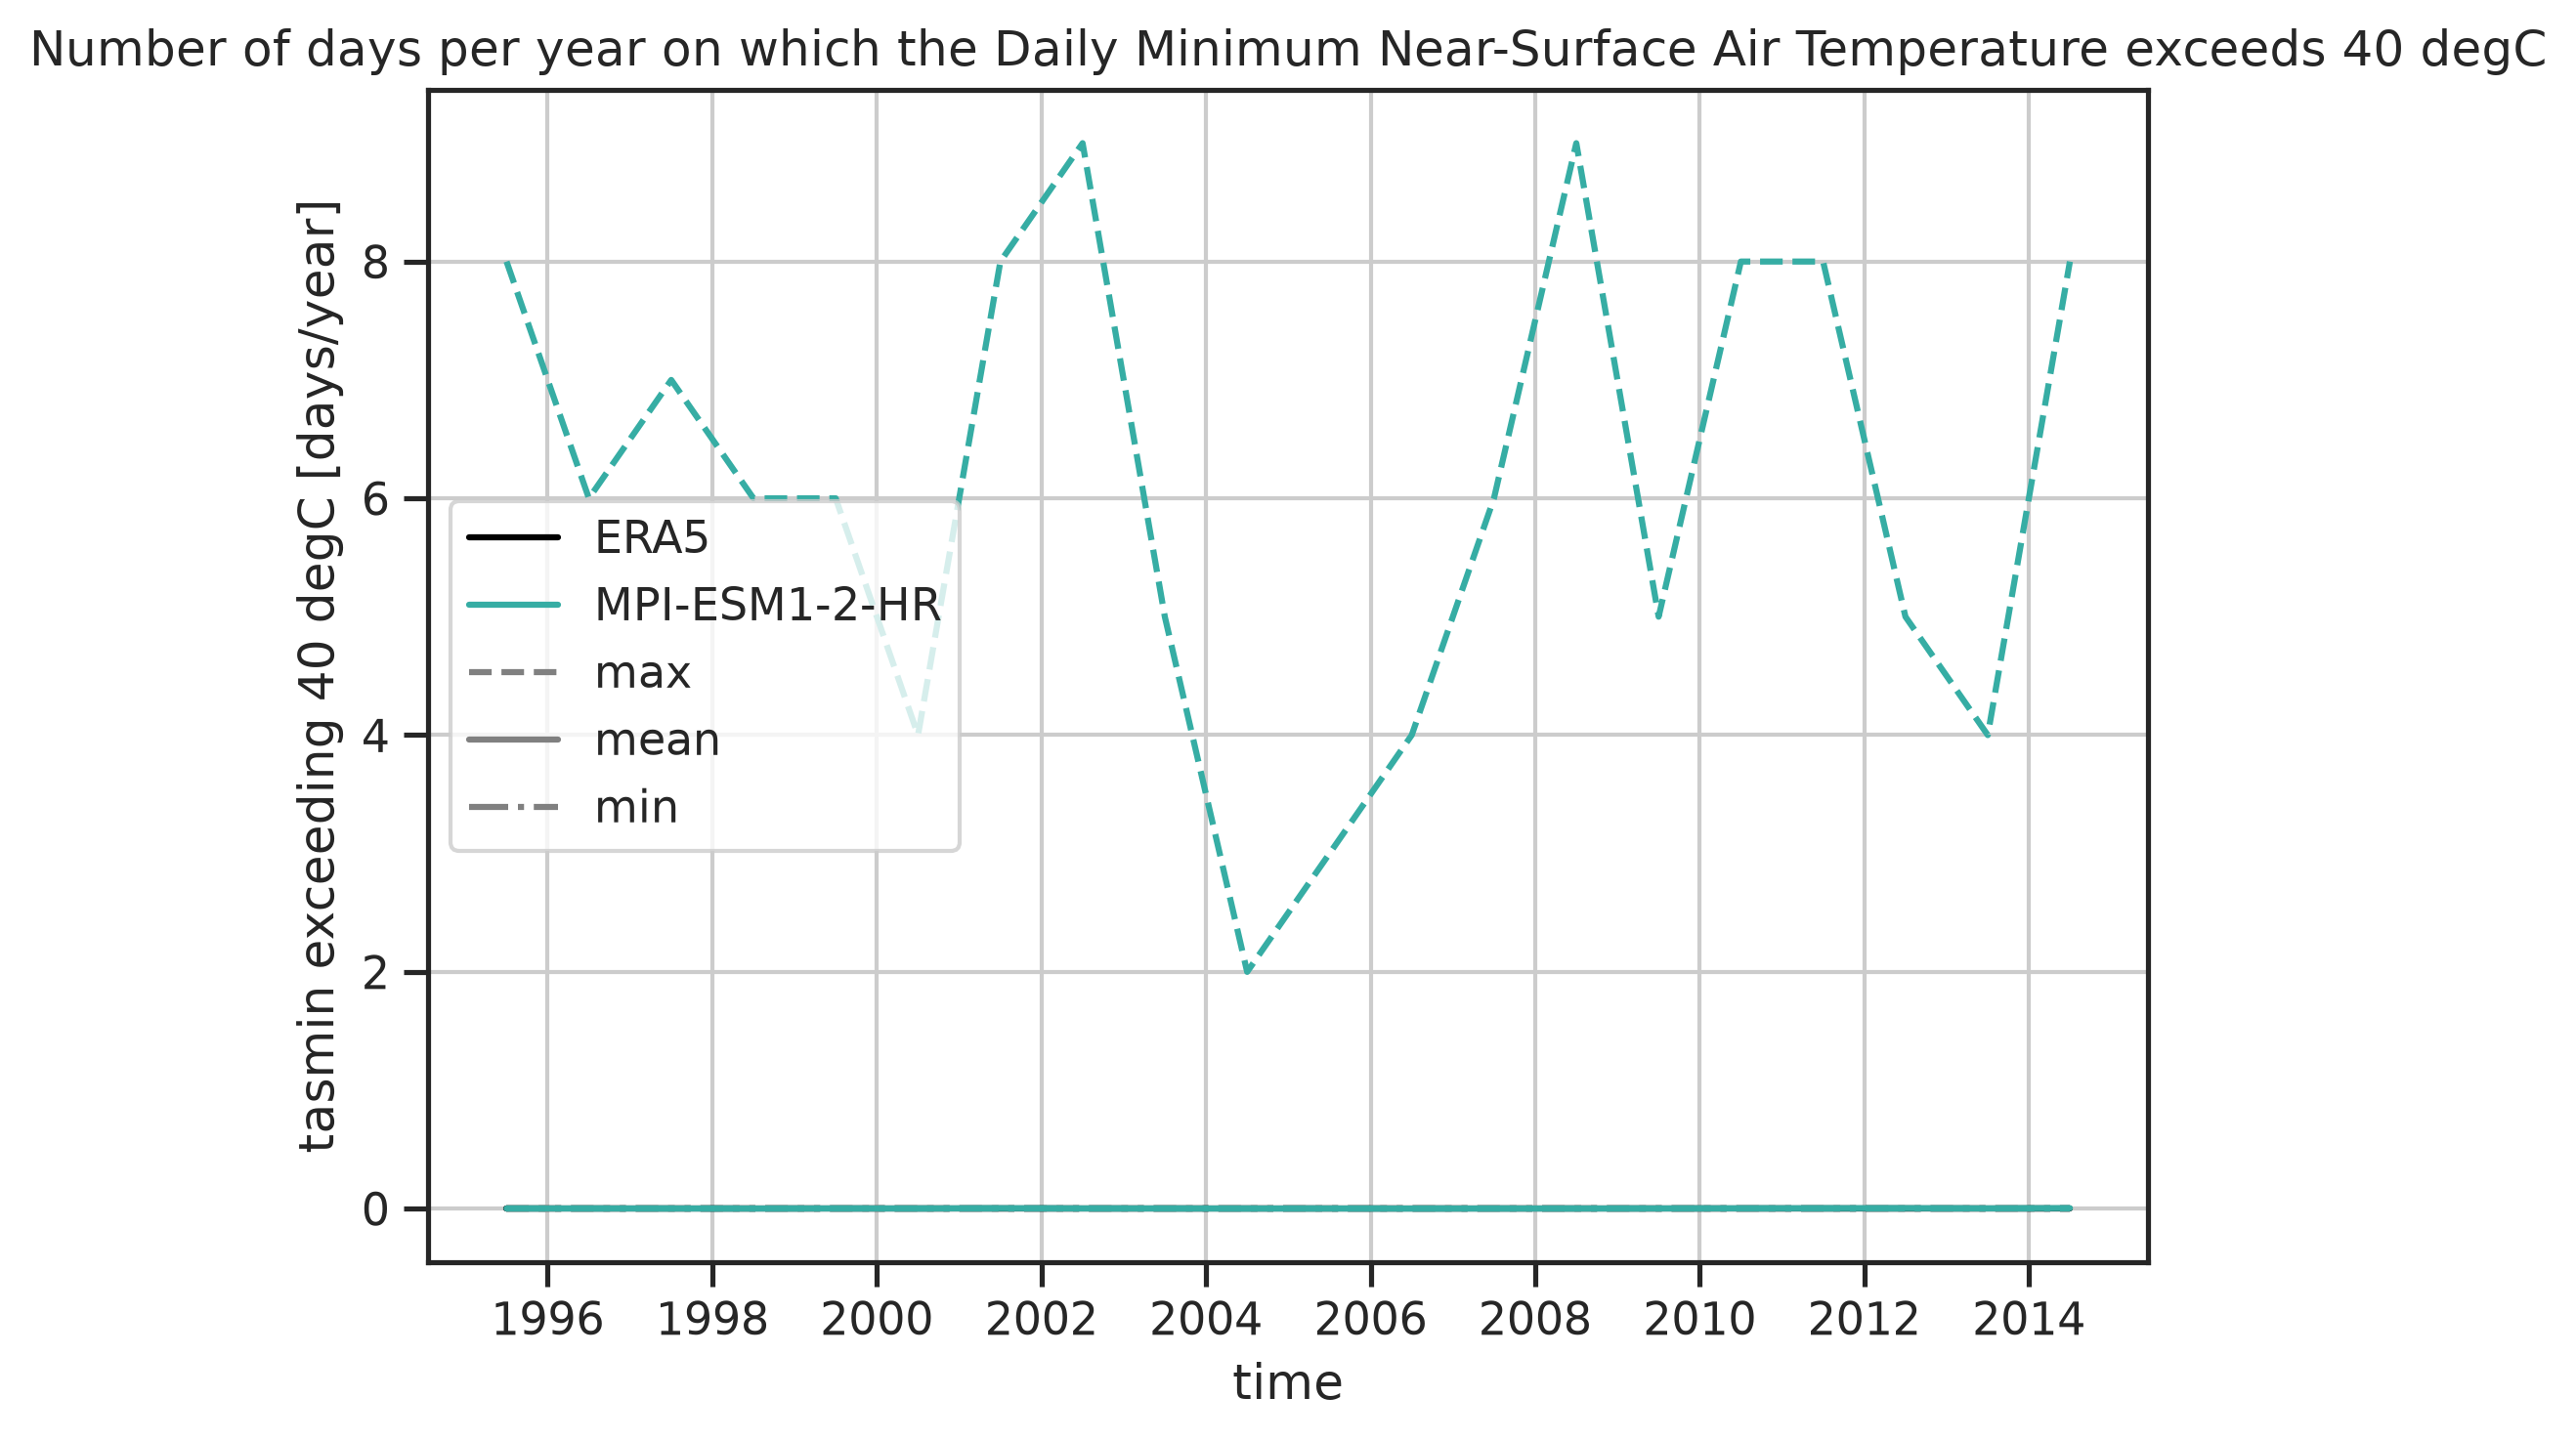
Map showing number of days where the temperature drops below 0°C.
Plot Days Tmin 0: Diag Number Of Exceeding Days
Data files
Plot Days Tmin 0: Tasmin
Data files
-
/home/b/b309141/scratch/esmvaltool_output/recipe_impacts_timeseries_20260916_123934/preproc/plot_days_tmin_0/tasmin/CMIP6_MPI-ESM1-2-HR_day_historical_r1i1p1f1_tasmin_gn_19950101-20141231.nc |
download |
references |
extra data citation |
provenance
-
/home/b/b309141/scratch/esmvaltool_output/recipe_impacts_timeseries_20260916_123934/preproc/plot_days_tmin_0/tasmin/OBS6_ERA5_reanaly_1_day_tasmin_19950101-20141231.nc |
download |
references |
extra data citation |
provenance
Plot_Days_Prmaxthreshold1
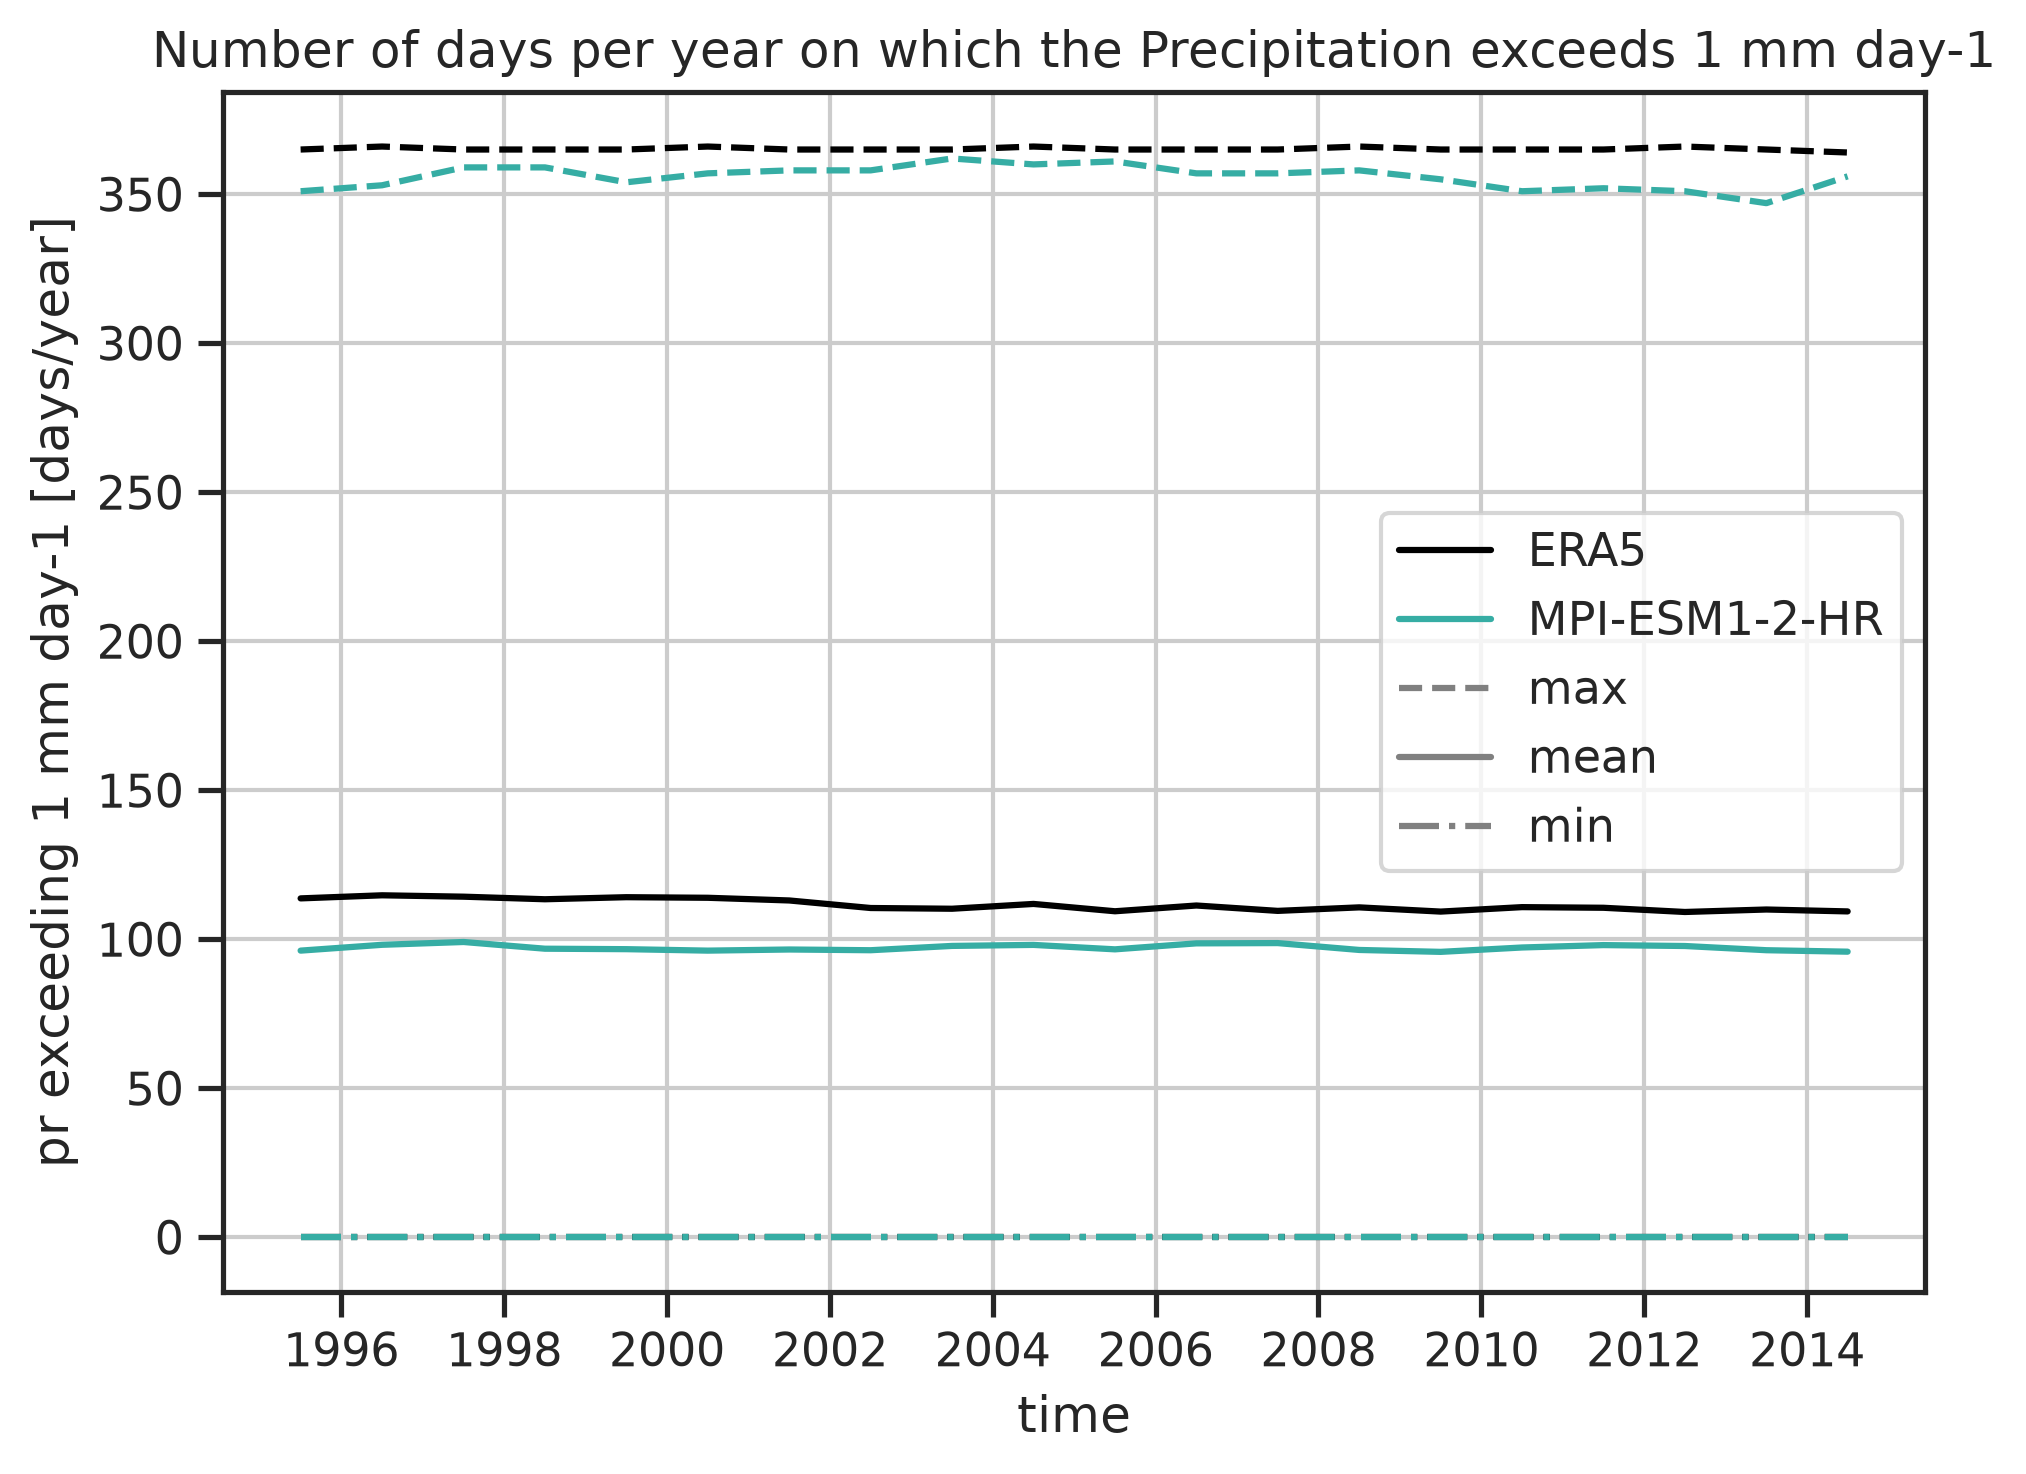
Map showing number of days where the rain rate exceeds 1 mm.
Plot Days Prmaxthreshold1: Diag Number Of Exceeding Days
Data files
Plot Days Prmaxthreshold1: Pr
Data files
-
/home/b/b309141/scratch/esmvaltool_output/recipe_impacts_timeseries_20260916_123934/preproc/plot_days_prmaxthreshold1/pr/CMIP6_MPI-ESM1-2-HR_day_historical_r1i1p1f1_pr_gn_19950101-20141231.nc |
download |
references |
extra data citation |
provenance
-
/home/b/b309141/scratch/esmvaltool_output/recipe_impacts_timeseries_20260916_123934/preproc/plot_days_prmaxthreshold1/pr/OBS6_ERA5_reanaly_1_day_pr_19950101-20141231.nc |
download |
references |
extra data citation |
provenance
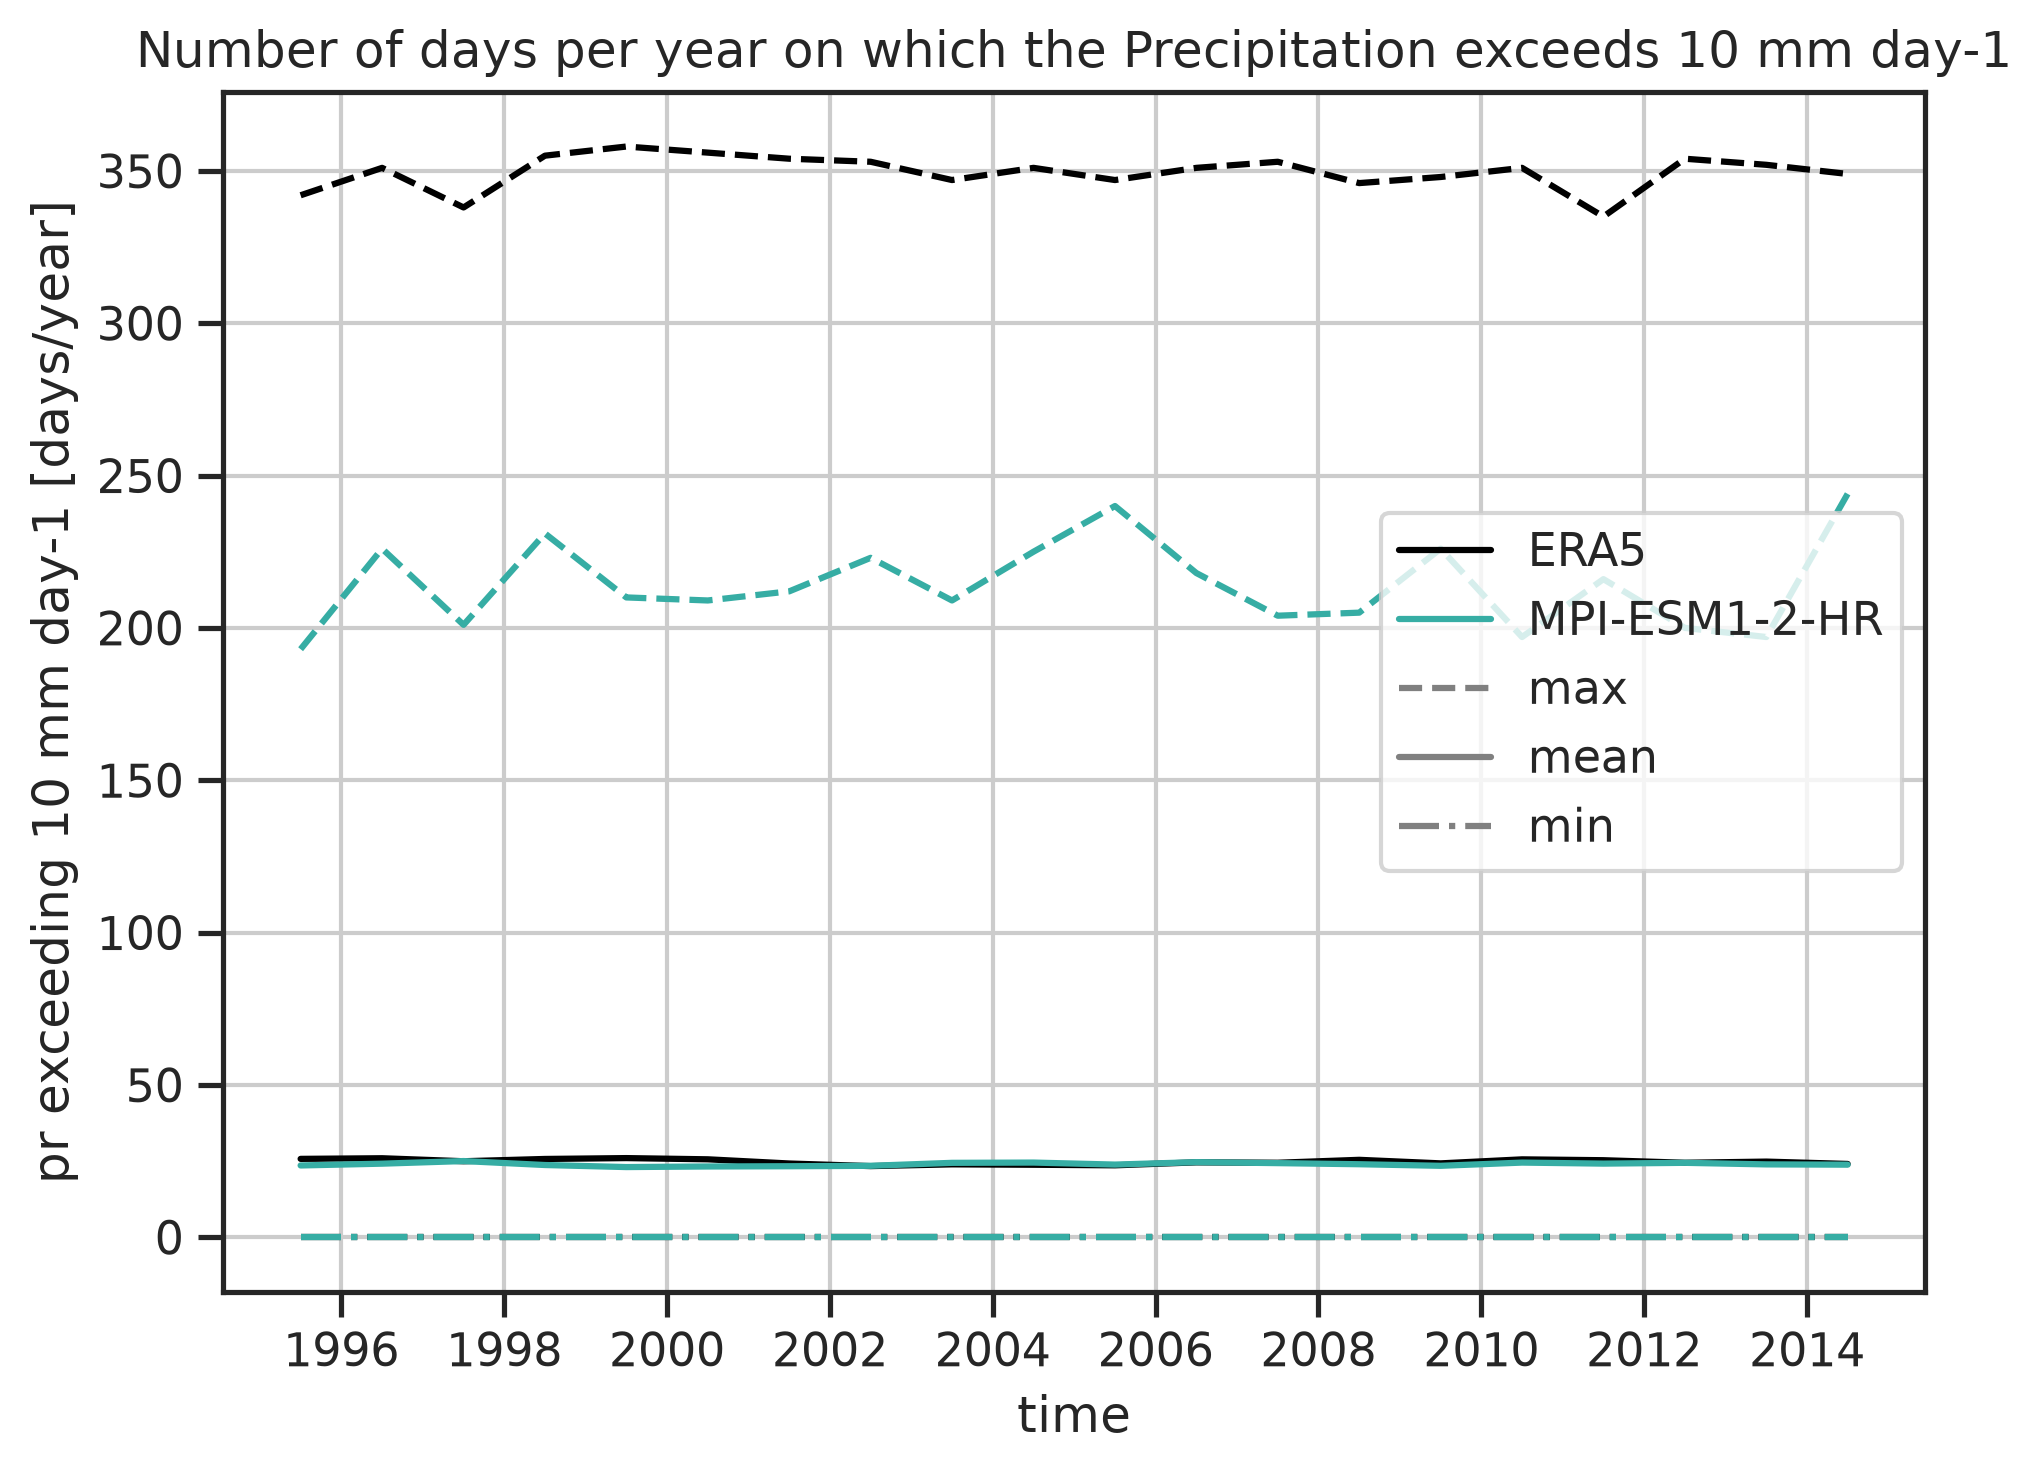
Plot_Days_Prmaxthreshold10
Map showing number of days where the rain rate exceeds 10 mm.
Plot Days Prmaxthreshold10: Diag Number Of Exceeding Days
Data files
Plot Days Prmaxthreshold10: Pr
Data files
-
/home/b/b309141/scratch/esmvaltool_output/recipe_impacts_timeseries_20260916_123934/preproc/plot_days_prmaxthreshold10/pr/CMIP6_MPI-ESM1-2-HR_day_historical_r1i1p1f1_pr_gn_19950101-20141231.nc |
download |
references |
extra data citation |
provenance
-
/home/b/b309141/scratch/esmvaltool_output/recipe_impacts_timeseries_20260916_123934/preproc/plot_days_prmaxthreshold10/pr/OBS6_ERA5_reanaly_1_day_pr_19950101-20141231.nc |
download |
references |
extra data citation |
provenance
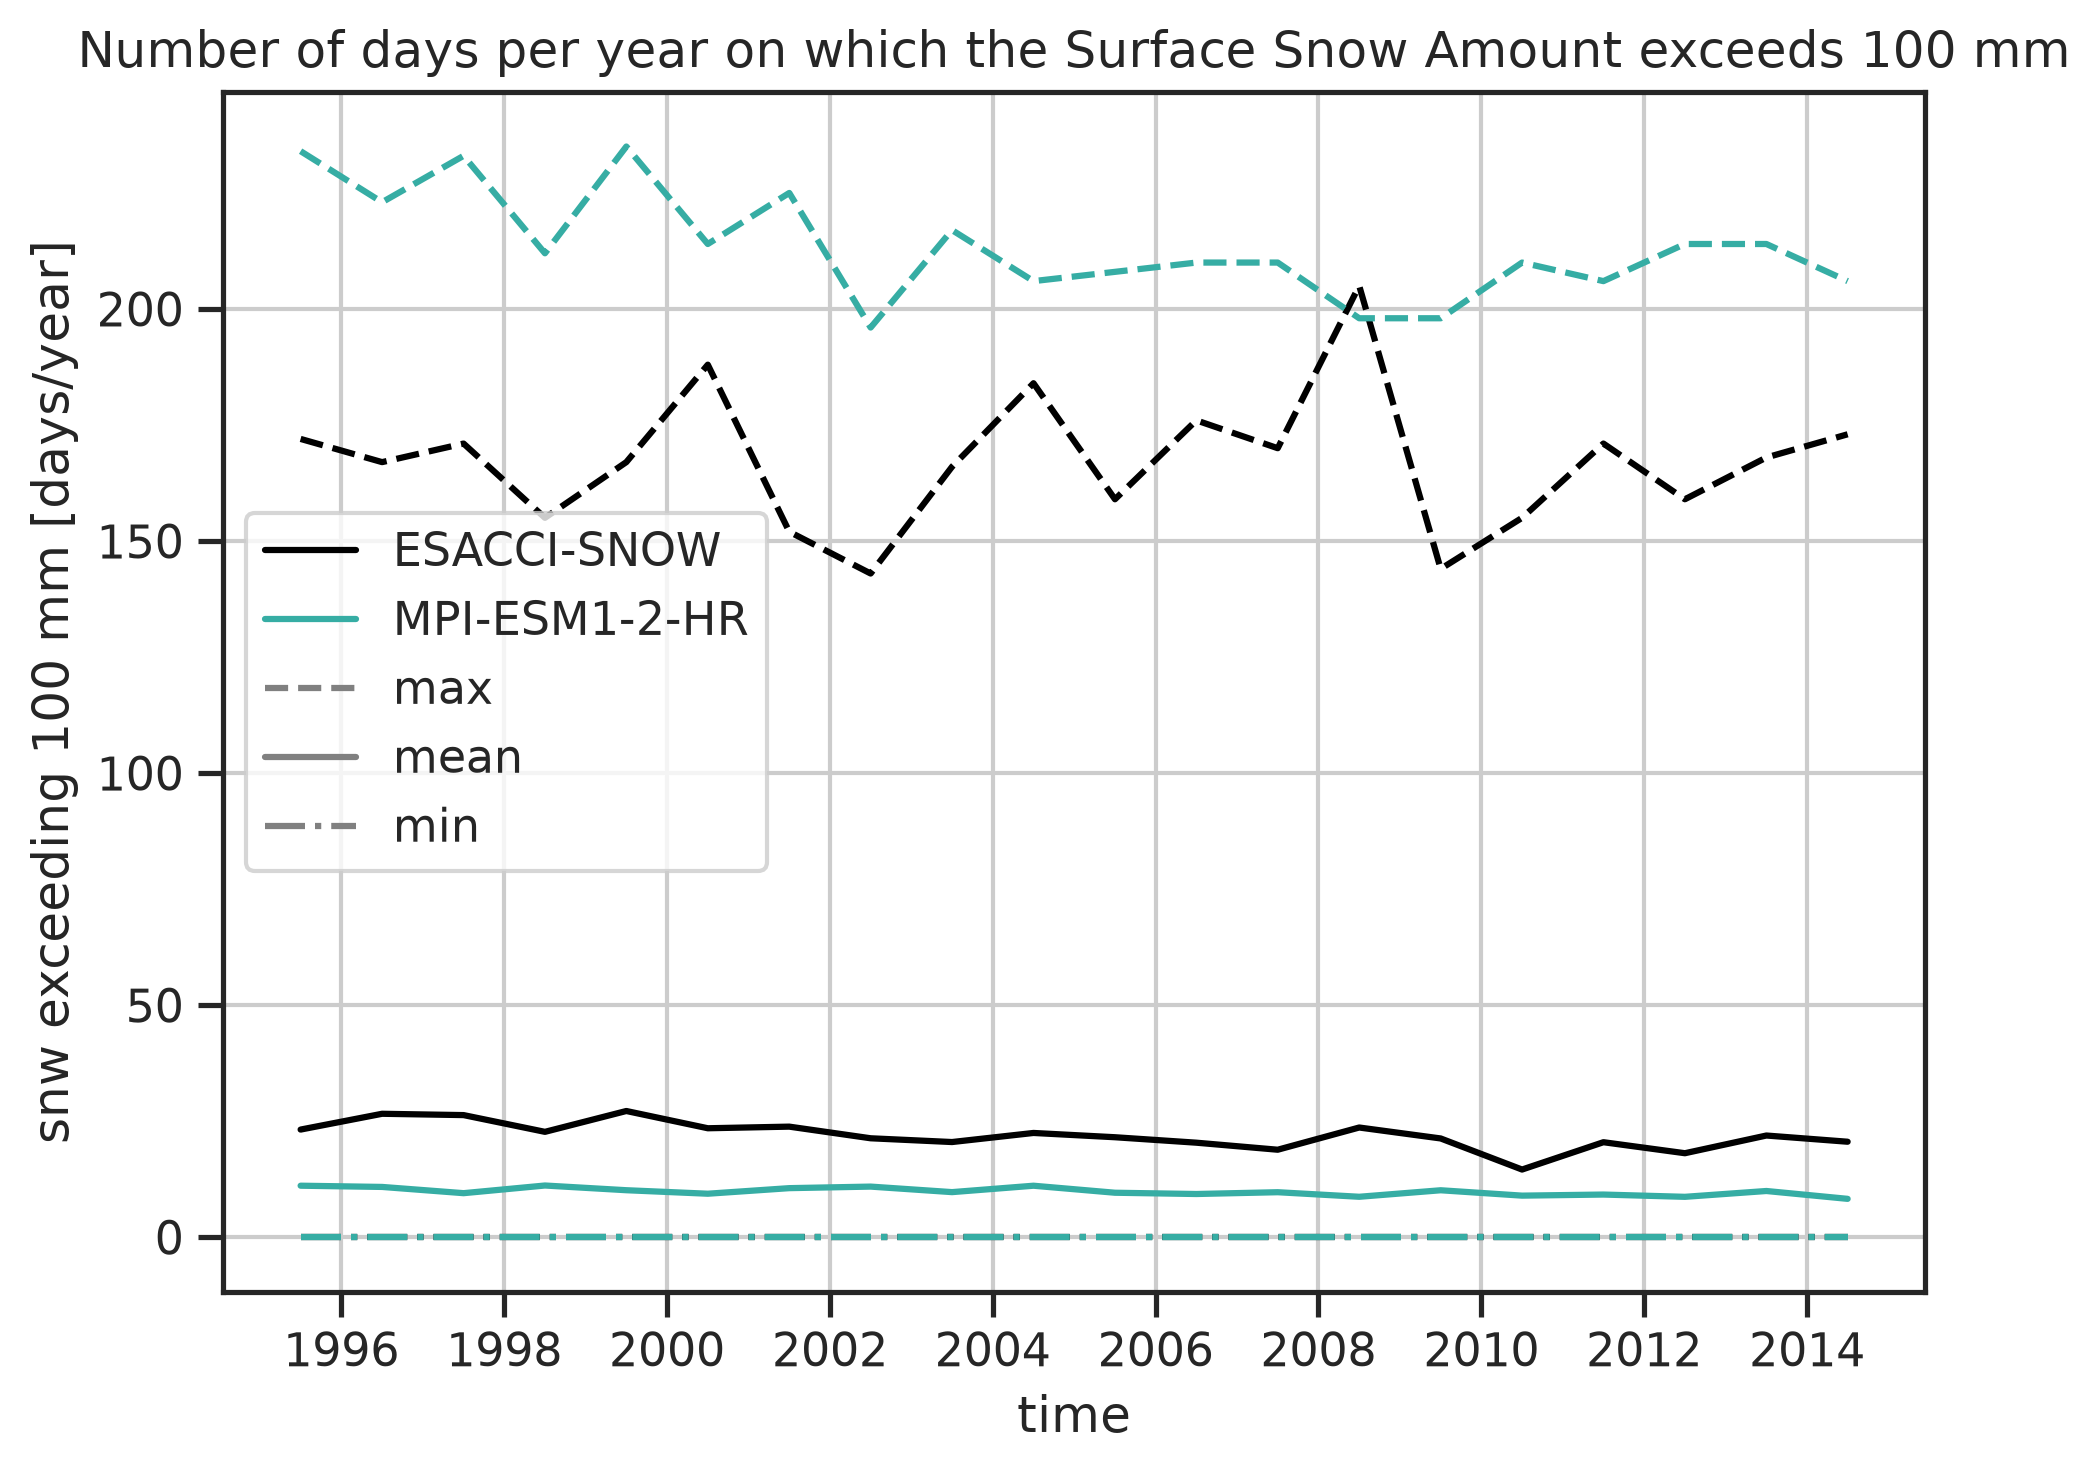
Plot_Snwe_10
Map showing number of days there is more than 10 cm of snow water equivalent.
Plot Snwe 10: Diag Number Of Exceeding Days
Data files
Plot Snwe 10: Snw
Data files
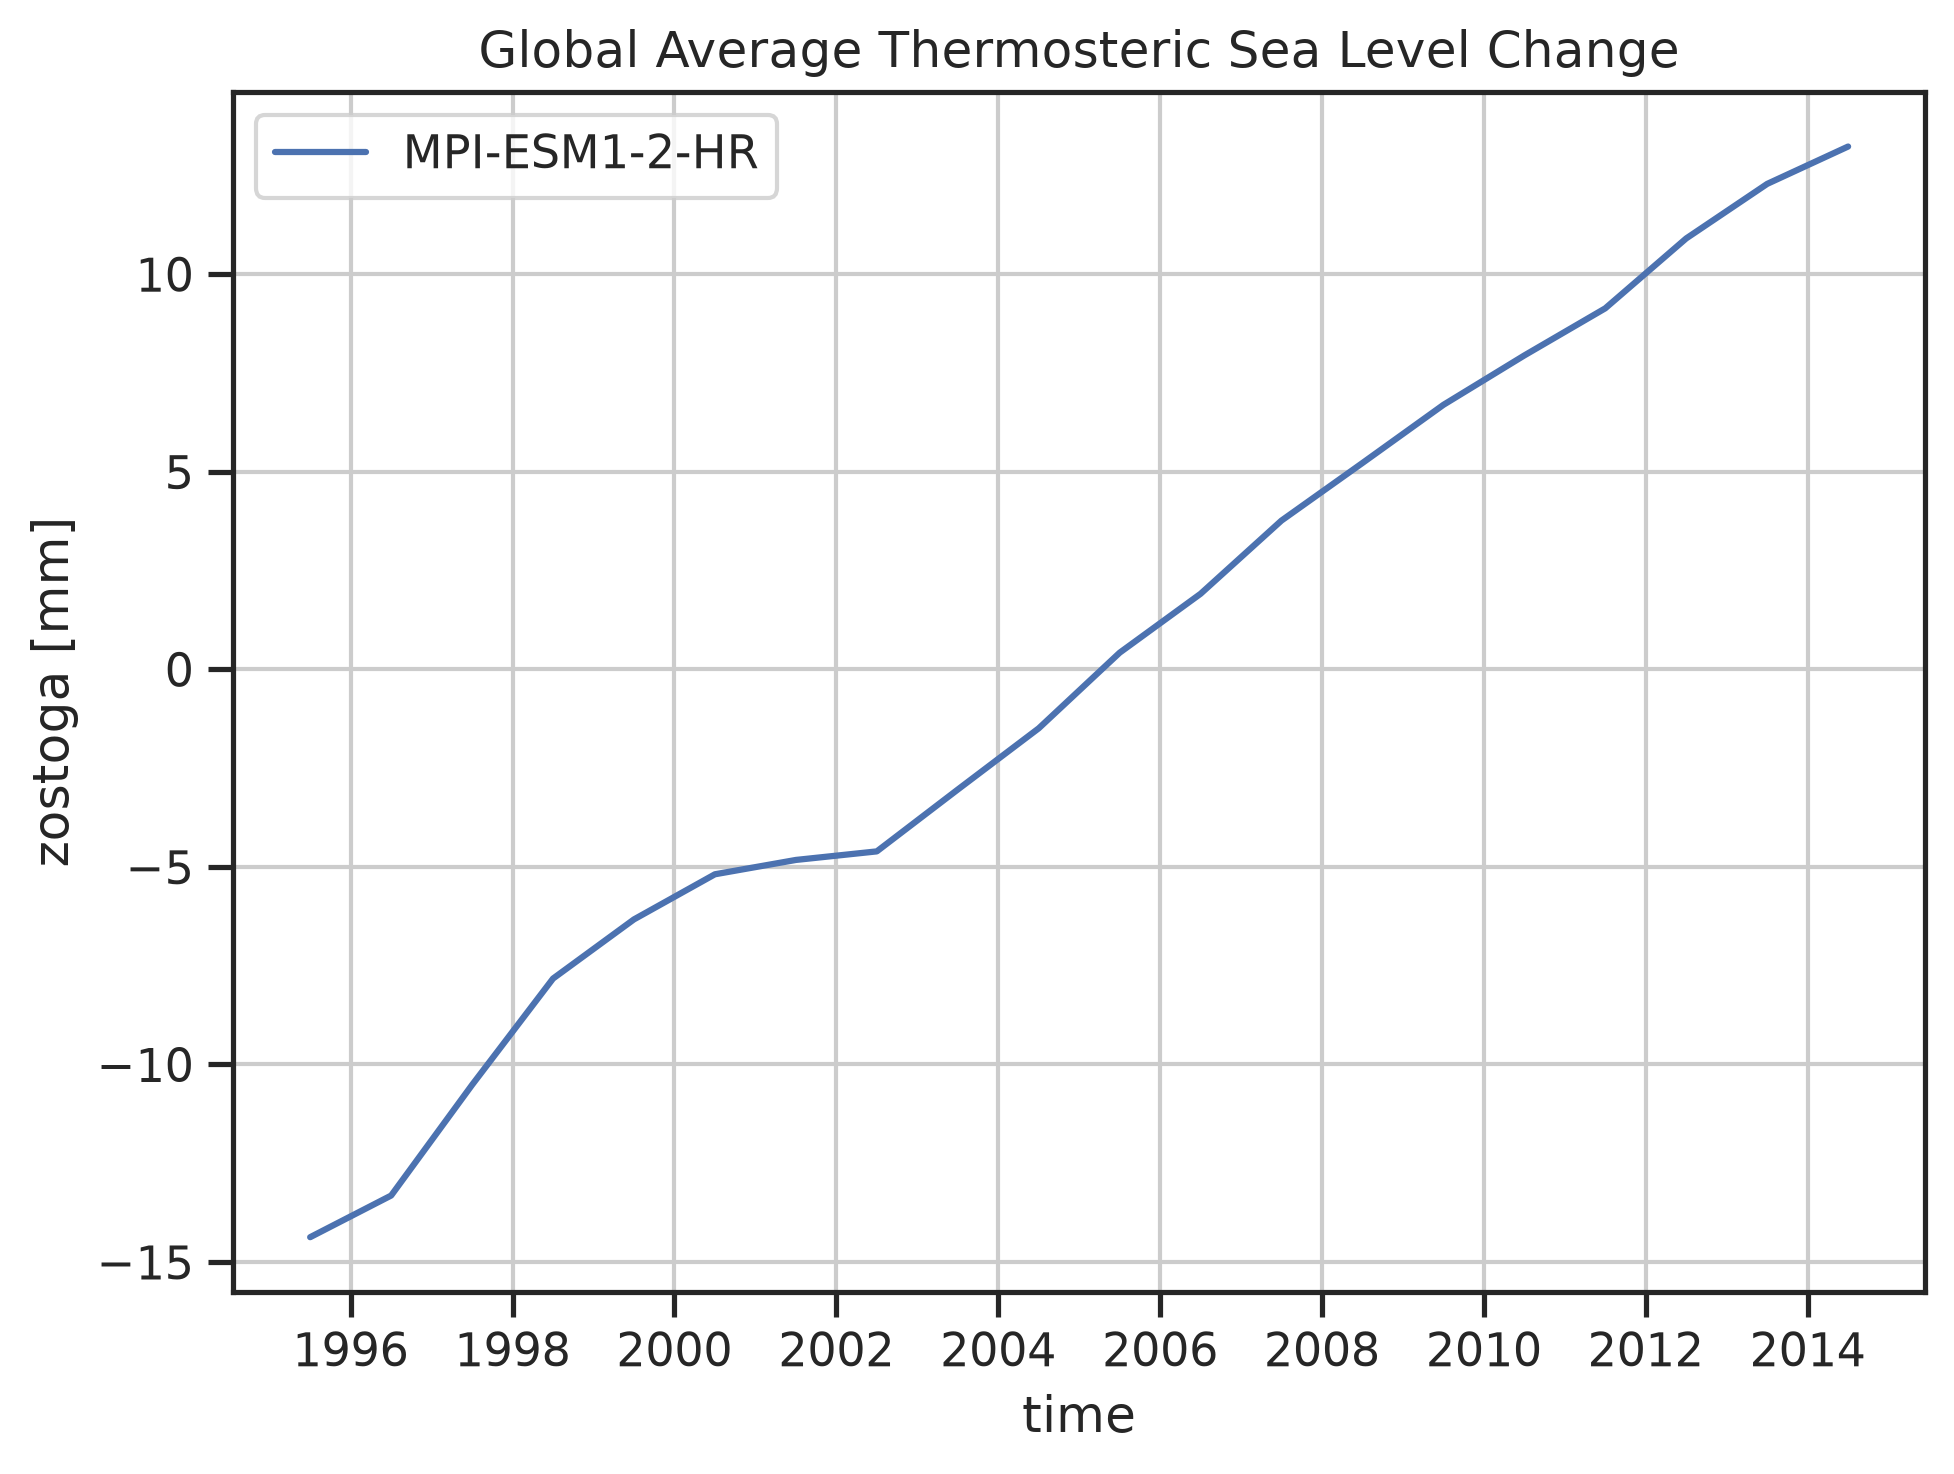
Timeseries_Zostoga
Plot timeseries showing the Global Average Thermosteric Sea Level anomaly compared to the average over the full period.
Timeseries Zostoga: Thermosteric Sealevel Mean
Data files
Timeseries Zostoga: Zostoga
Data files
-
/home/b/b309141/scratch/esmvaltool_output/recipe_impacts_timeseries_20260916_123934/preproc/timeseries_zostoga/zostoga/CMIP6_MPI-ESM1-2-HR_Omon_historical_r1i1p1f1_zostoga_gn_19950101-20141231.nc |
download |
references |
extra data citation |
provenance
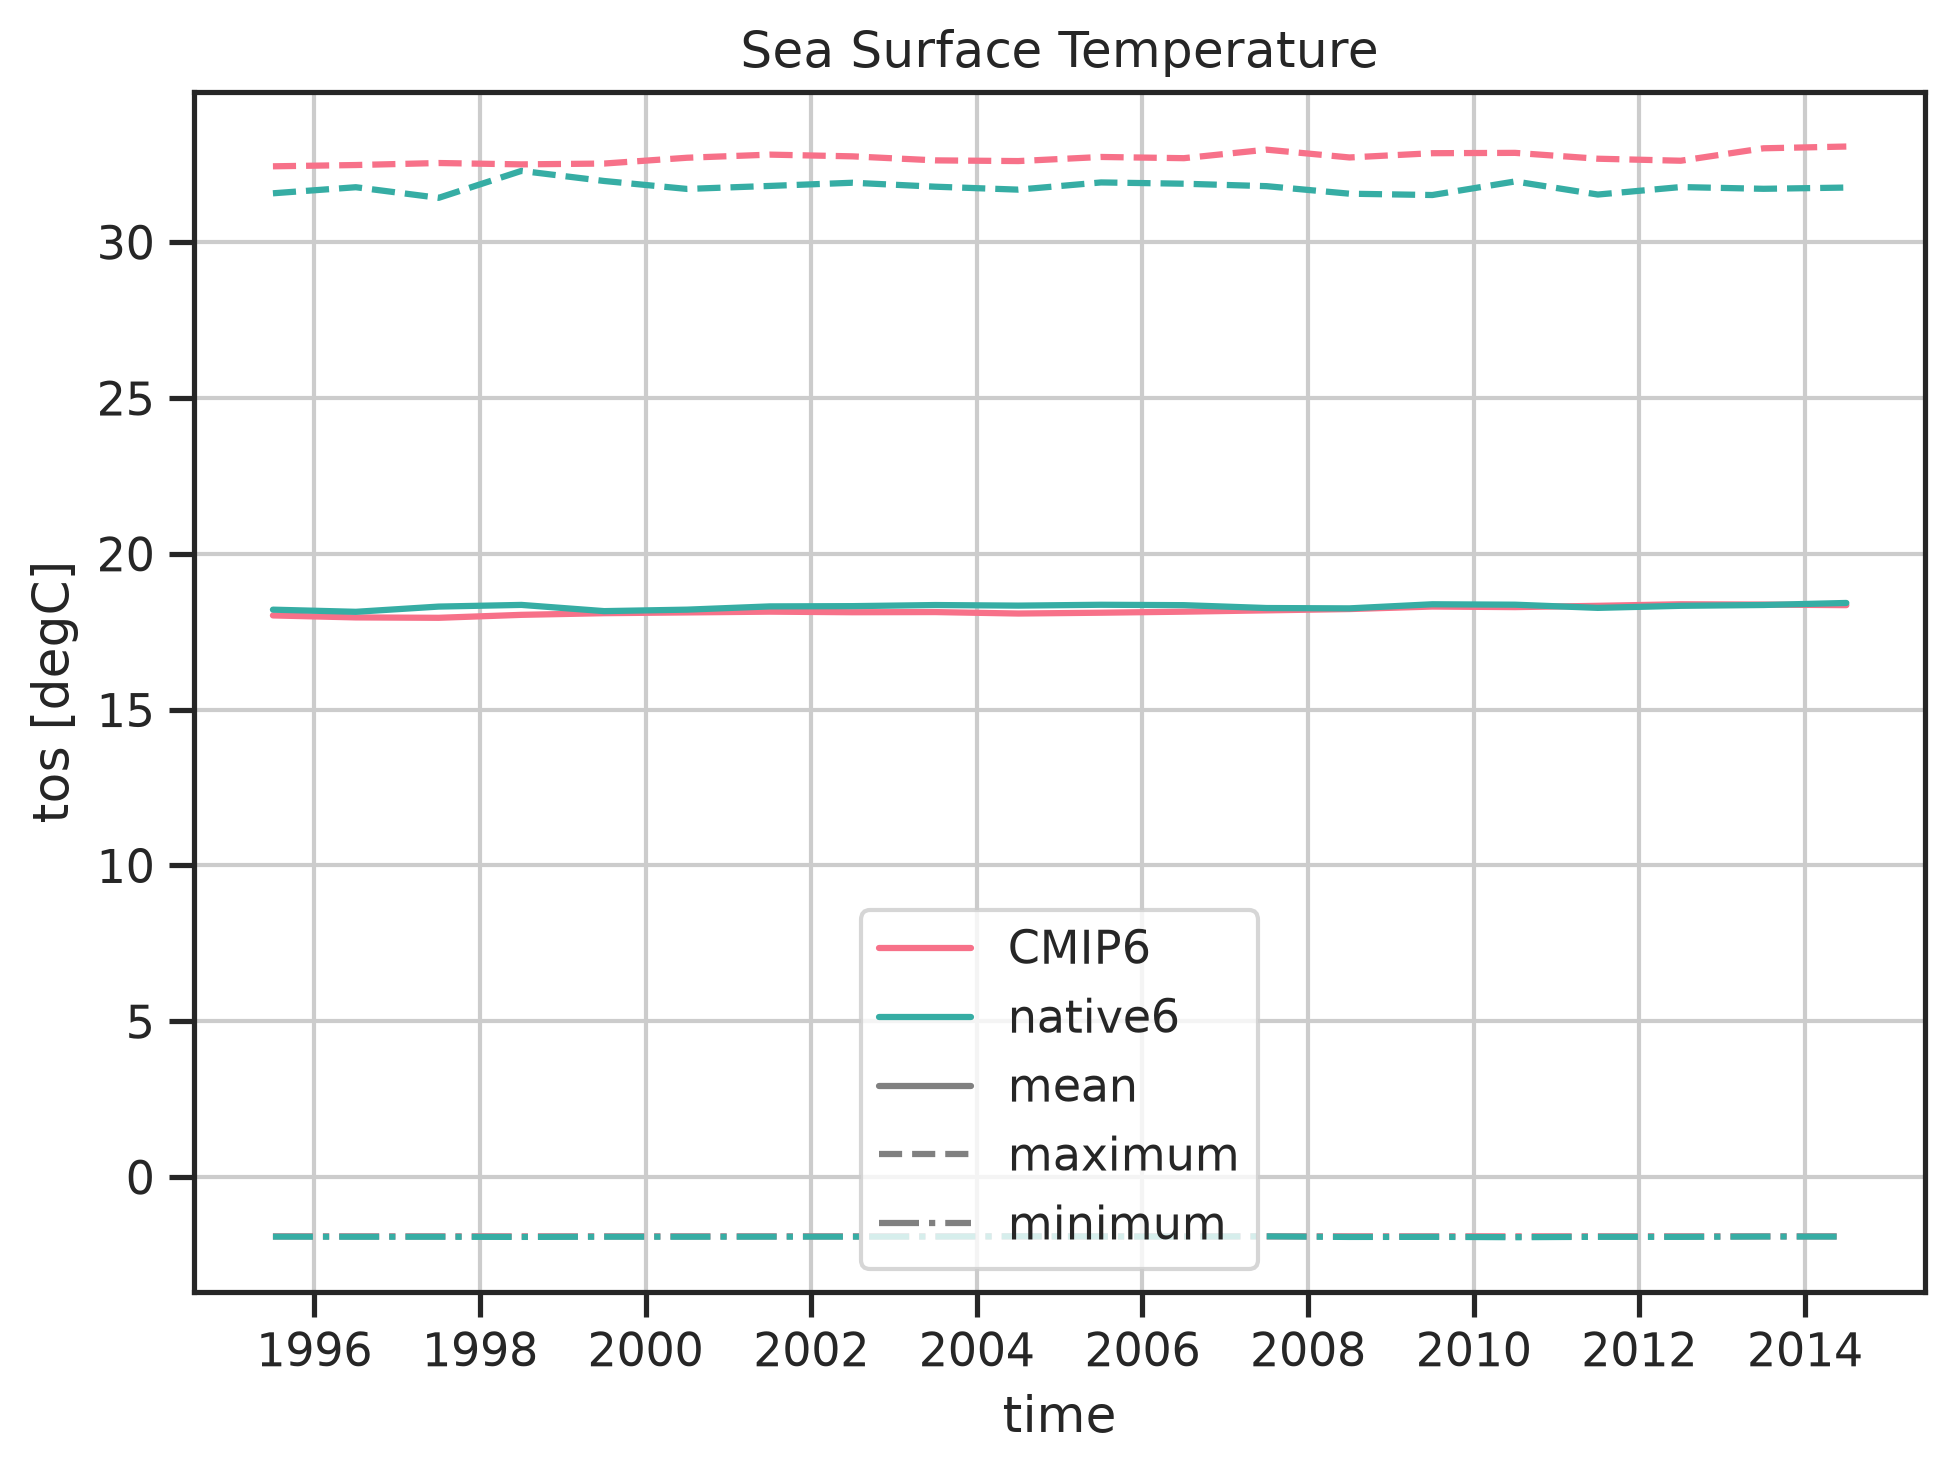
Timeseries_Sst
Plot timeseries showing the sea surface temperature.
Timeseries Sst: Plot
Data files
Timeseries Sst: Tos
Data files
-
/home/b/b309141/scratch/esmvaltool_output/recipe_impacts_timeseries_20260916_123934/preproc/timeseries_sst/tos/CMIP6_MPI-ESM1-2-HR_Omon_historical_r1i1p1f1_tos_gn_19950101-20141231.nc |
download |
references |
extra data citation |
provenance
-
/home/b/b309141/scratch/esmvaltool_output/recipe_impacts_timeseries_20260916_123934/preproc/timeseries_sst/tos/native6_ORAS5_reanaly_CONS-v0-1_Omon_tos_19950101-20141231.nc |
download |
references |
extra data citation |
provenance
Timeseries Sst: Tos Max
Data files
-
/home/b/b309141/scratch/esmvaltool_output/recipe_impacts_timeseries_20260916_123934/preproc/timeseries_sst/tos_max/CMIP6_MPI-ESM1-2-HR_Omon_historical_r1i1p1f1_tos_gn_19950101-20141231.nc |
download |
references |
extra data citation |
provenance
-
/home/b/b309141/scratch/esmvaltool_output/recipe_impacts_timeseries_20260916_123934/preproc/timeseries_sst/tos_max/native6_ORAS5_reanaly_CONS-v0-1_Omon_tos_19950101-20141231.nc |
download |
references |
extra data citation |
provenance
Timeseries Sst: Tos Min
Data files
-
/home/b/b309141/scratch/esmvaltool_output/recipe_impacts_timeseries_20260916_123934/preproc/timeseries_sst/tos_min/CMIP6_MPI-ESM1-2-HR_Omon_historical_r1i1p1f1_tos_gn_19950101-20141231.nc |
download |
references |
extra data citation |
provenance
-
/home/b/b309141/scratch/esmvaltool_output/recipe_impacts_timeseries_20260916_123934/preproc/timeseries_sst/tos_min/native6_ORAS5_reanaly_CONS-v0-1_Omon_tos_19950101-20141231.nc |
download |
references |
extra data citation |
provenance
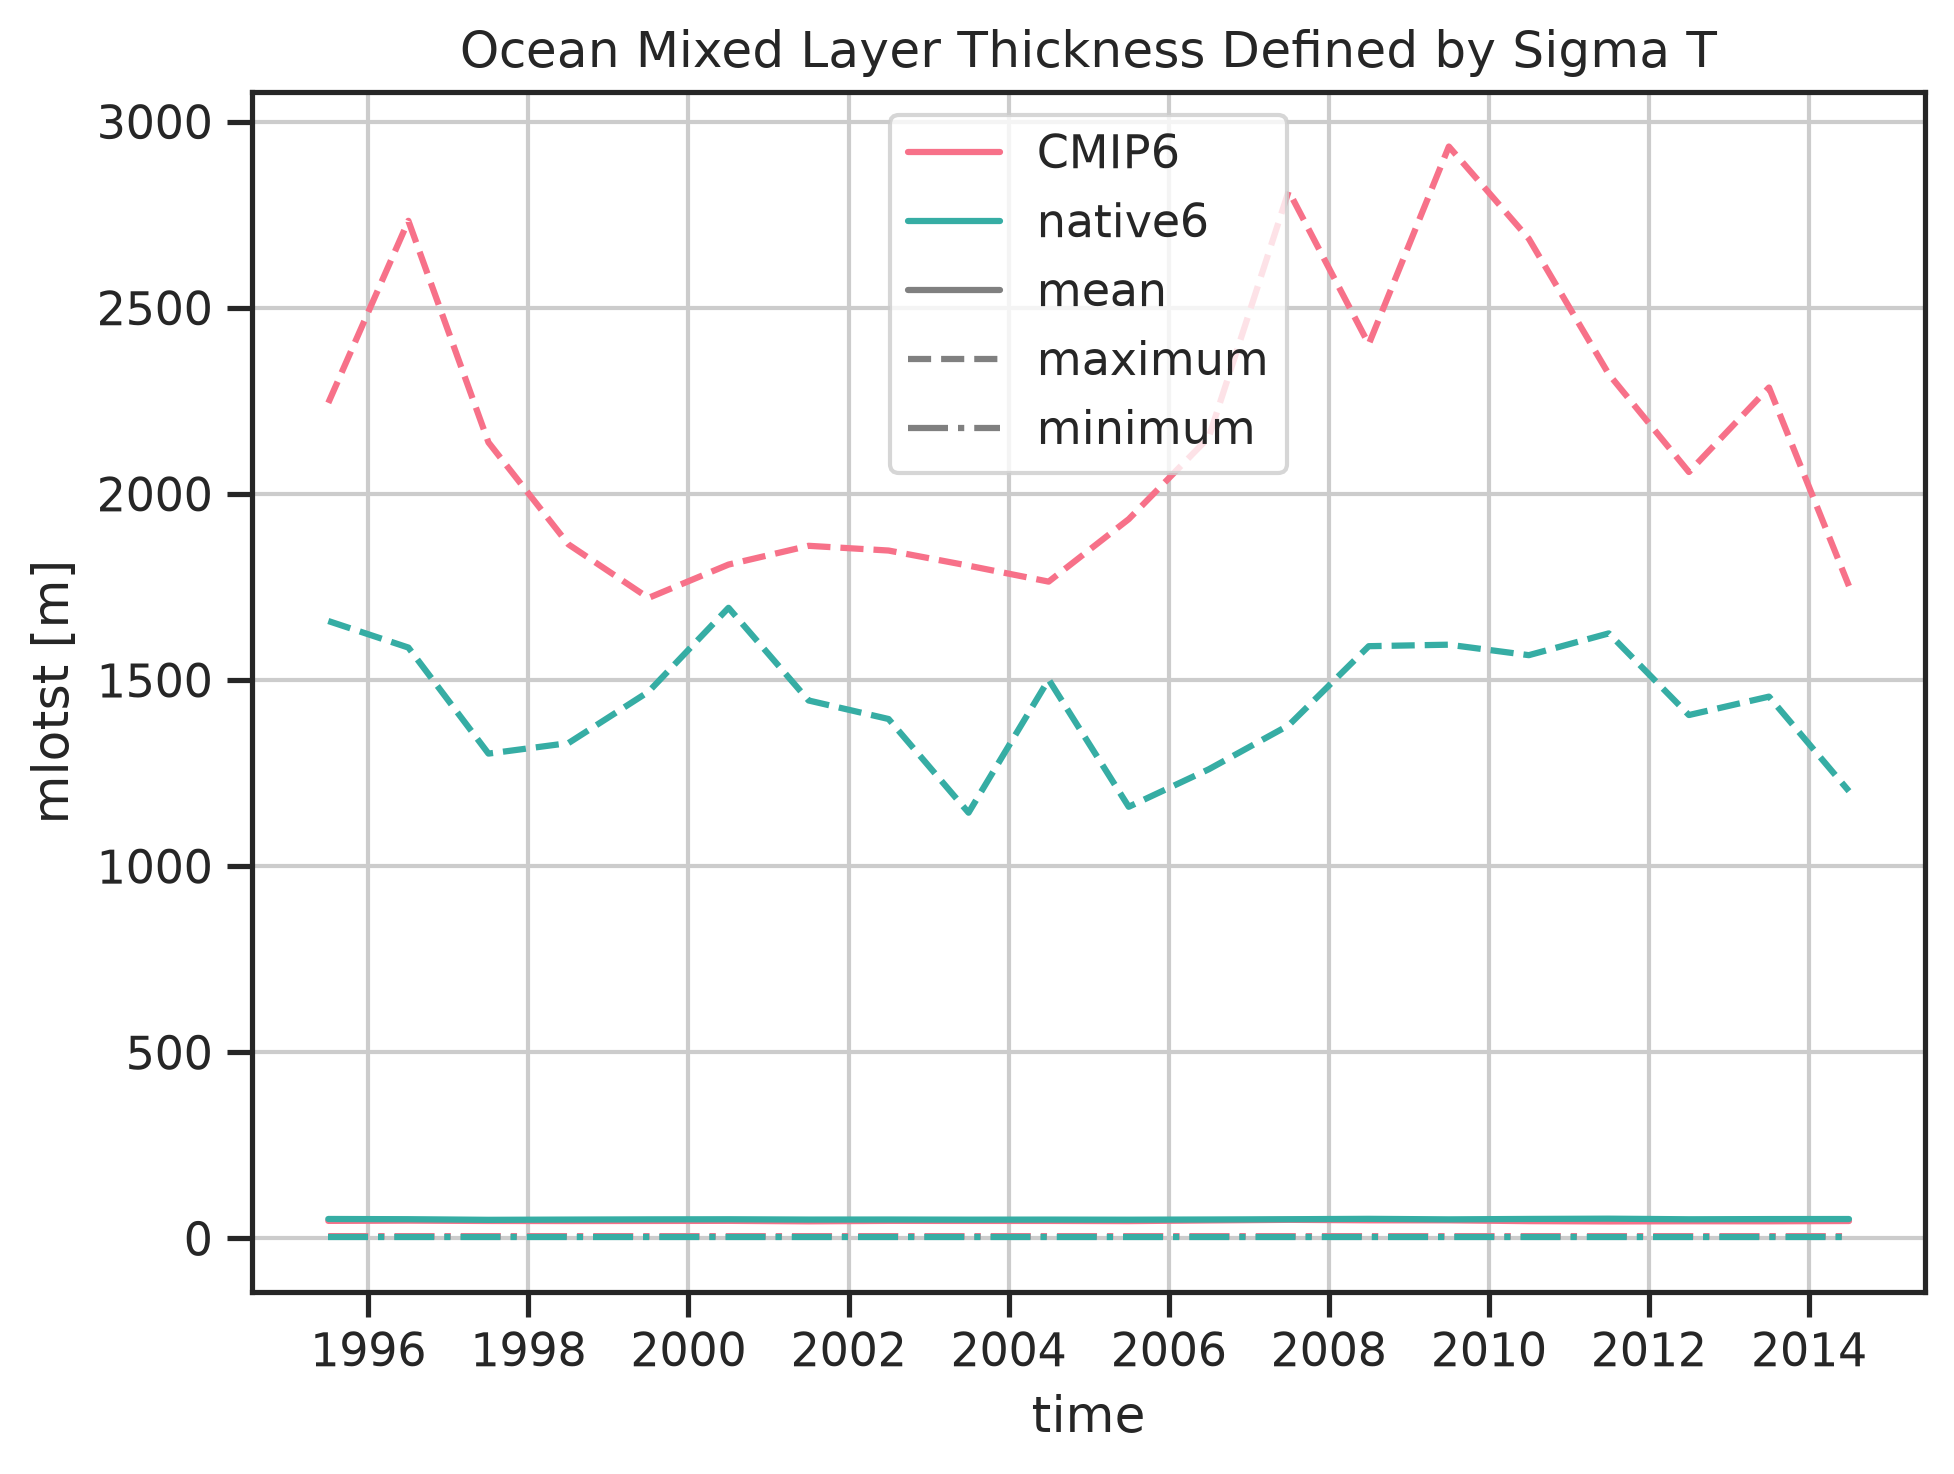
Timeseries_Mld
Plot timeseries showing the mixed layer depth.
Timeseries Mld: Plot
Data files
Timeseries Mld: Mlotst
Data files
-
/home/b/b309141/scratch/esmvaltool_output/recipe_impacts_timeseries_20260916_123934/preproc/timeseries_mld/mlotst/CMIP6_MPI-ESM1-2-HR_Omon_historical_r1i1p1f1_mlotst_gn_19950101-20141231.nc |
download |
references |
extra data citation |
provenance
-
/home/b/b309141/scratch/esmvaltool_output/recipe_impacts_timeseries_20260916_123934/preproc/timeseries_mld/mlotst/native6_ORAS5_reanaly_CONS-v0-1_Omon_mlotst_19950101-20141231.nc |
download |
references |
extra data citation |
provenance
Timeseries Mld: Mlotst Max
Data files
-
/home/b/b309141/scratch/esmvaltool_output/recipe_impacts_timeseries_20260916_123934/preproc/timeseries_mld/mlotst_max/CMIP6_MPI-ESM1-2-HR_Omon_historical_r1i1p1f1_mlotst_gn_19950101-20141231.nc |
download |
references |
extra data citation |
provenance
-
/home/b/b309141/scratch/esmvaltool_output/recipe_impacts_timeseries_20260916_123934/preproc/timeseries_mld/mlotst_max/native6_ORAS5_reanaly_CONS-v0-1_Omon_mlotst_19950101-20141231.nc |
download |
references |
extra data citation |
provenance
Timeseries Mld: Mlotst Min
Data files
-
/home/b/b309141/scratch/esmvaltool_output/recipe_impacts_timeseries_20260916_123934/preproc/timeseries_mld/mlotst_min/CMIP6_MPI-ESM1-2-HR_Omon_historical_r1i1p1f1_mlotst_gn_19950101-20141231.nc |
download |
references |
extra data citation |
provenance
-
/home/b/b309141/scratch/esmvaltool_output/recipe_impacts_timeseries_20260916_123934/preproc/timeseries_mld/mlotst_min/native6_ORAS5_reanaly_CONS-v0-1_Omon_mlotst_19950101-20141231.nc |
download |
references |
extra data citation |
provenance
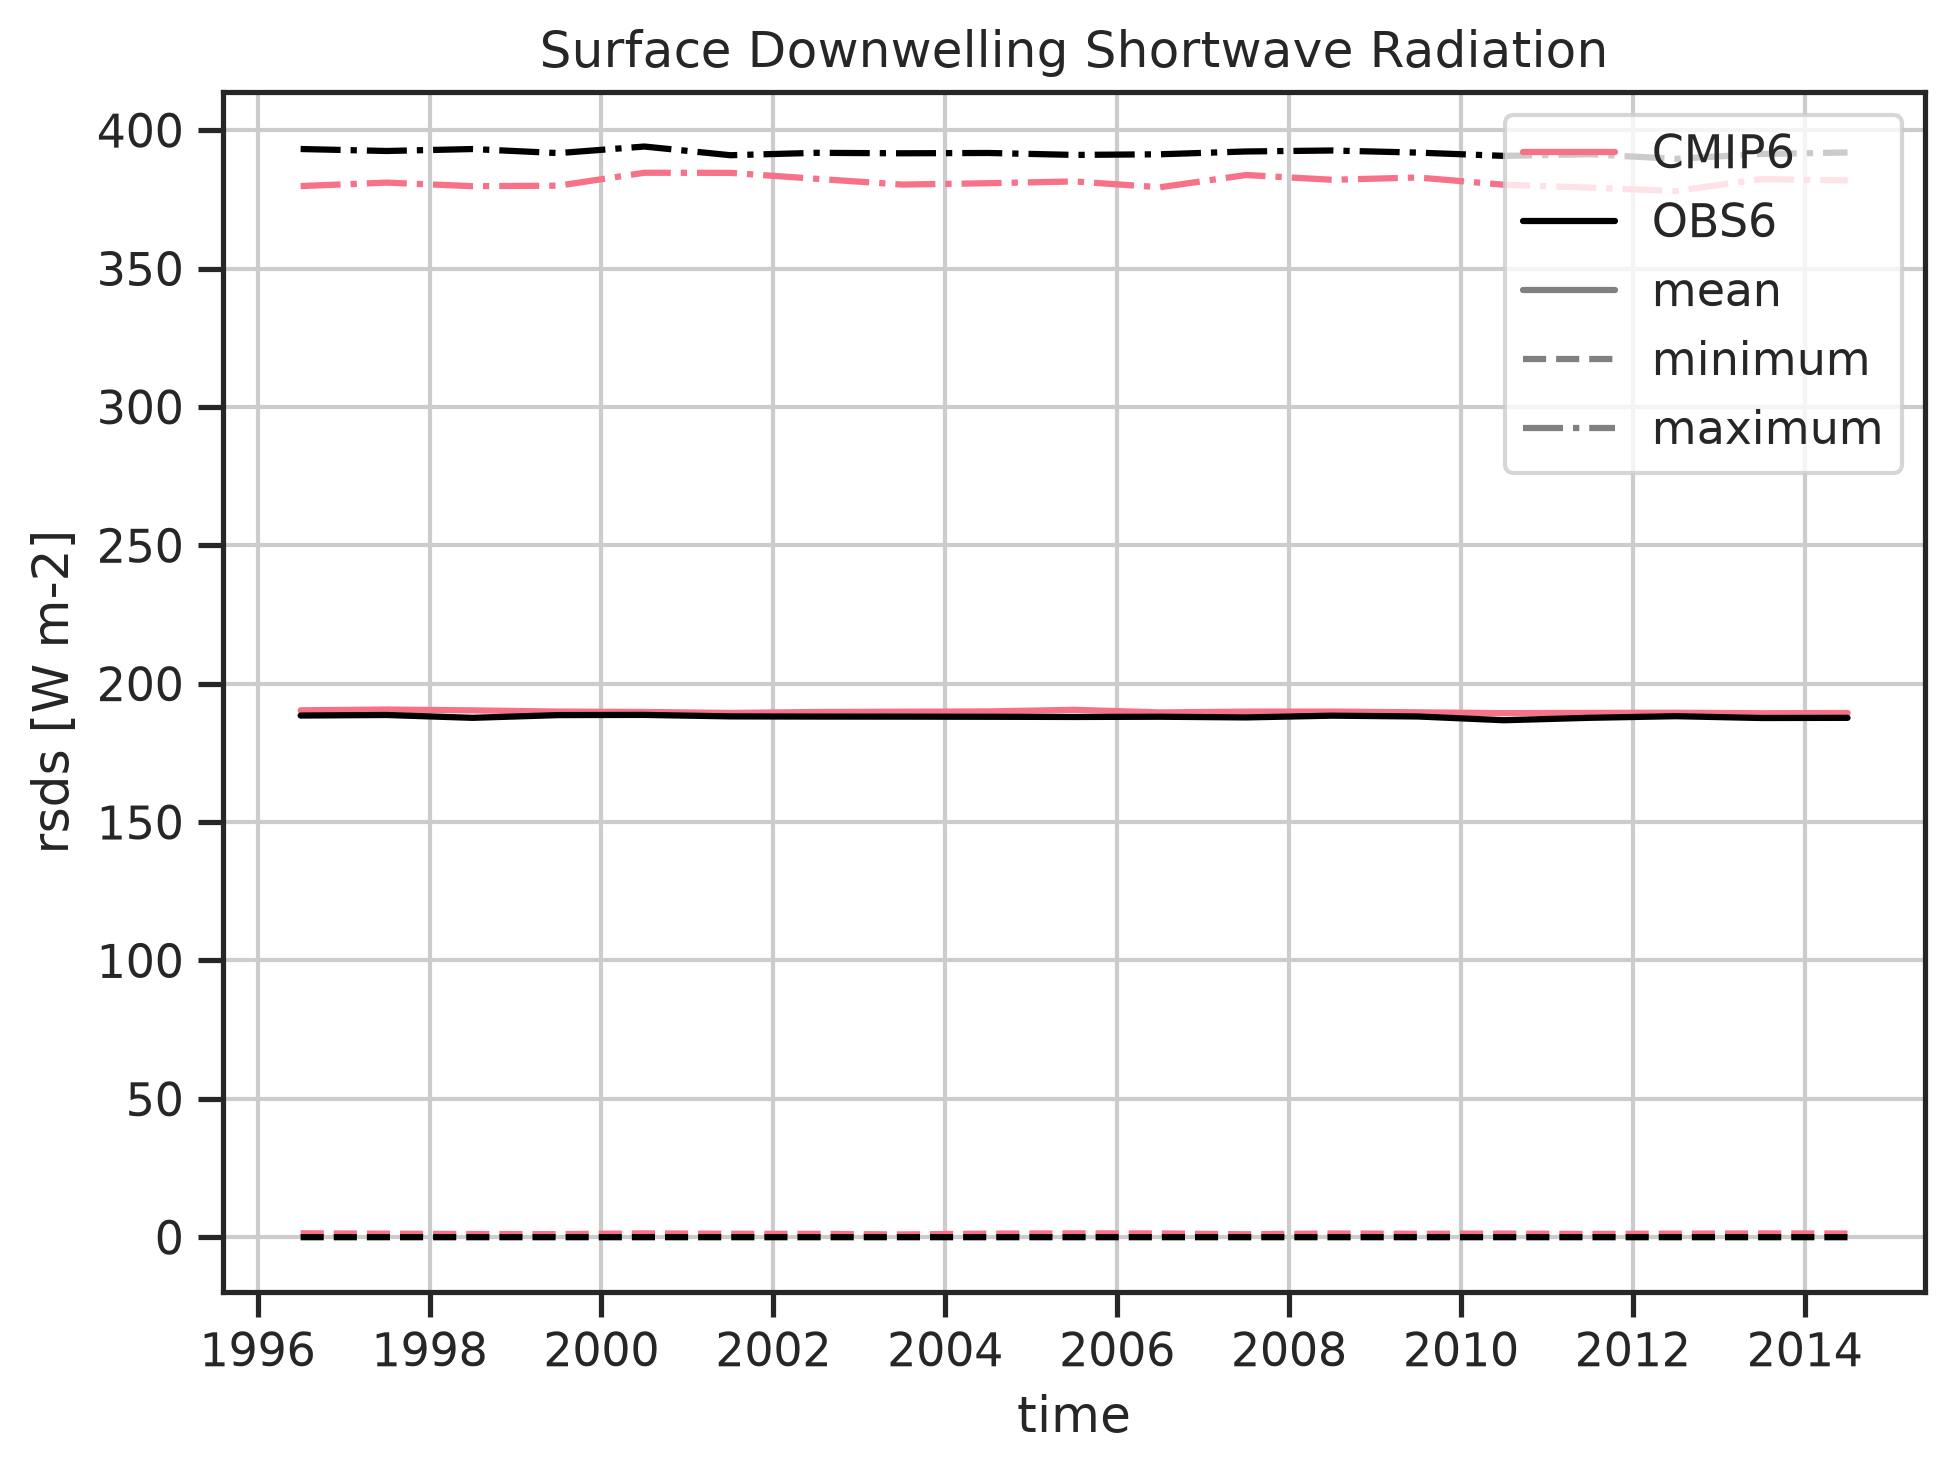
Timeseries_Rsds
Plot timeseries showing the shortwave downward radiation at the surface.
Timeseries Rsds: Plot
Data files
Timeseries Rsds: Rsds
Data files
Timeseries Rsds: Rsds Min
Data files
-
/home/b/b309141/scratch/esmvaltool_output/recipe_impacts_timeseries_20260916_123934/preproc/timeseries_rsds/rsds_min/CMIP6_MPI-ESM1-2-HR_Amon_historical_r1i1p1f1_rsds_gn_19960101-20141231.nc |
download |
references |
extra data citation |
provenance
-
/home/b/b309141/scratch/esmvaltool_output/recipe_impacts_timeseries_20260916_123934/preproc/timeseries_rsds/rsds_min/OBS6_ERA5_reanaly_1_day_rsds_19960101-20141231.nc |
download |
references |
extra data citation |
provenance
Timeseries Rsds: Rsds Max
Data files
-
/home/b/b309141/scratch/esmvaltool_output/recipe_impacts_timeseries_20260916_123934/preproc/timeseries_rsds/rsds_max/CMIP6_MPI-ESM1-2-HR_Amon_historical_r1i1p1f1_rsds_gn_19960101-20141231.nc |
download |
references |
extra data citation |
provenance
-
/home/b/b309141/scratch/esmvaltool_output/recipe_impacts_timeseries_20260916_123934/preproc/timeseries_rsds/rsds_max/OBS6_ERA5_reanaly_1_day_rsds_19960101-20141231.nc |
download |
references |
extra data citation |
provenance