ESMValTool logo.

Climatic Impact-Drivers diagnostic.

Diagnostic to plot the temporal mean of selected Climatic Impact- Drivers discussed in Elling et al. 2026 on a global map.

Authors

Maintainers

Projects

References

Plot_Days_Tmax_40

Map showing number of days where the temperature exceeds 40°C.
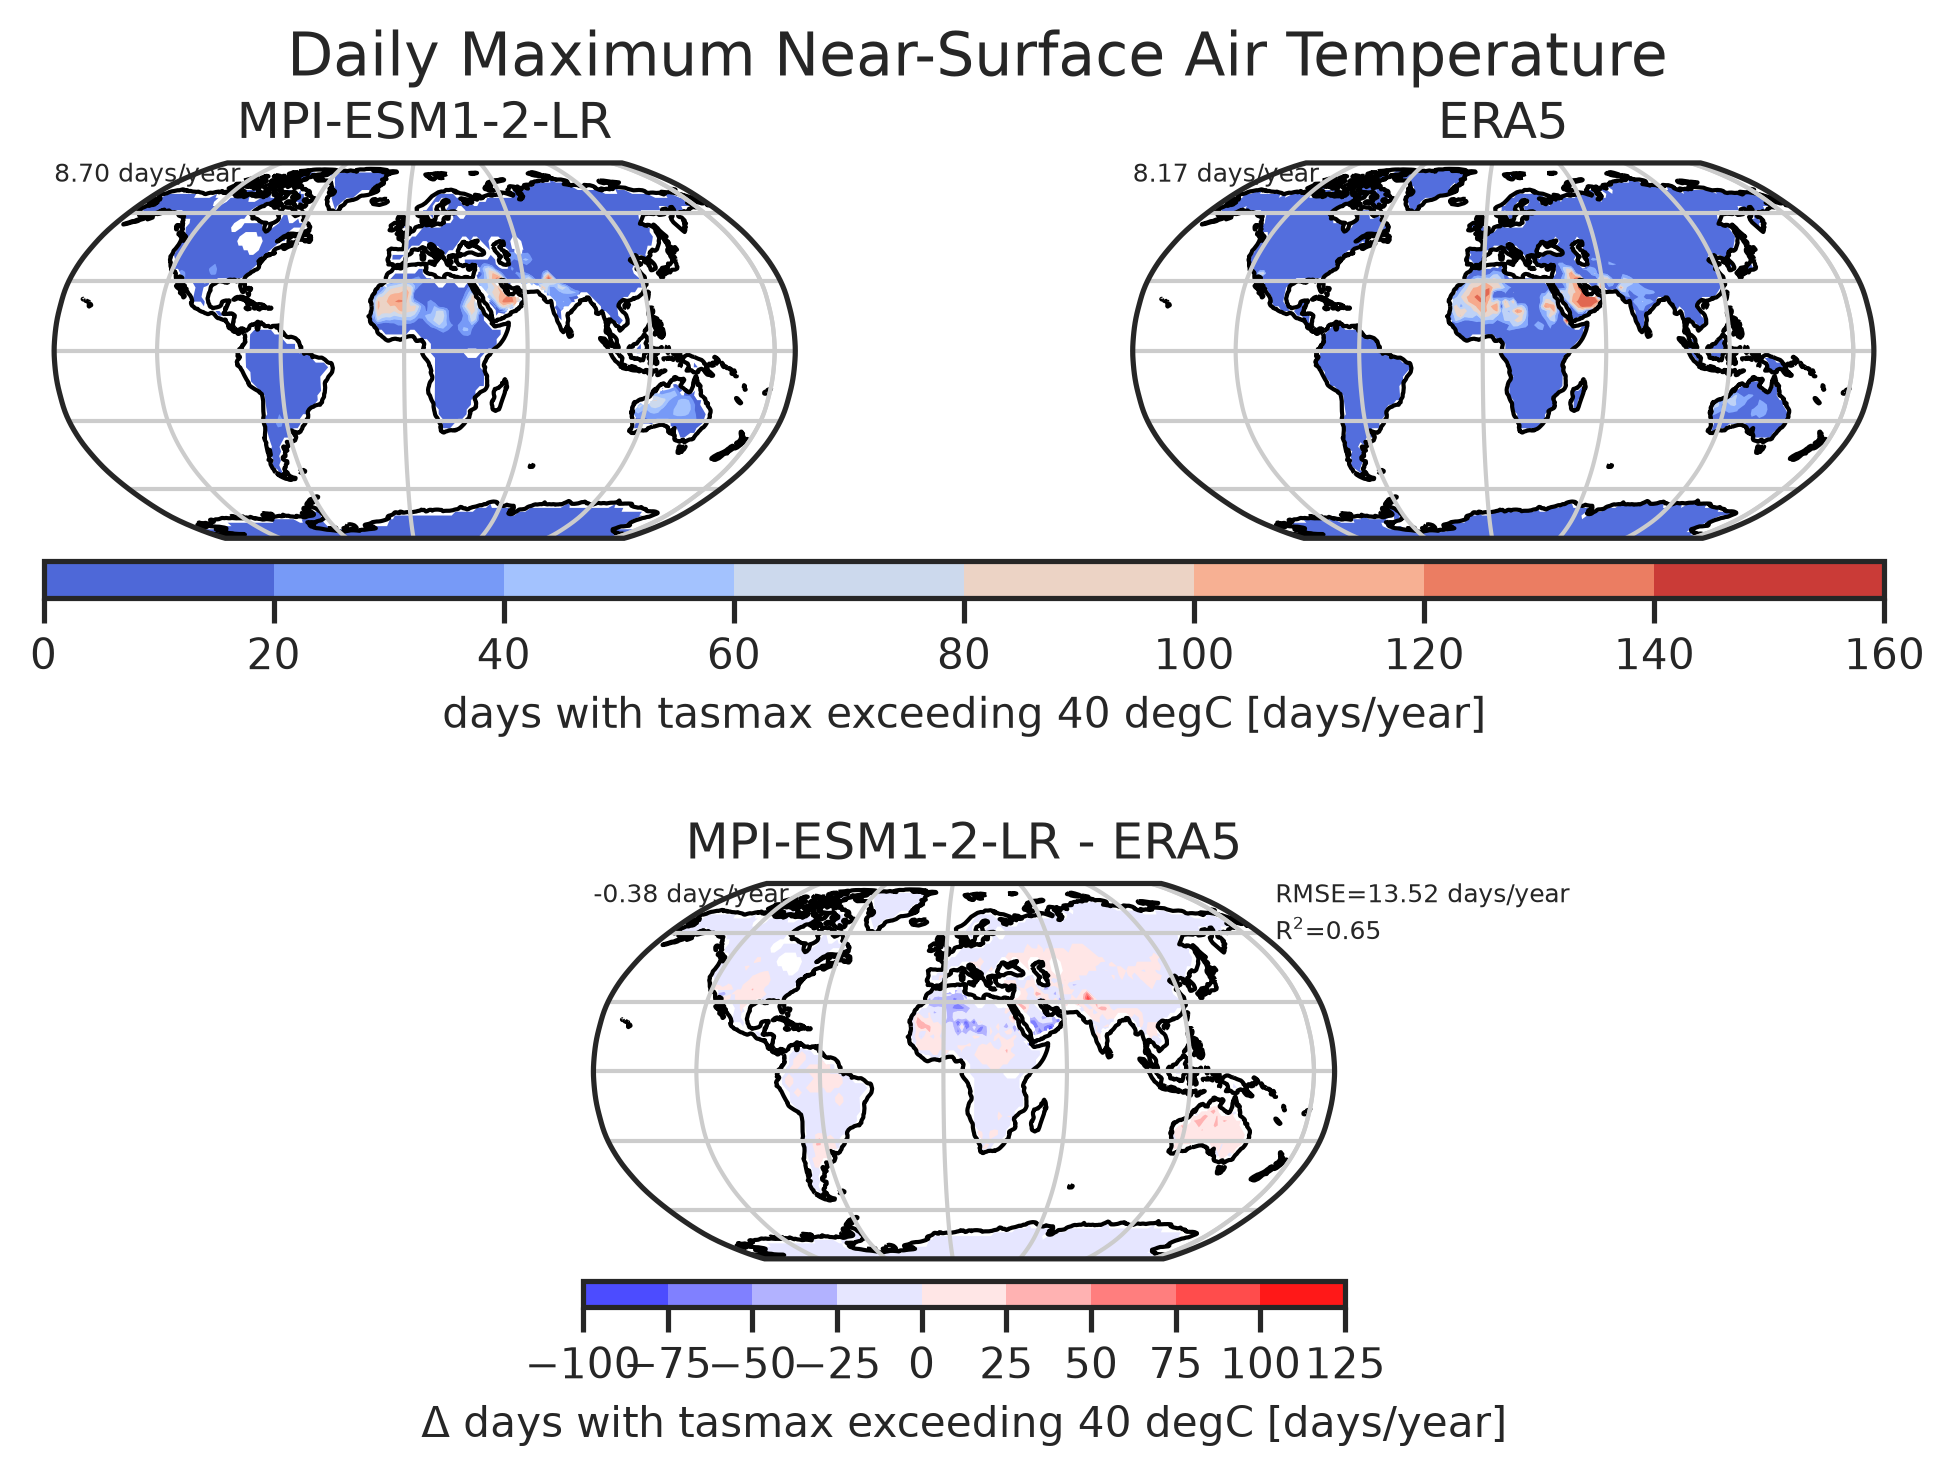
Plot Days Tmax 40: Diag Number Of Exceeding Days

Number of days per year with temperatures exceeding 40°C for MPI-ESM1-2-LR.

download | references | extra data citation | provenance

Data files

Plot Days Tmax 40: Tasmax

Data files

Plot_Days_Tmin_0

Map showing number of days where the temperature drops below 0°C.
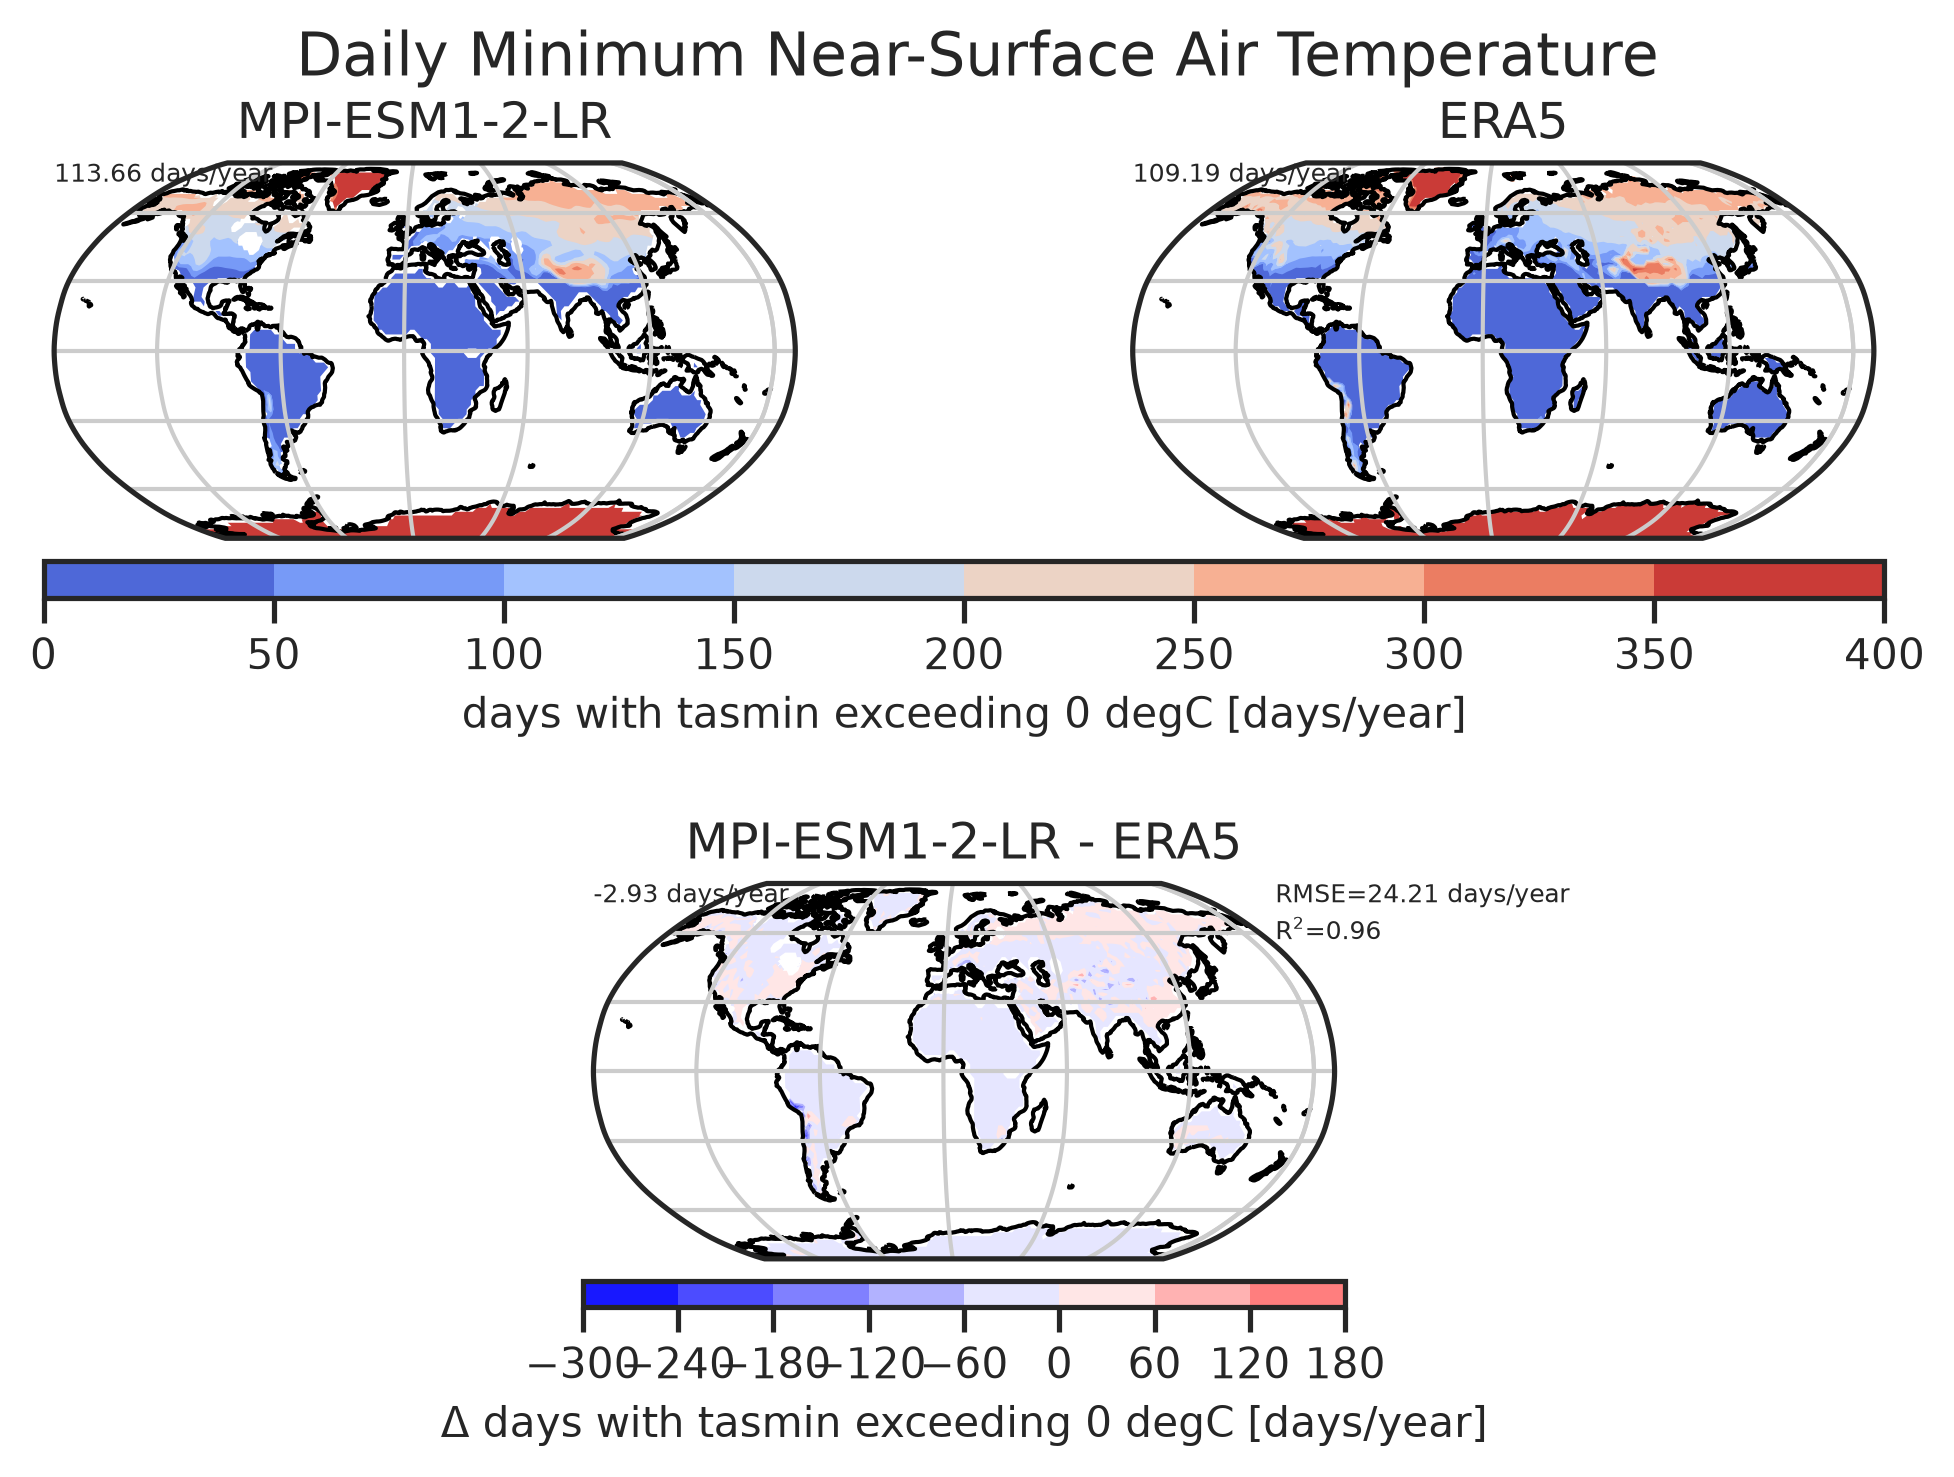
Plot Days Tmin 0: Diag Number Of Exceeding Days

Number of days per year with temperatures drops below 0°C for MPI-ESM1-2-LR.

download | references | extra data citation | provenance

Data files

Plot Days Tmin 0: Tasmin

Data files

Plot_Days_Prmaxthreshold1

Map showing number of days where the rain rate exceeds 1 mm.
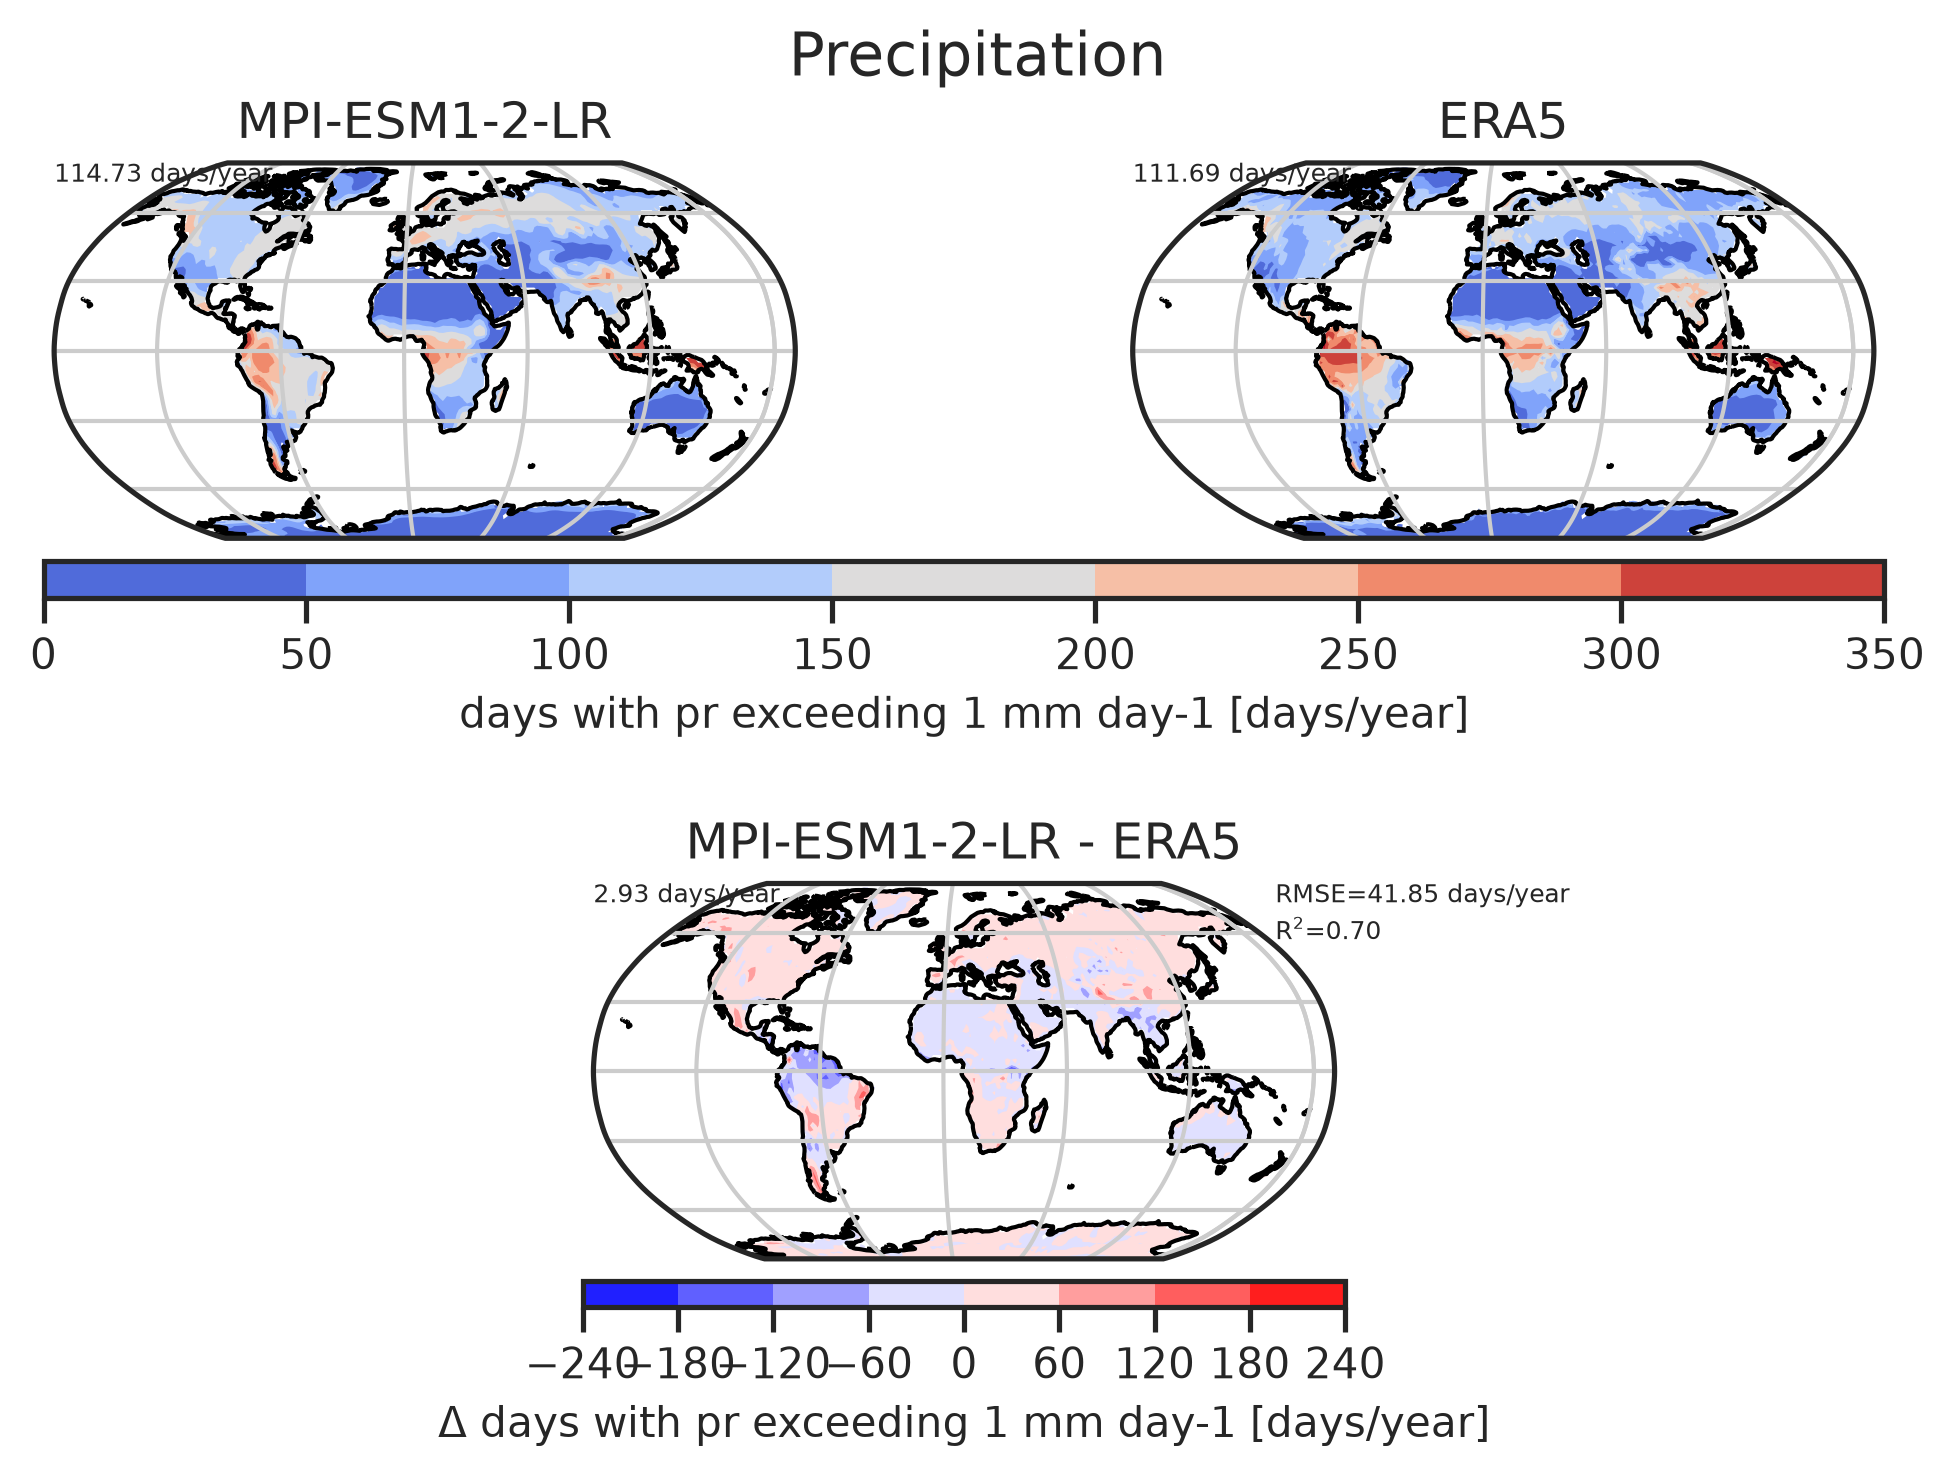
Plot Days Prmaxthreshold1: Diag Number Of Exceeding Days

Number of days per year with rain rate exceeding 1 mm for MPI-ESM1-2-LR.

download | references | extra data citation | provenance

Data files

Plot Days Prmaxthreshold1: Pr

Data files

Plot_Days_Prmaxthreshold10

Map showing number of days where the rain rate exceeds 10 mm.
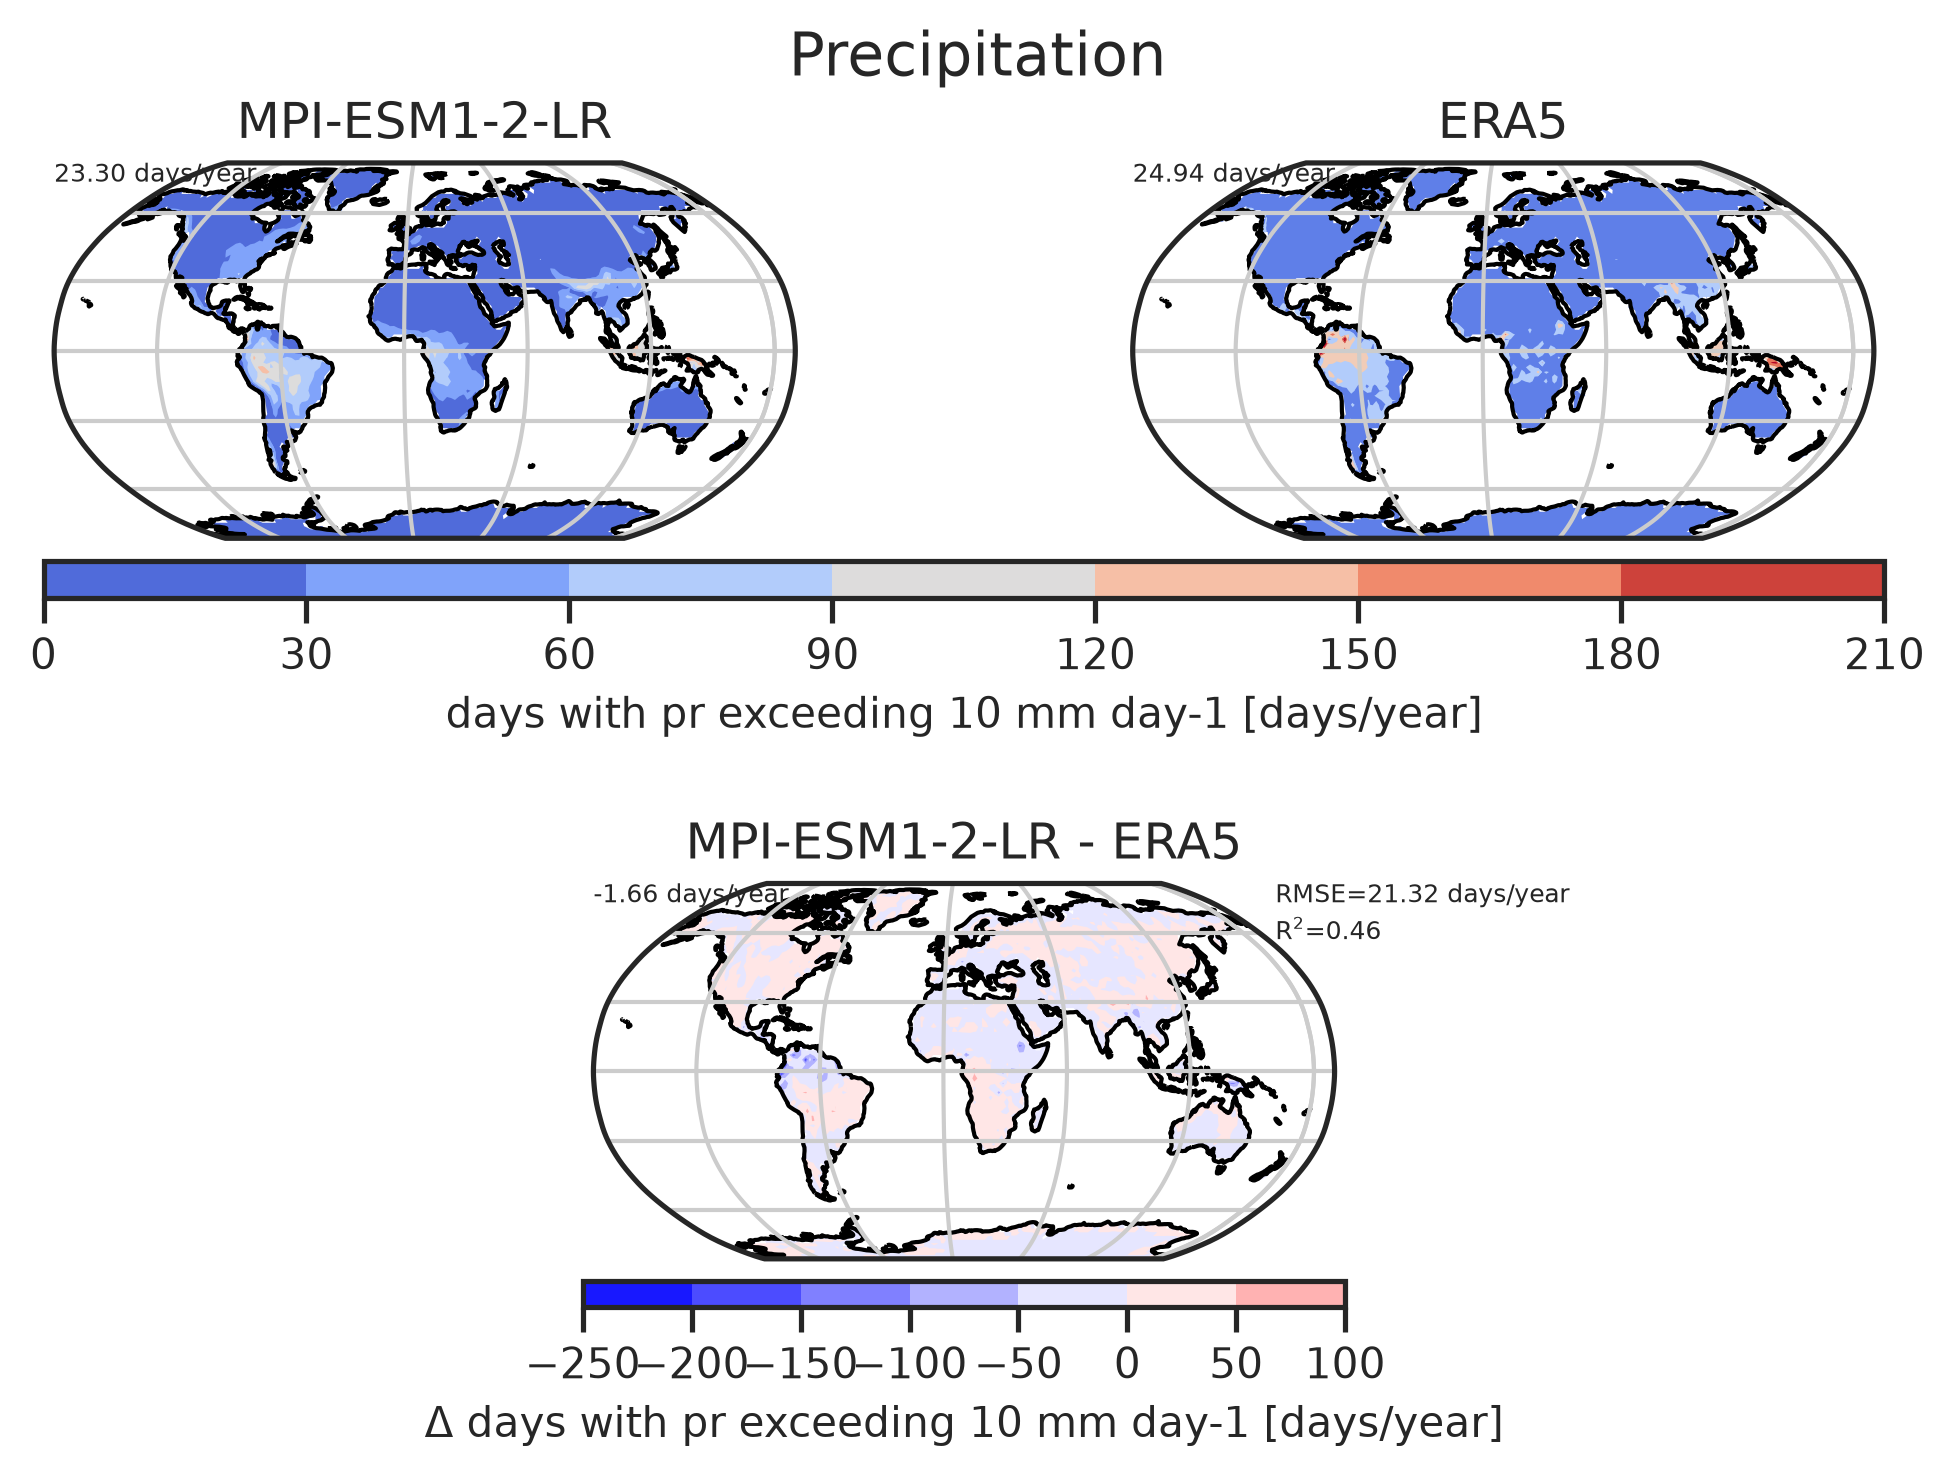
Plot Days Prmaxthreshold10: Diag Number Of Exceeding Days

Number of days per year with rain rate exceeding 10 mm for MPI-ESM1-2-LR.

download | references | extra data citation | provenance

Data files

Plot Days Prmaxthreshold10: Pr

Data files

Plot_Snwe_10

Map showing number of days there is more than 10 cm of snow water equivalent.
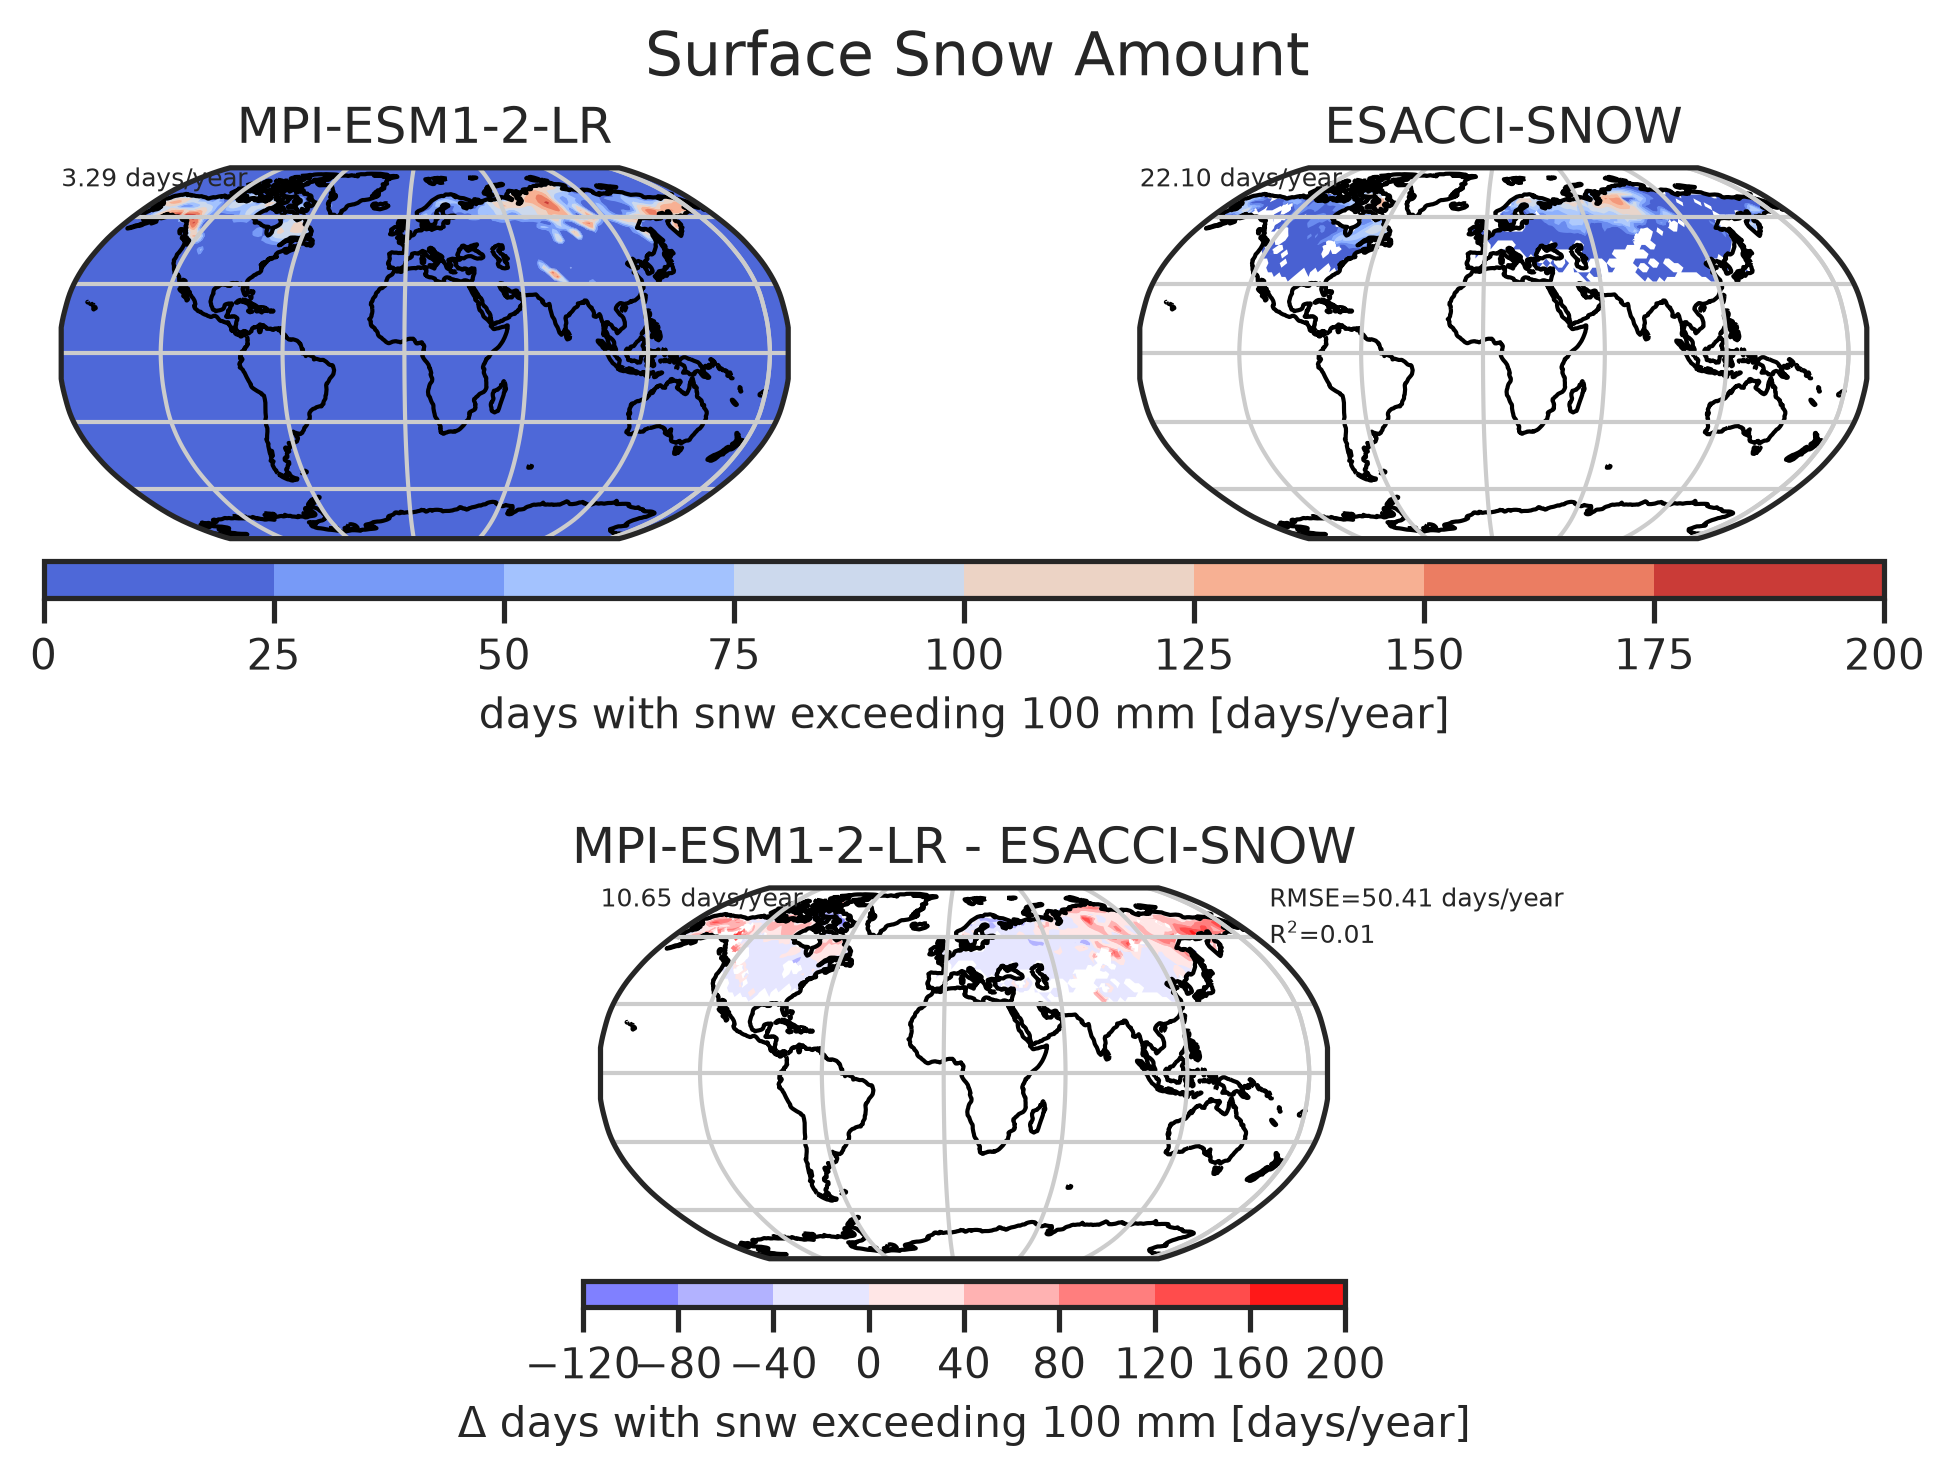
Plot Snwe 10: Diag Number Of Exceeding Days

Number of days per year with more than 10 cm of snow water equivalent surface snow amount for MPI-ESM1-2-LR.

download | references | extra data citation | provenance

Data files

Plot Snwe 10: Snw

Data files

Plot_Sst

Plot maps showing the sea surface temperature.
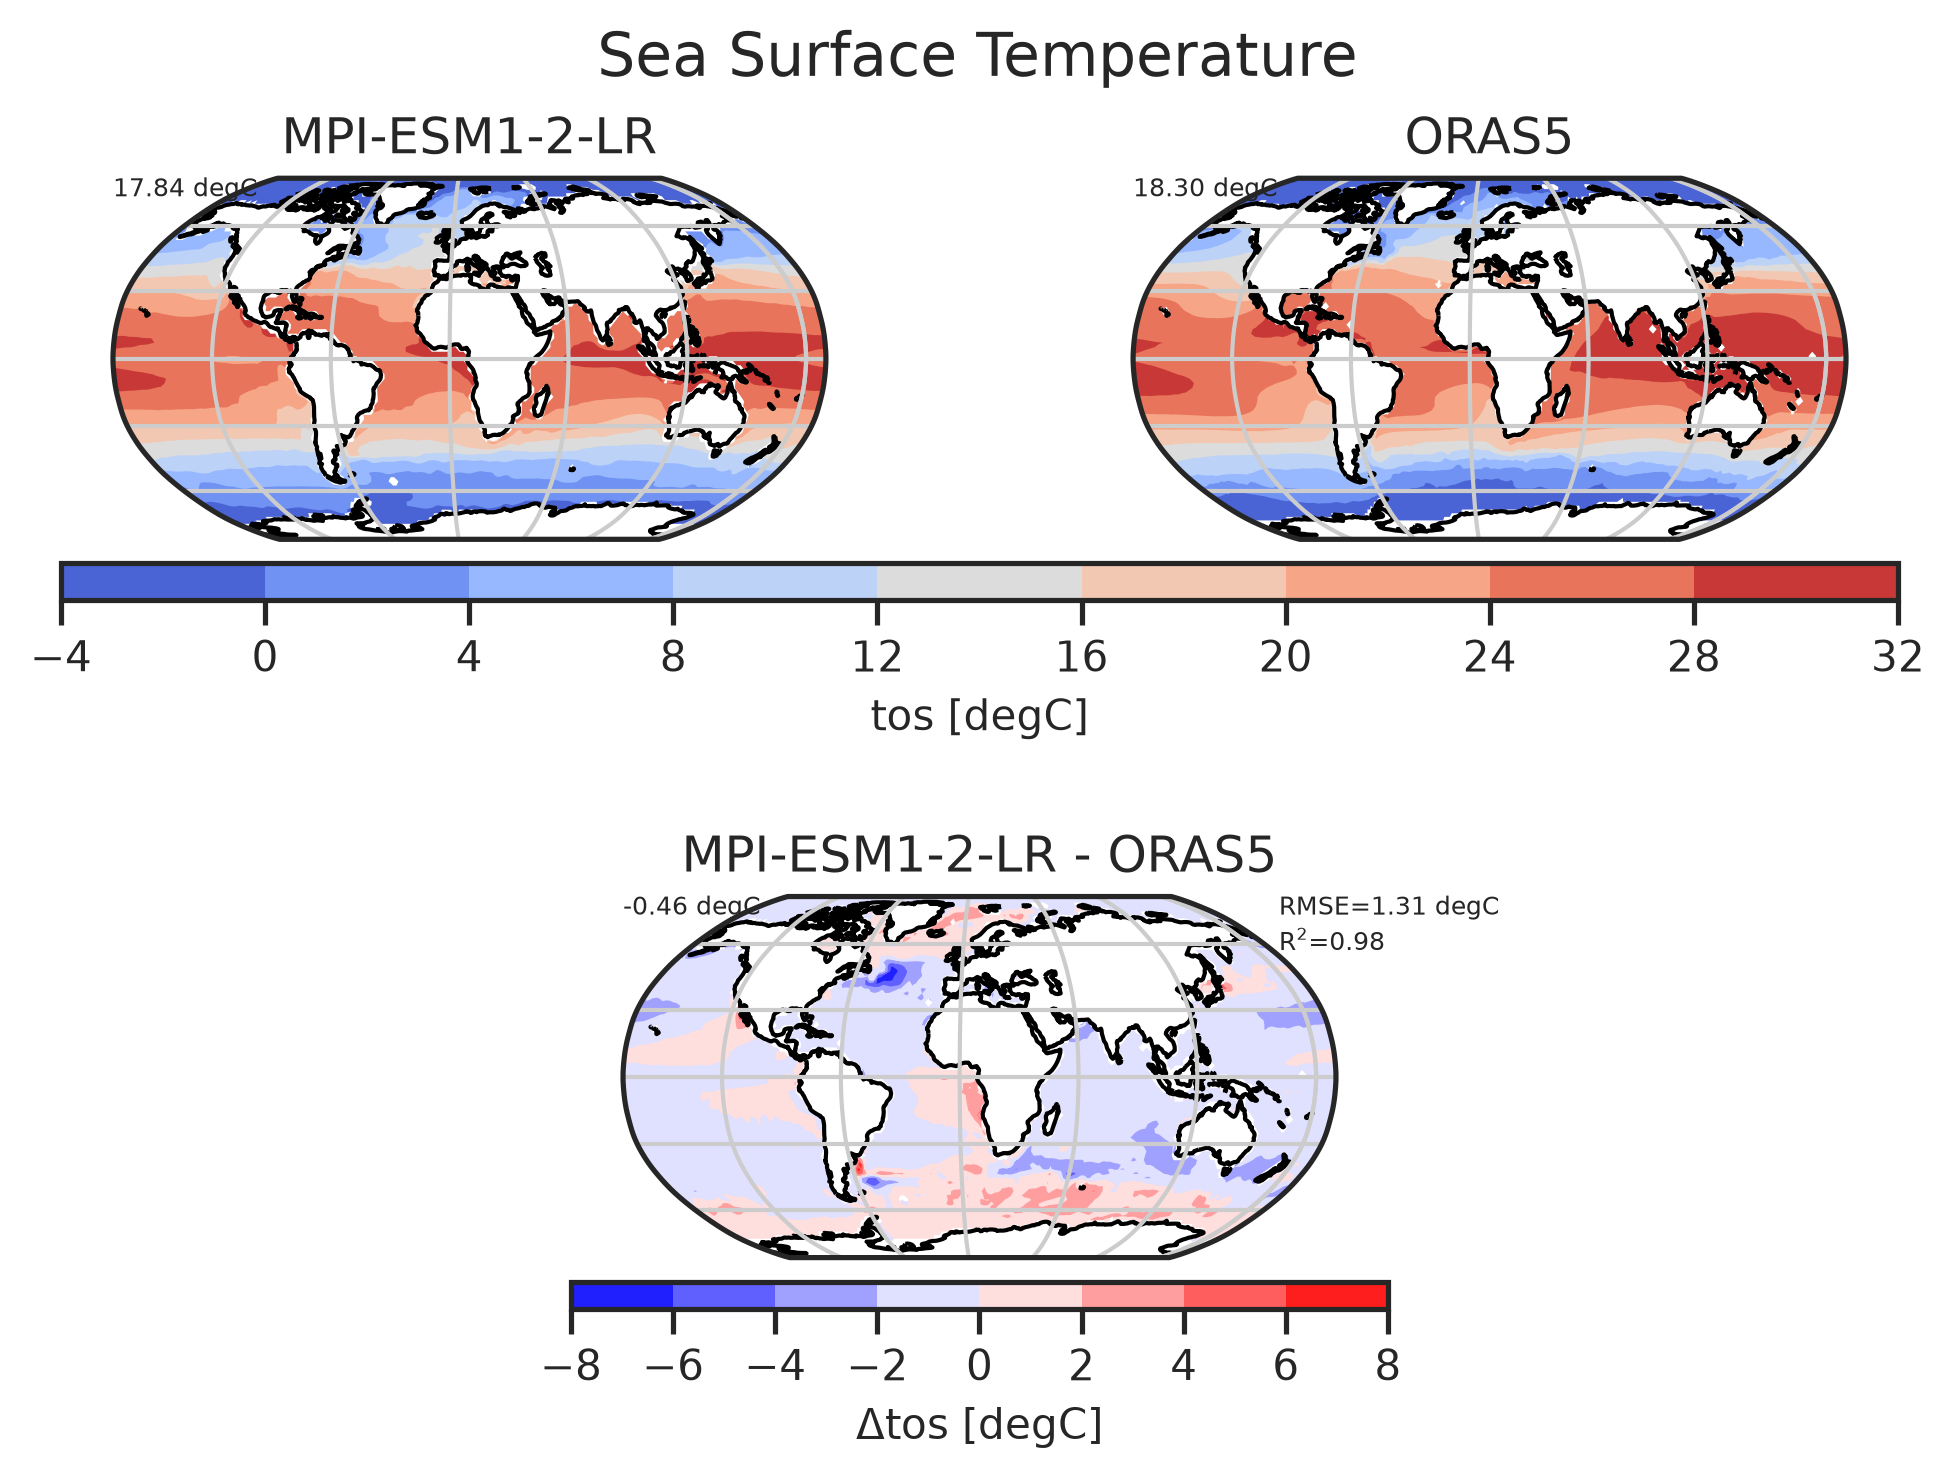
Plot Sst: Plot

Sea surface temperature for MPI-ESM1-2-LR.

download | references | extra data citation | provenance

Data files

Plot Sst: Tos

Data files

Plot_Mld

Plot maps showing the mixed layer depth.
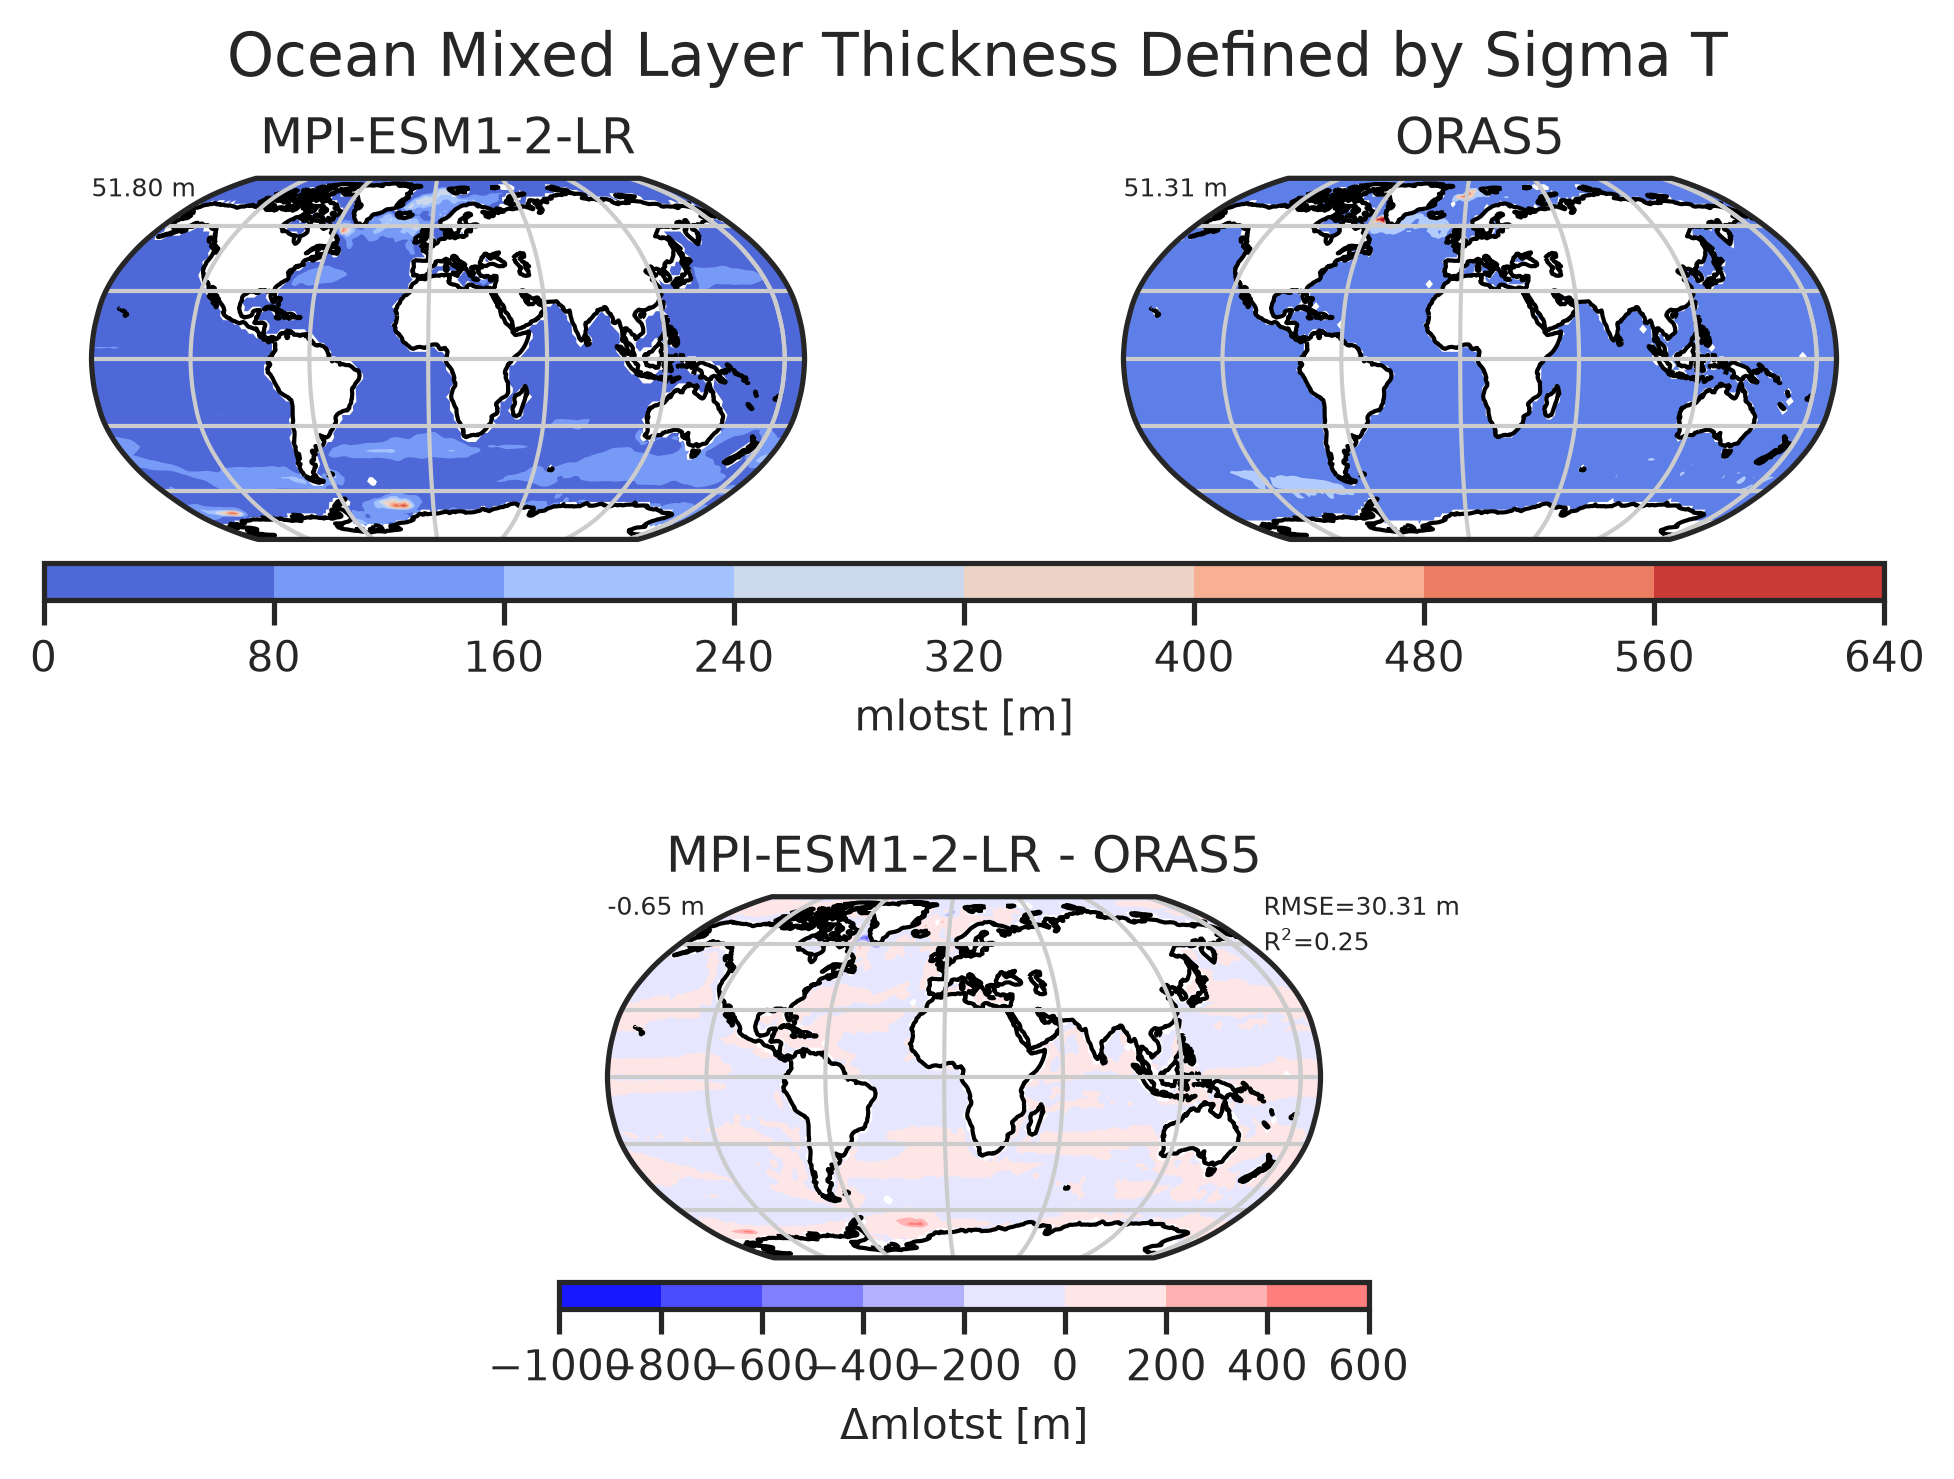
Plot Mld: Plot

Mixed layer depth for MPI-ESM1-2-LR.

download | references | extra data citation | provenance

Data files

Plot Mld: Mlotst

Data files

Plot_Rsds

Plot maps showing the shortwave downward radiation at the surface.
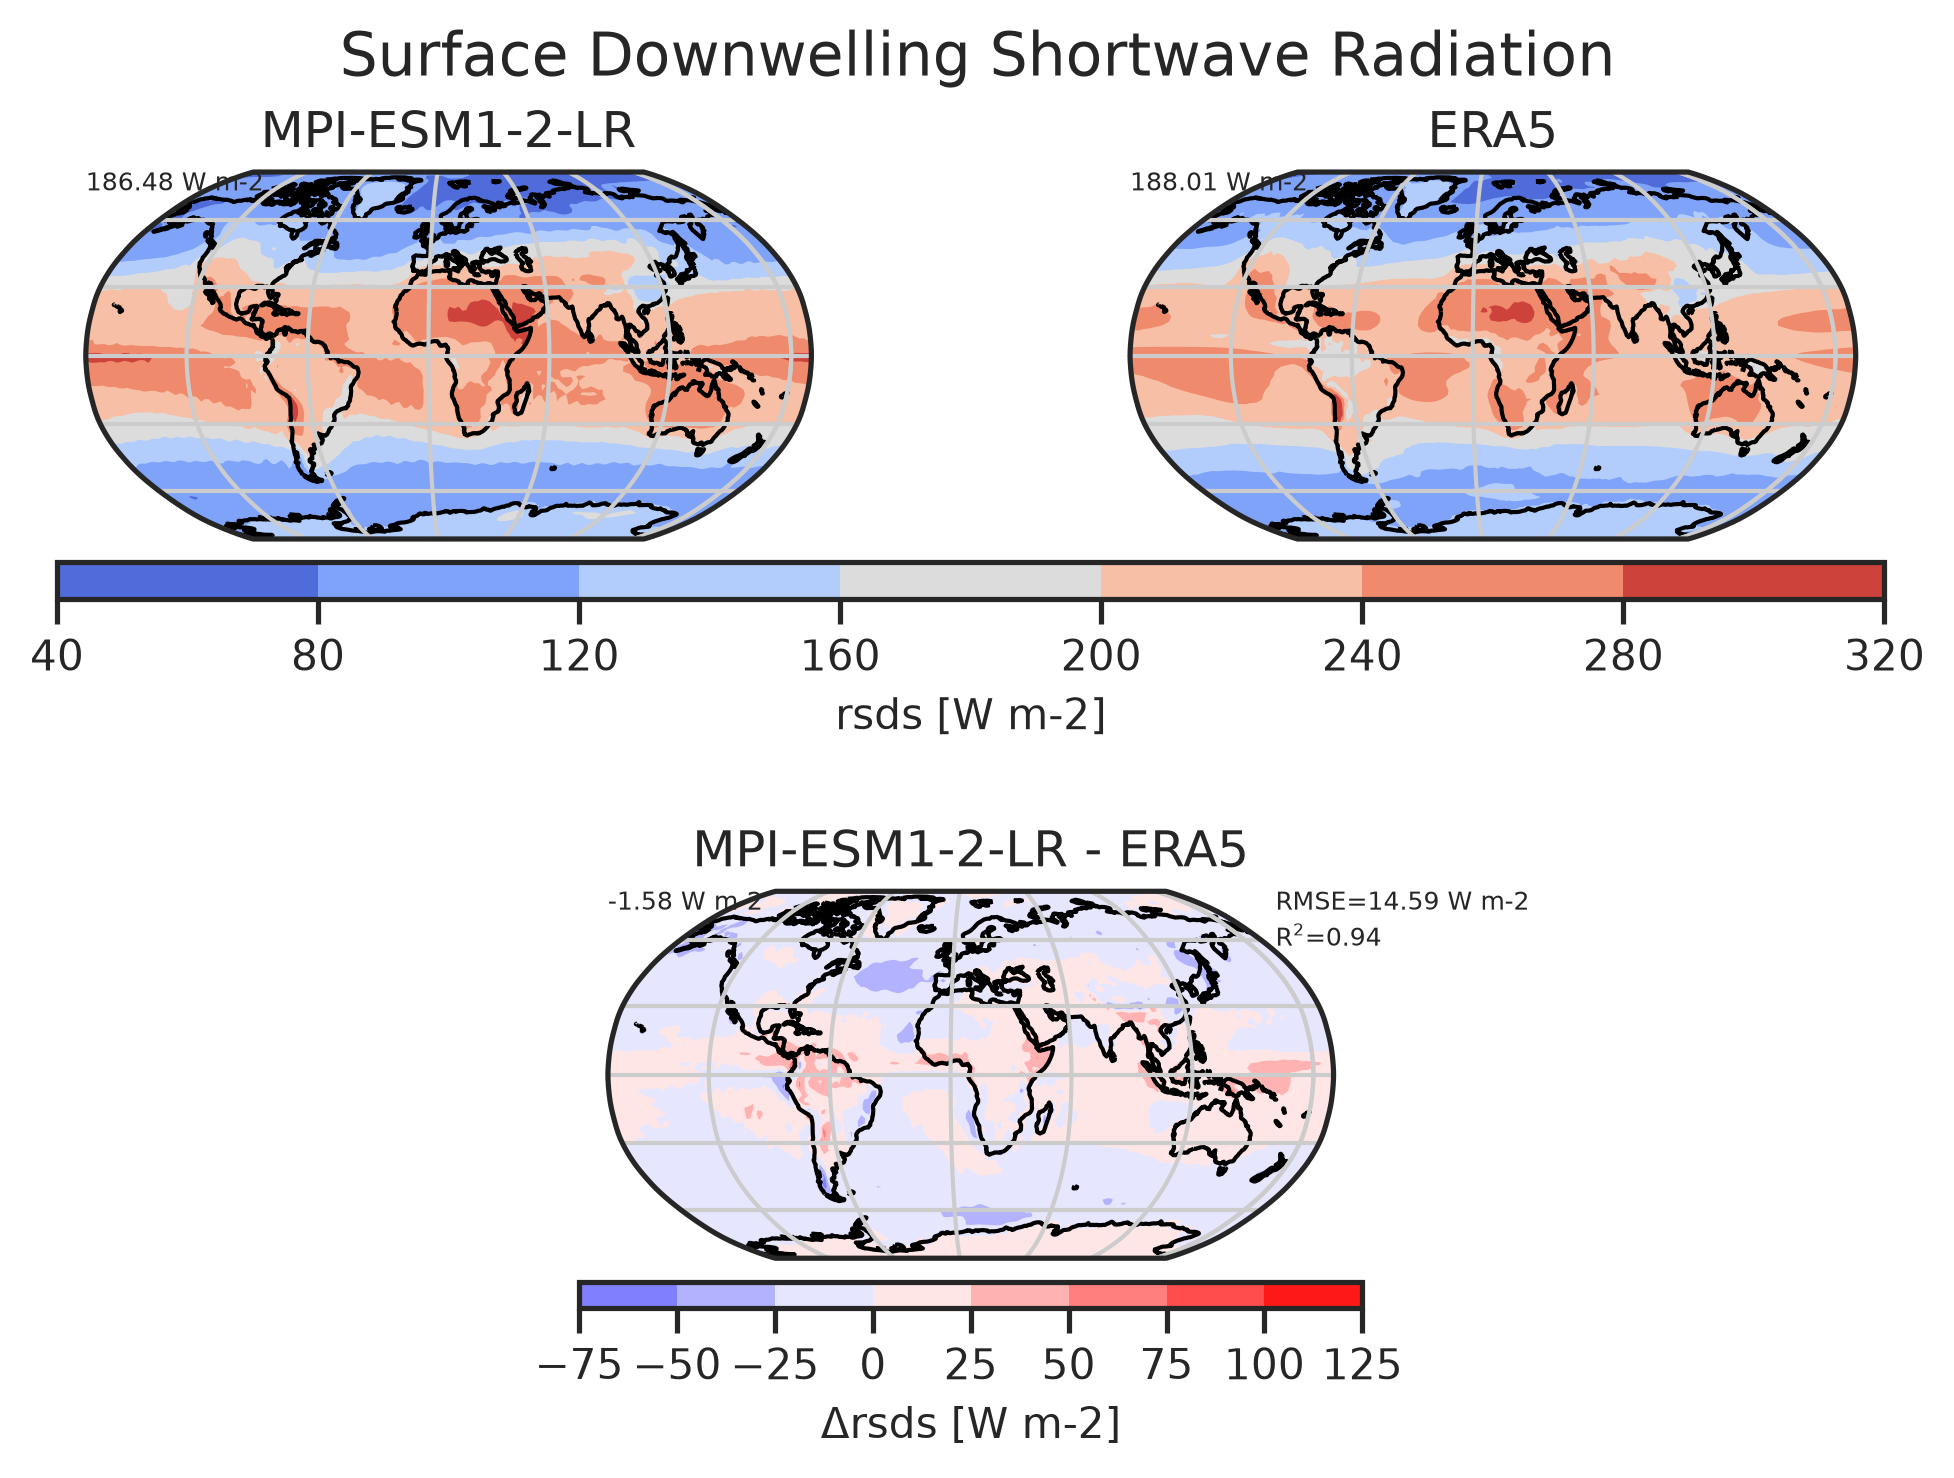
Plot Rsds: Plot

Surface Downward Shortwave Radiation for MPI-ESM1-2-LR.

download | references | extra data citation | provenance

Data files

Plot Rsds: Rsds

Data files

Files

main_log.txt | main_log_debug.txt | recipe_impacts_map.yml | figures | data