This a recipe to monitor experiments by automatizing the creation of plots from raw preprocessor output.
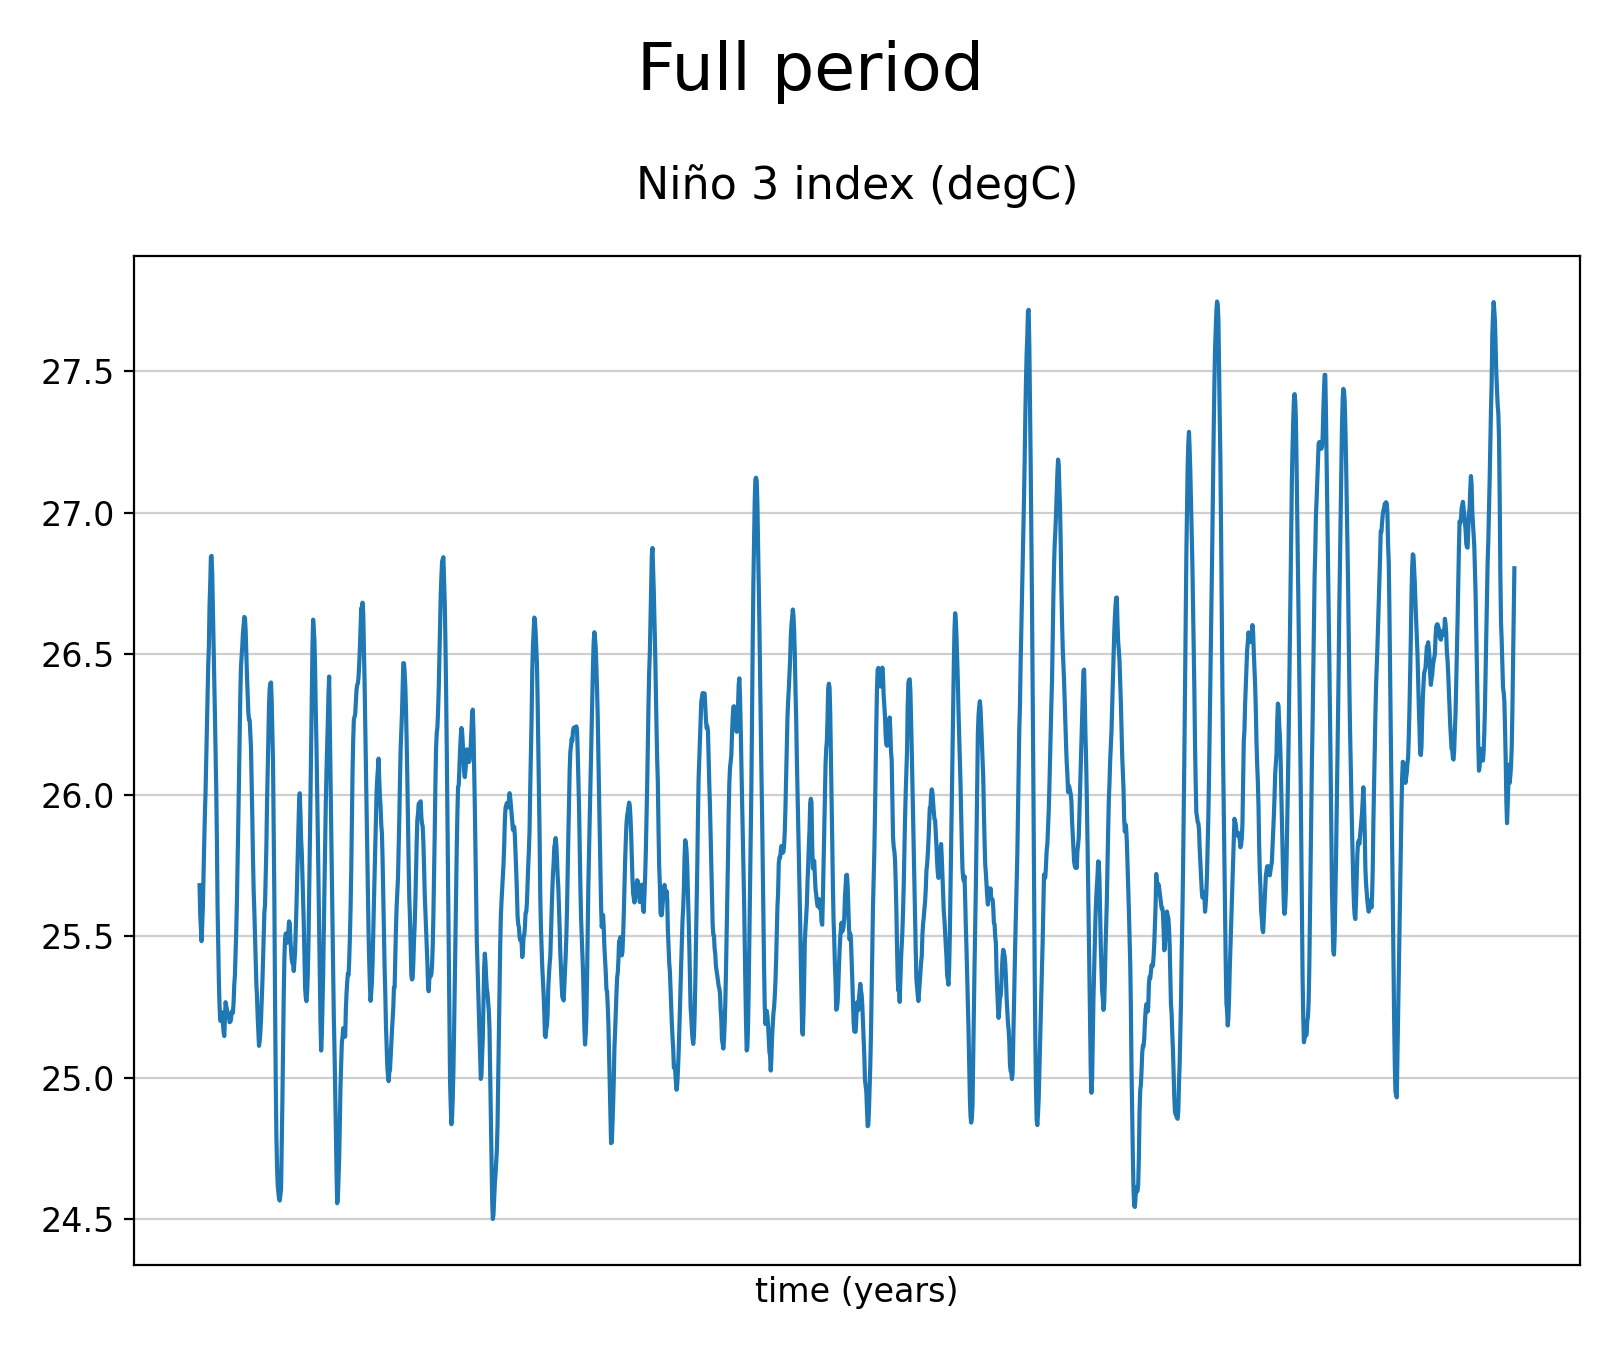
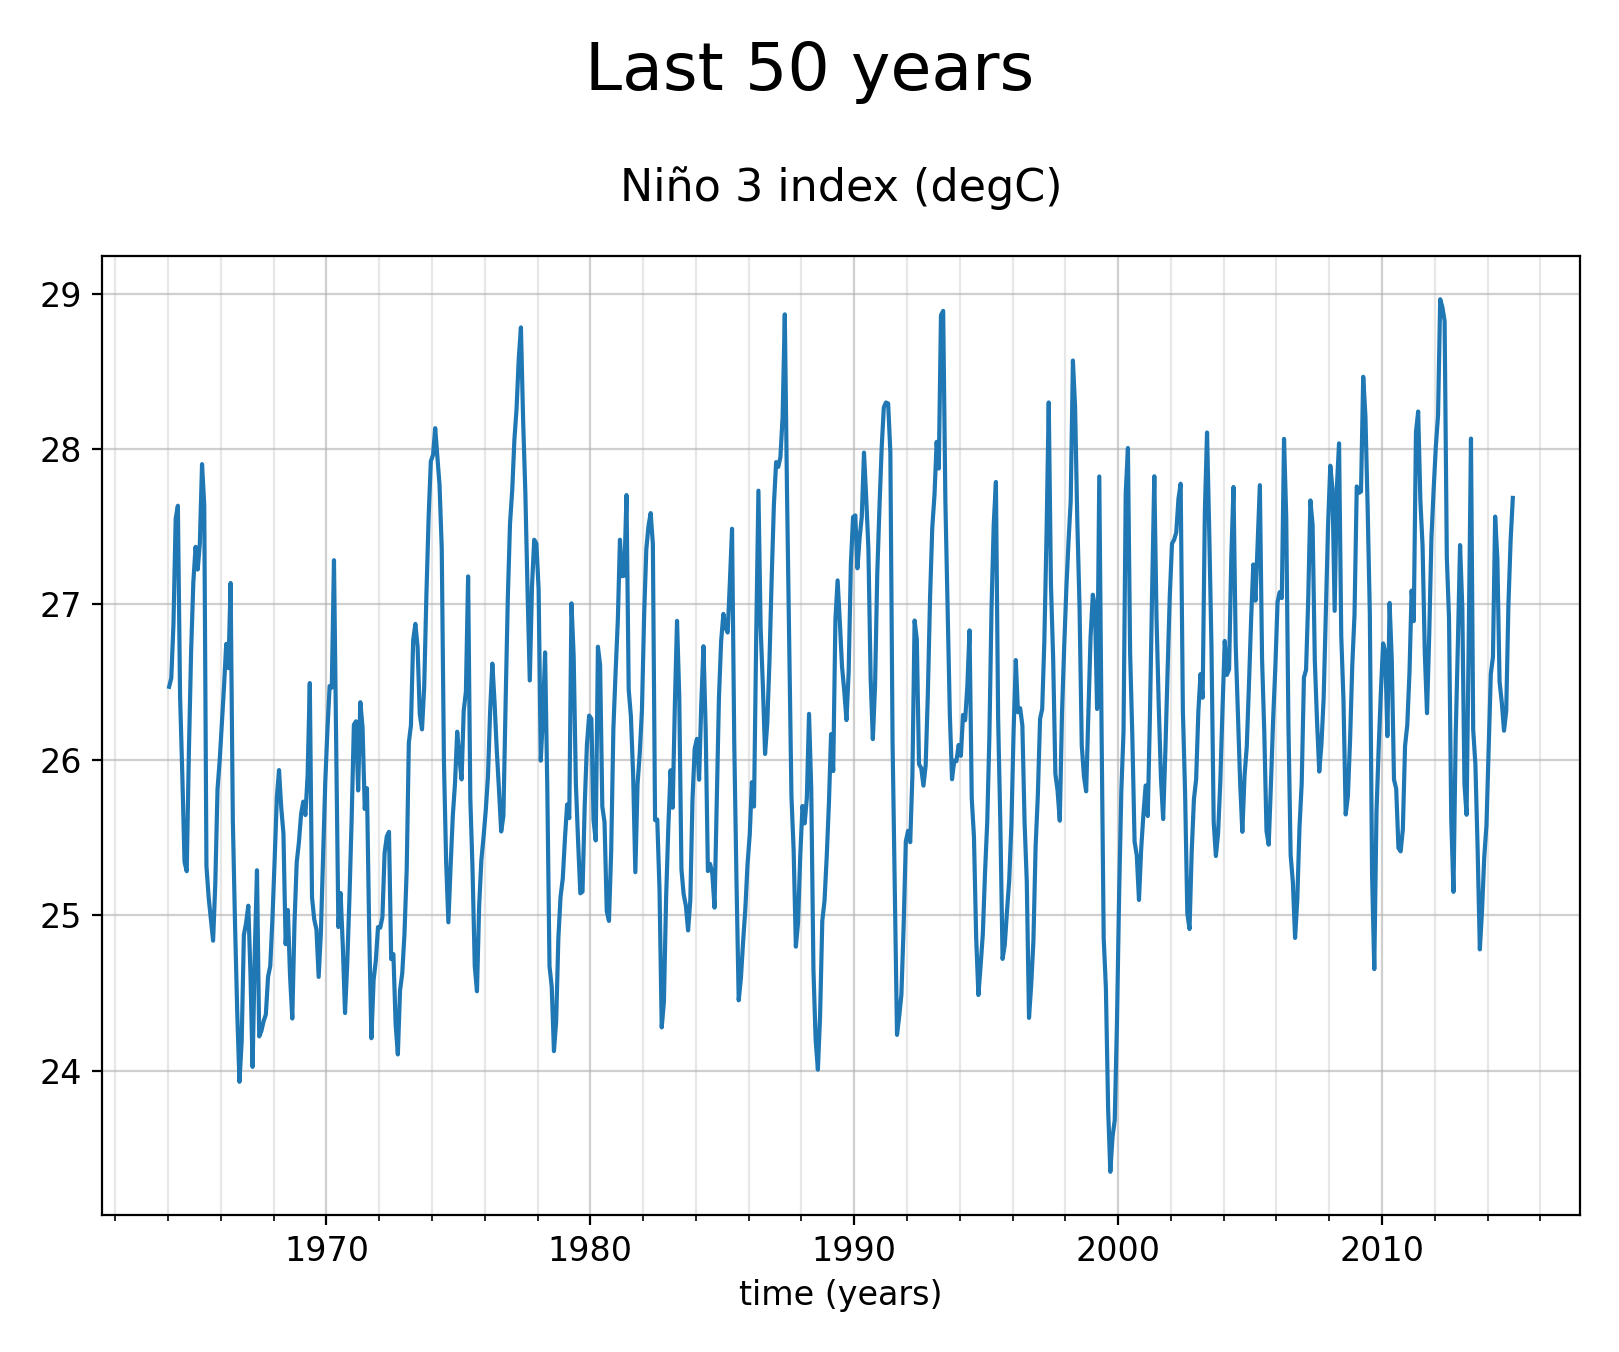
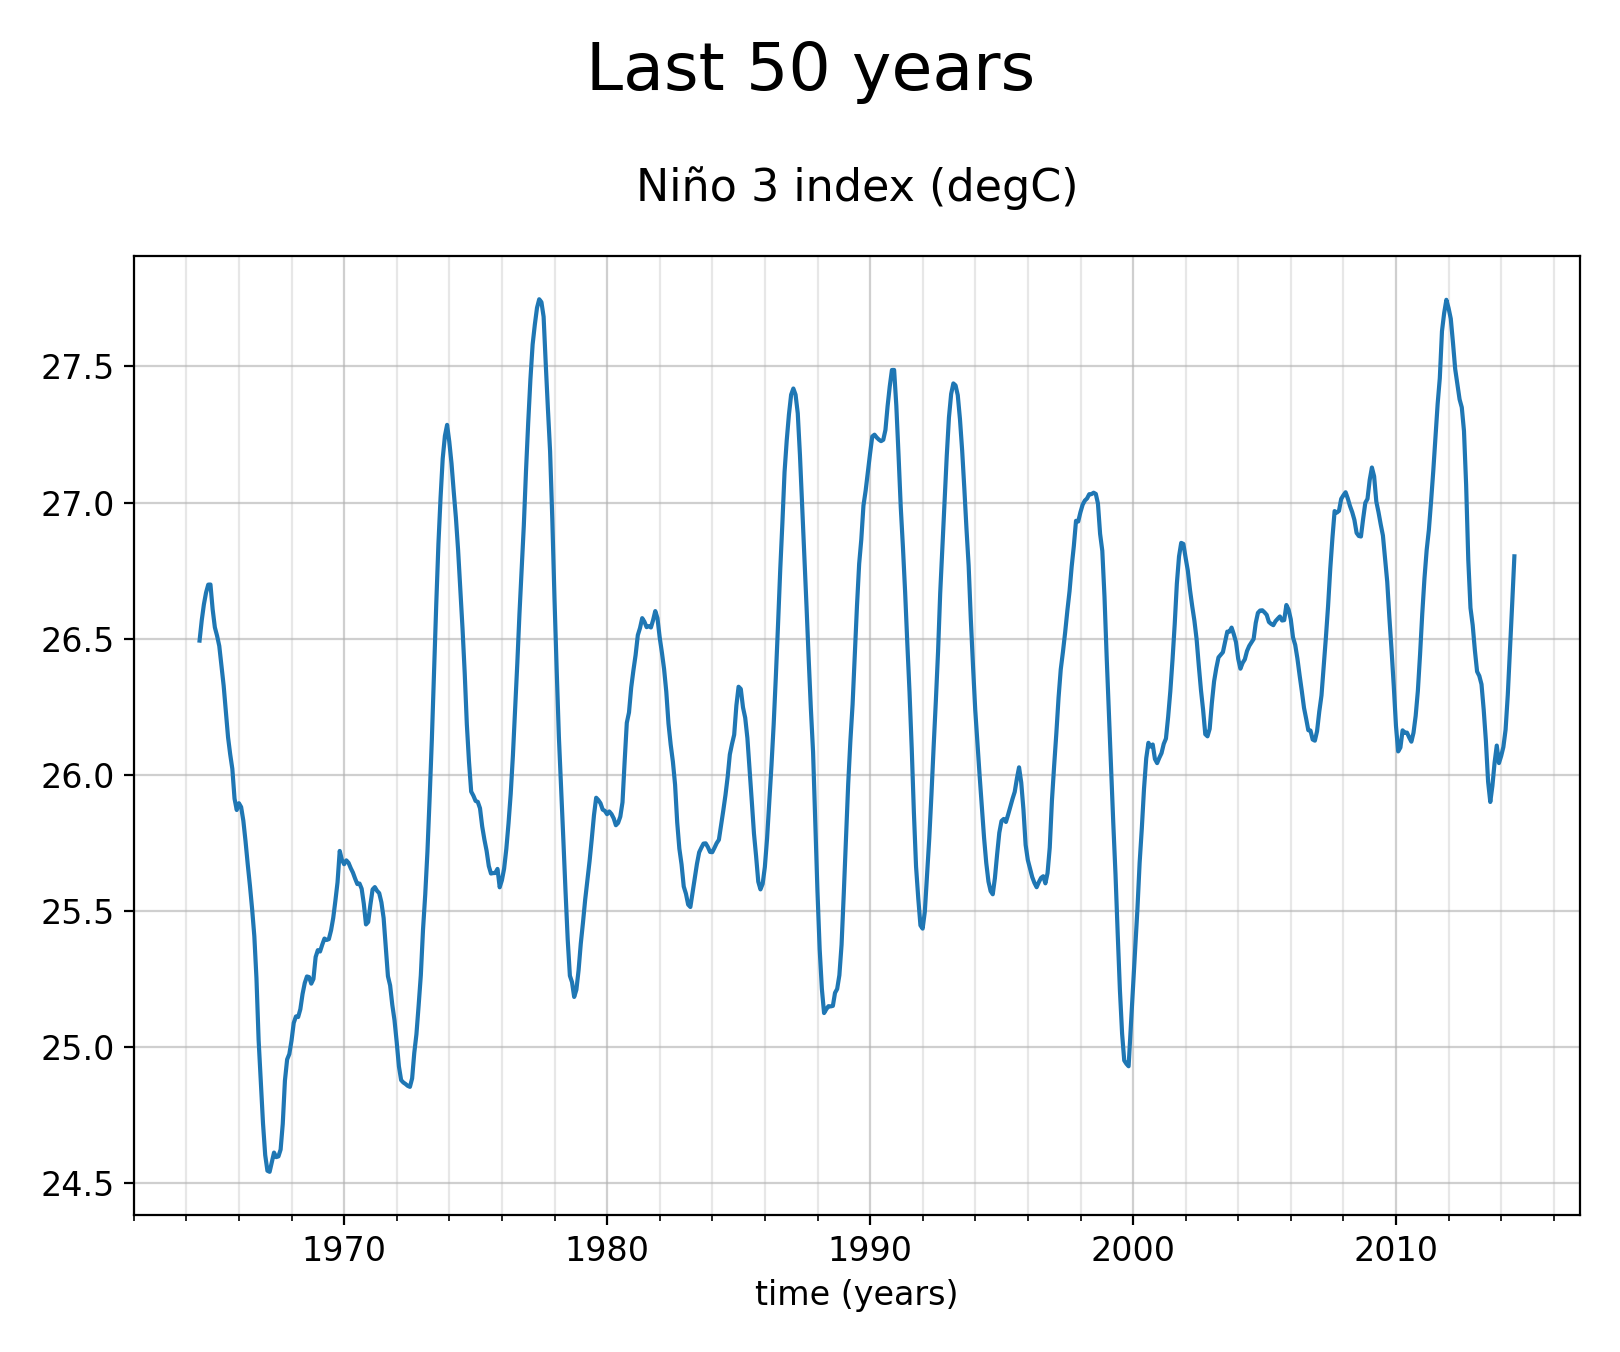
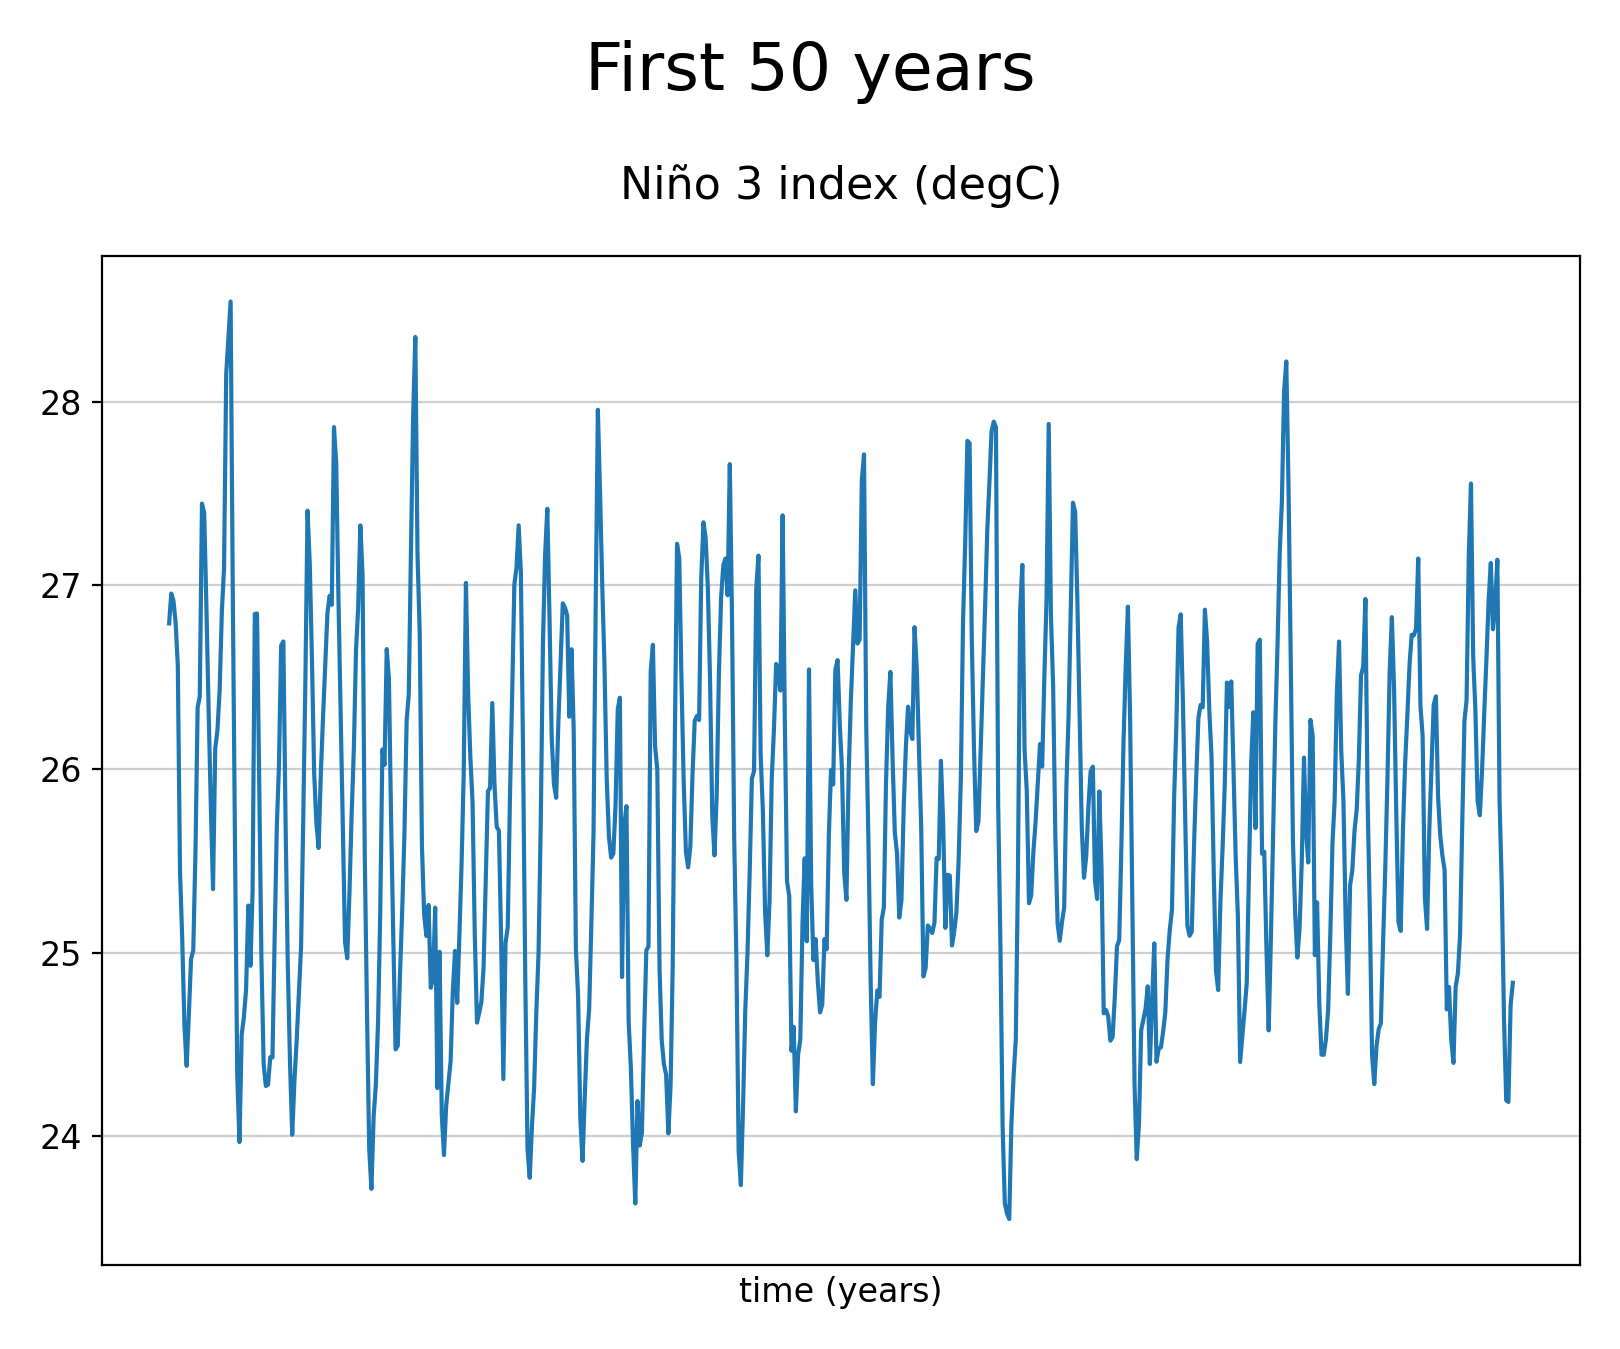
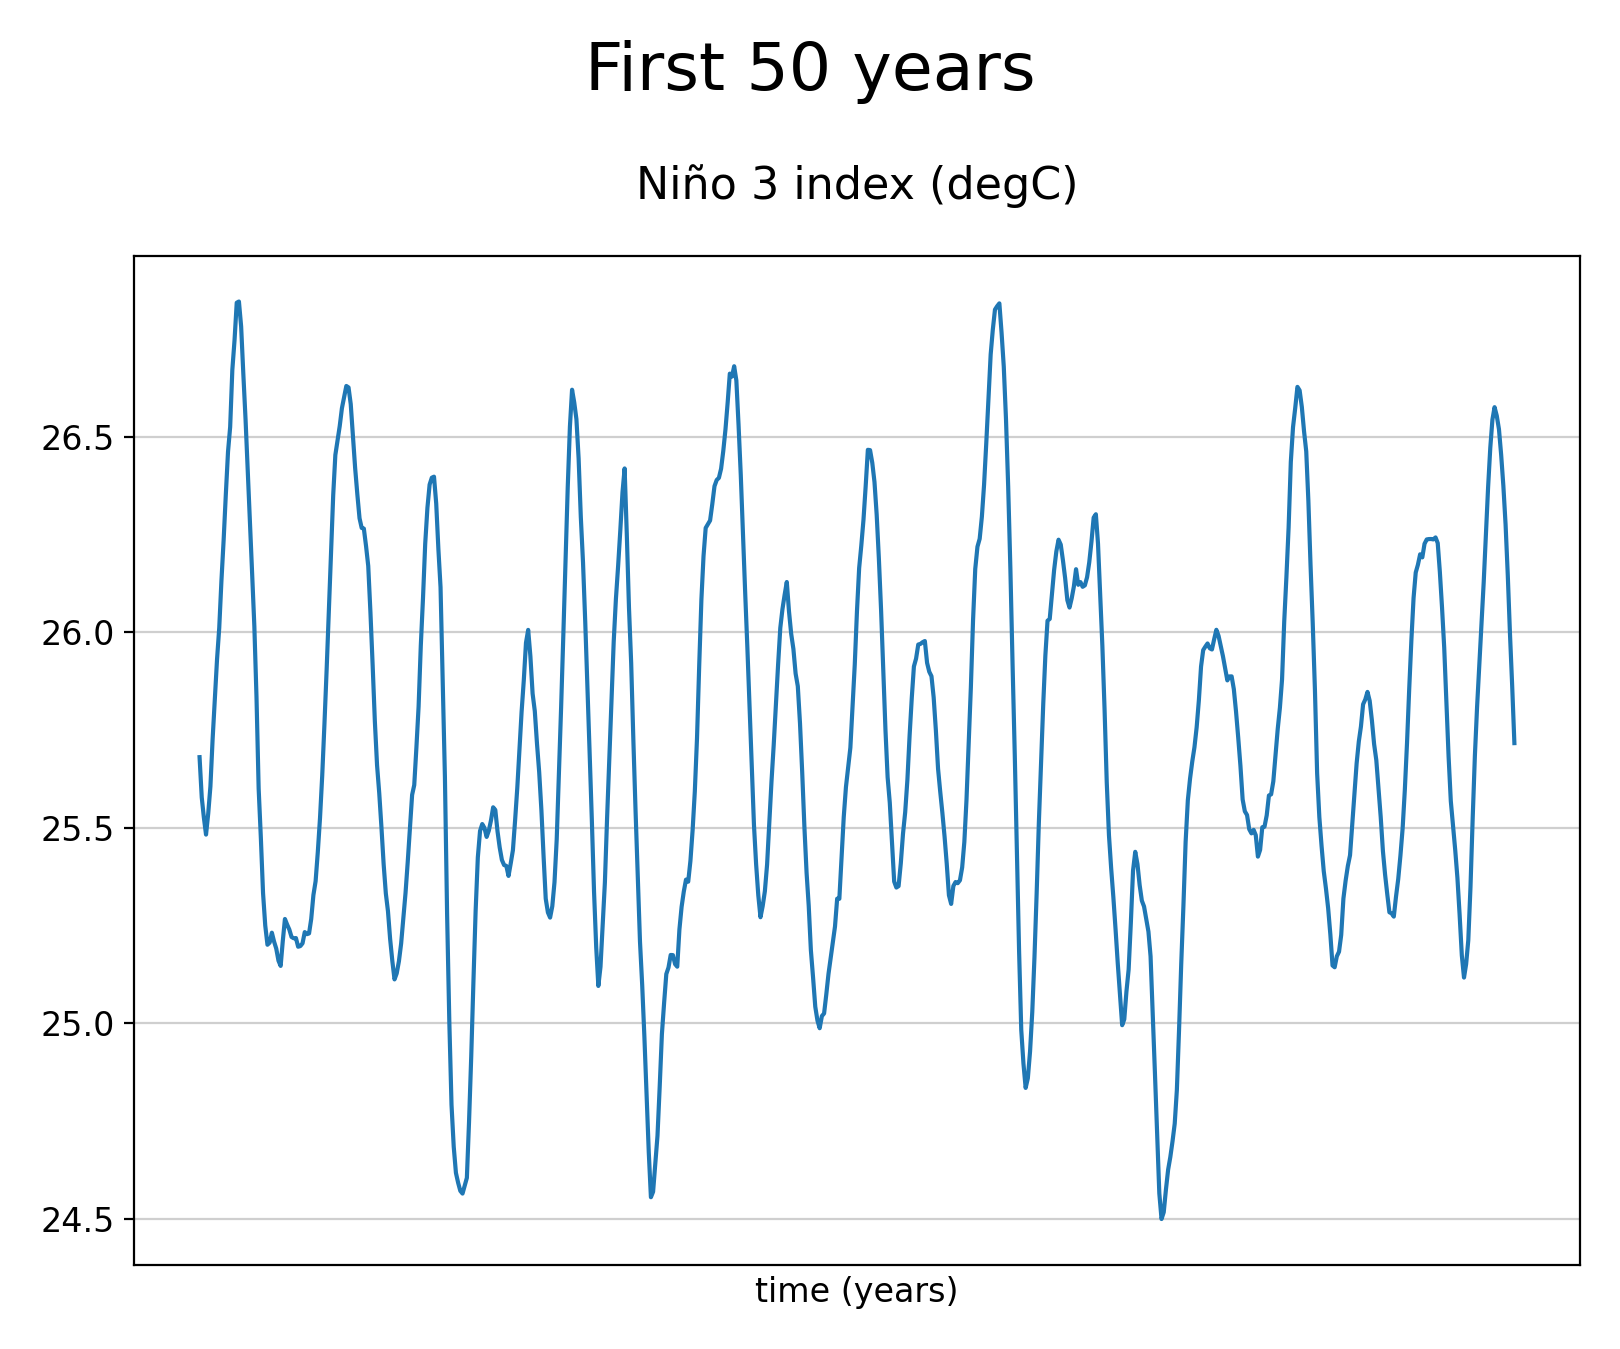
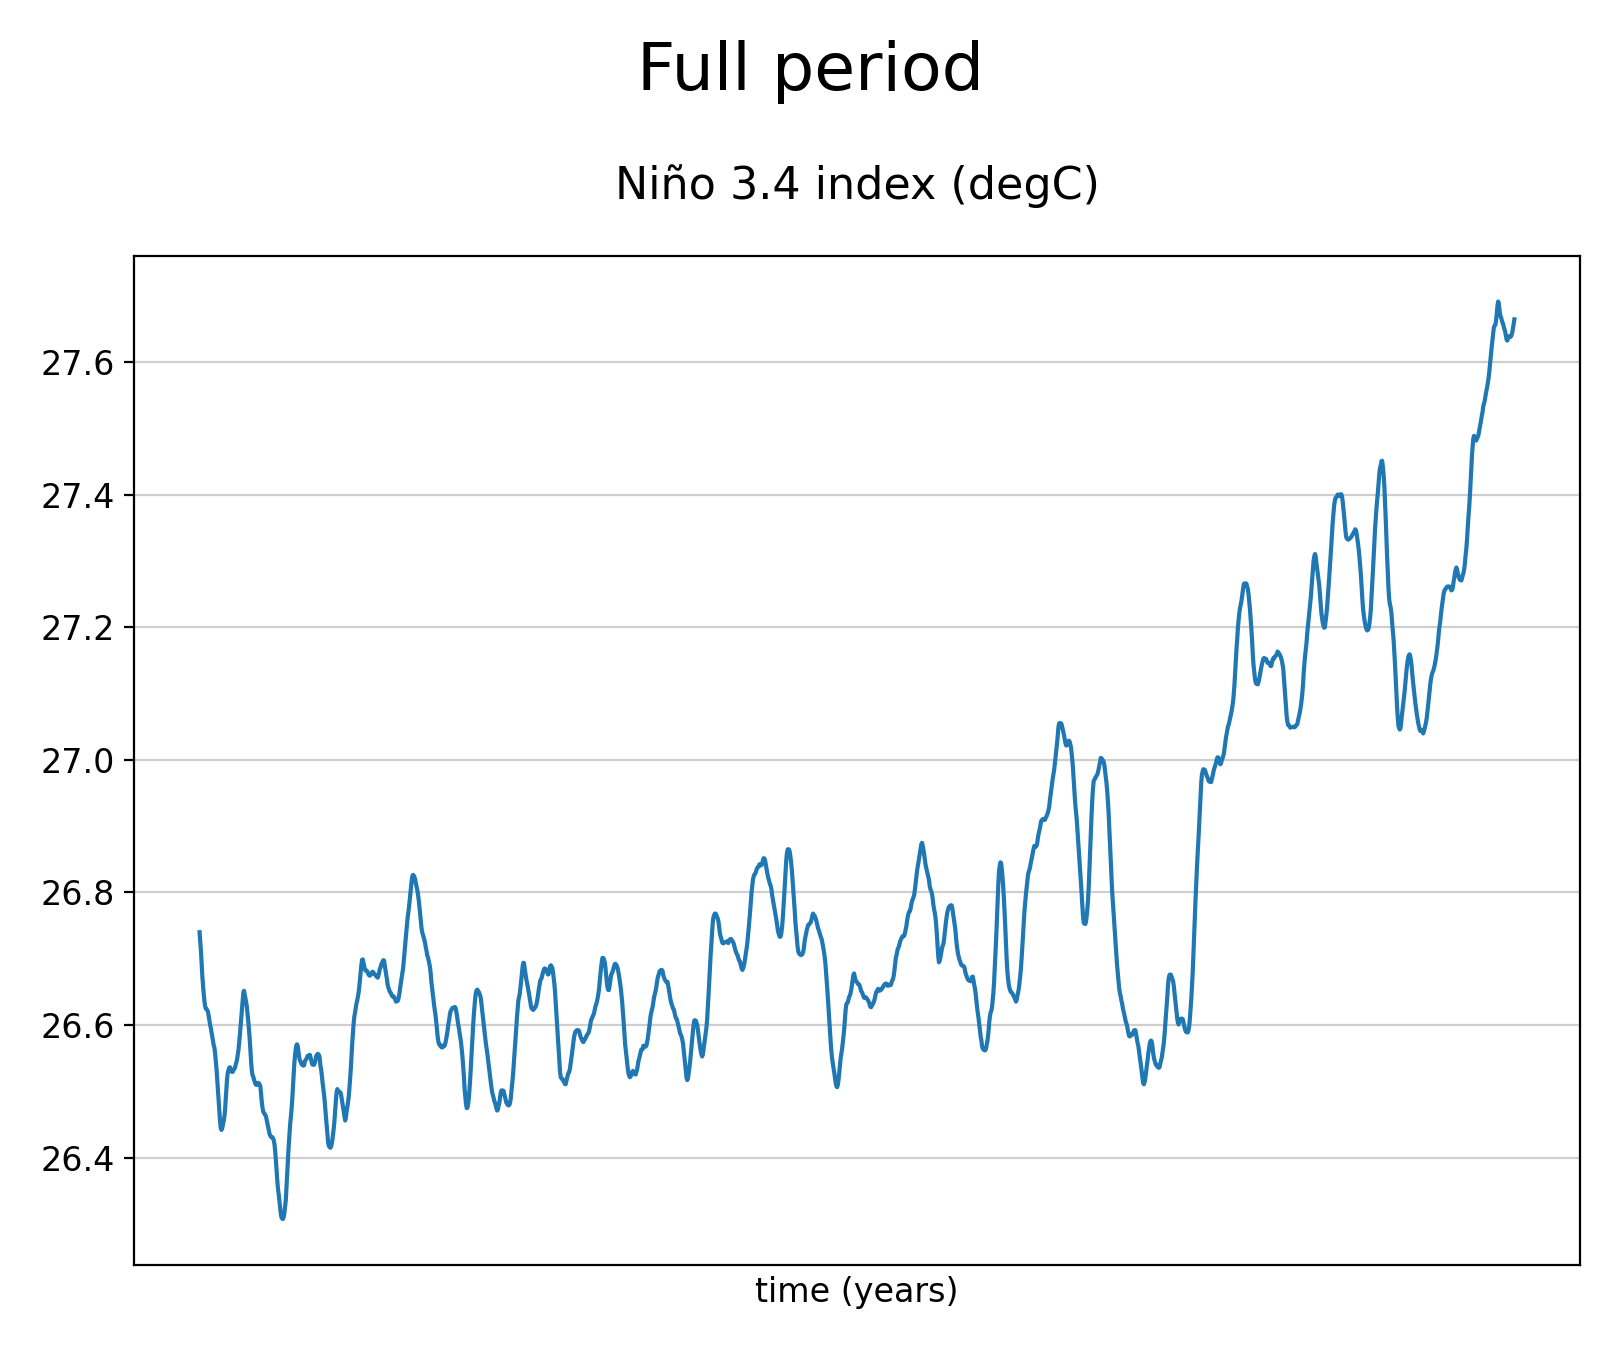
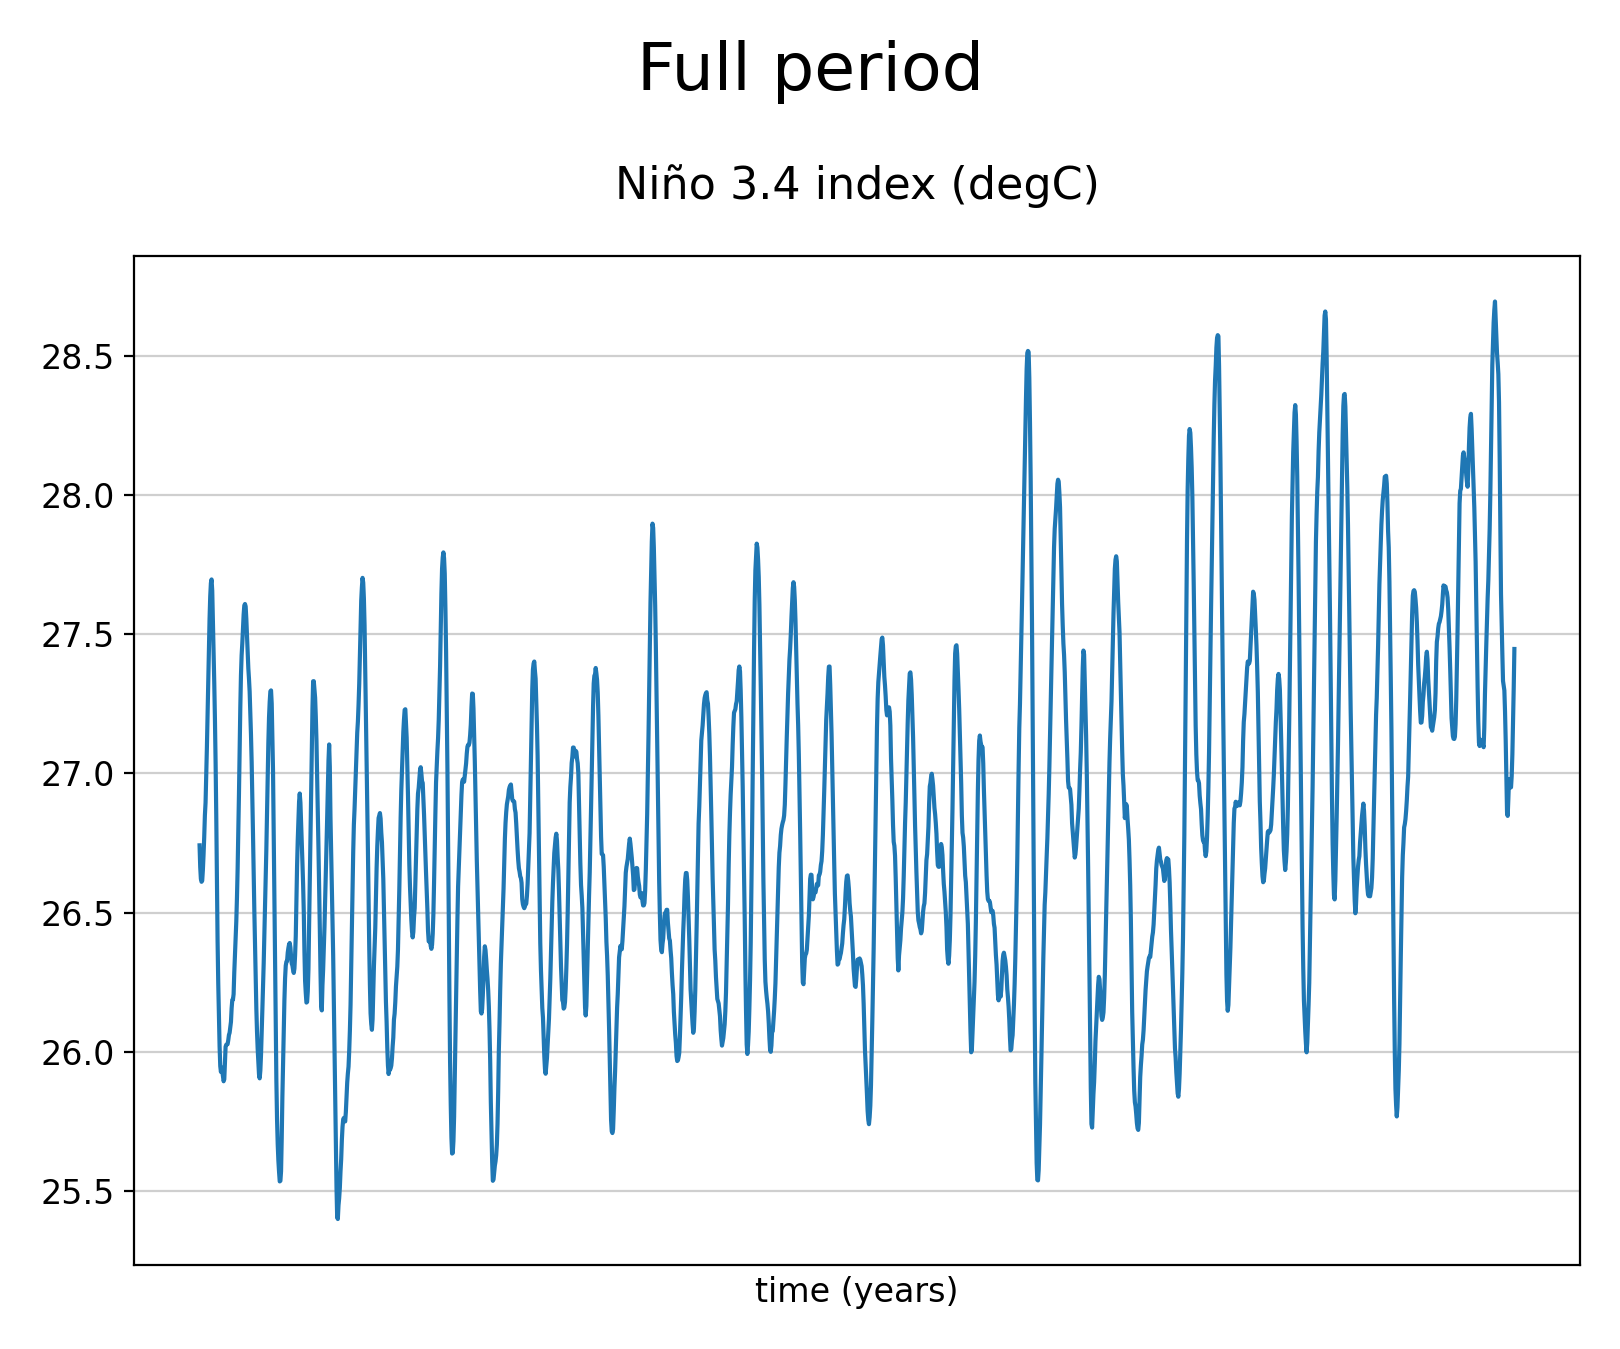
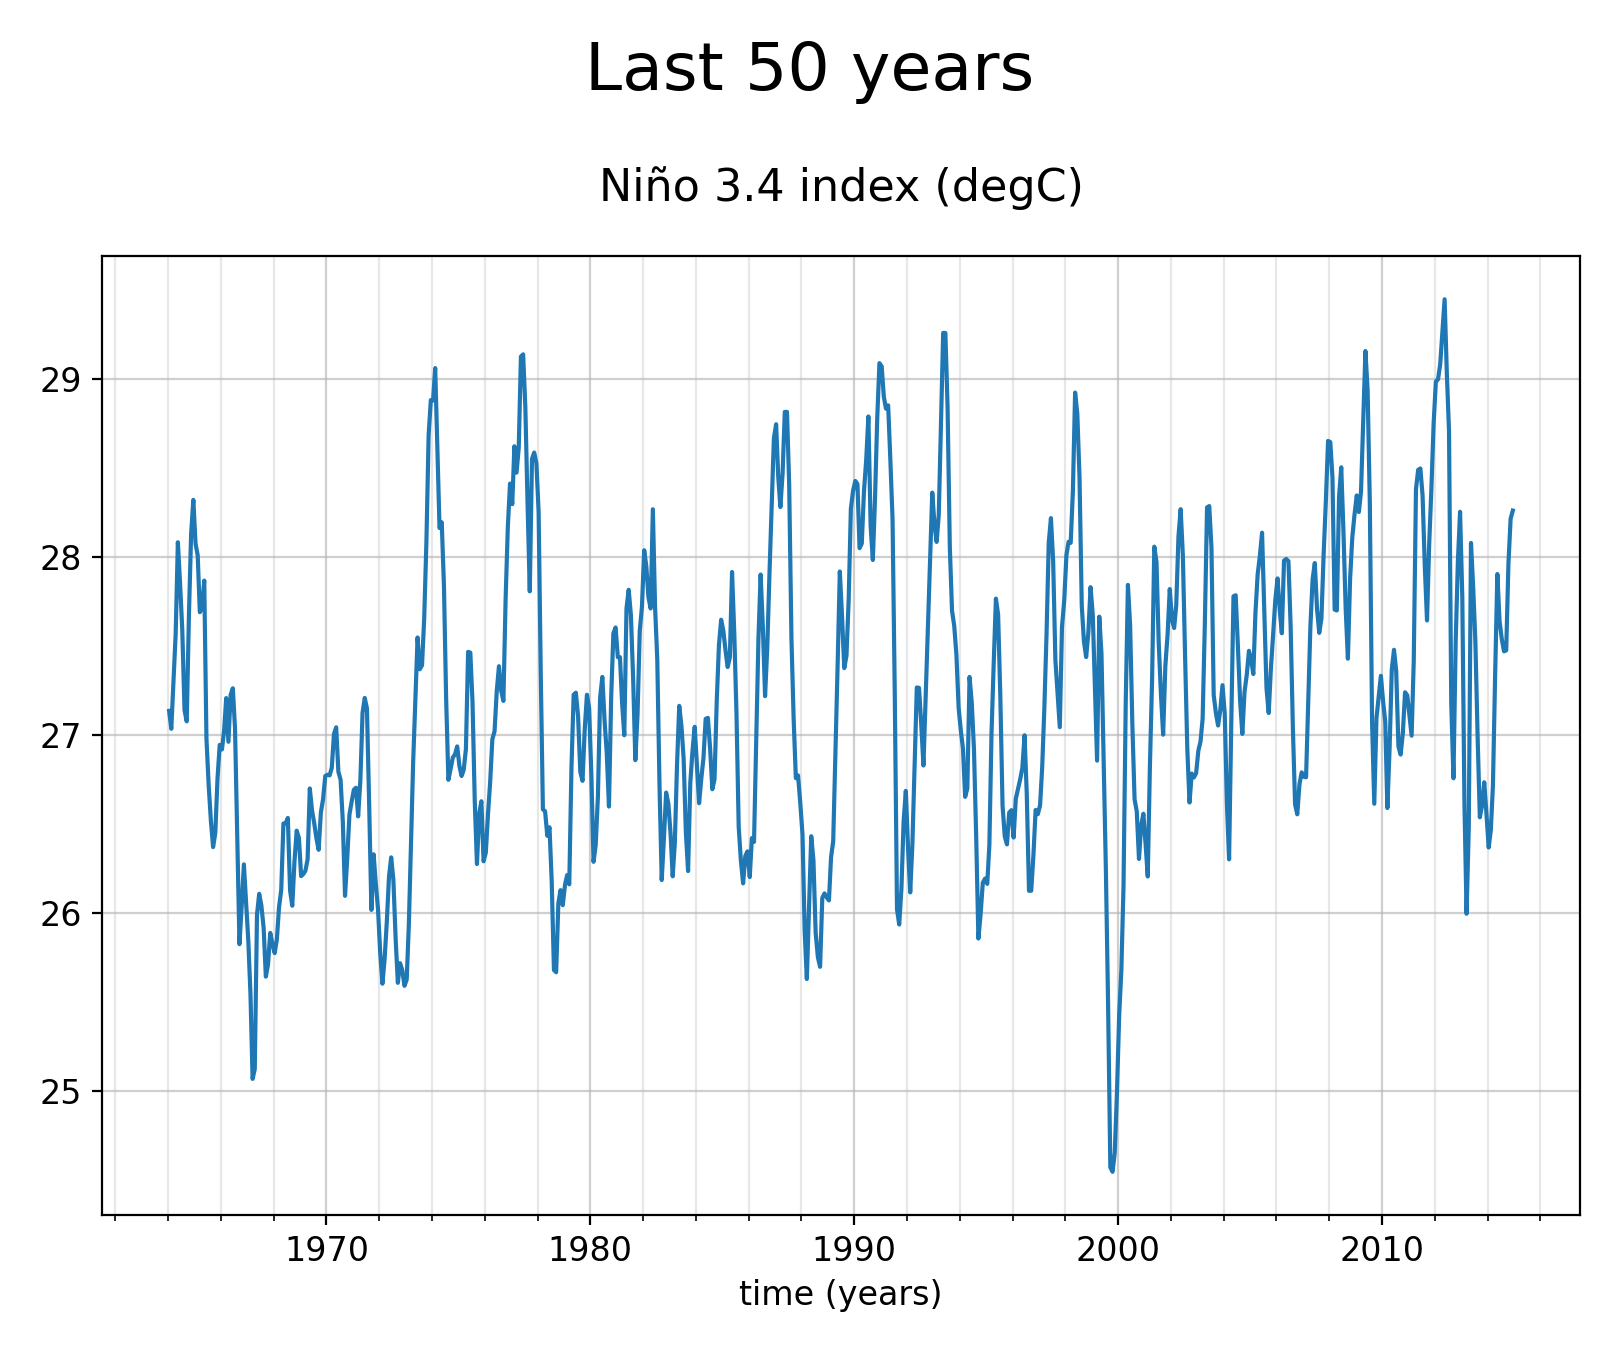
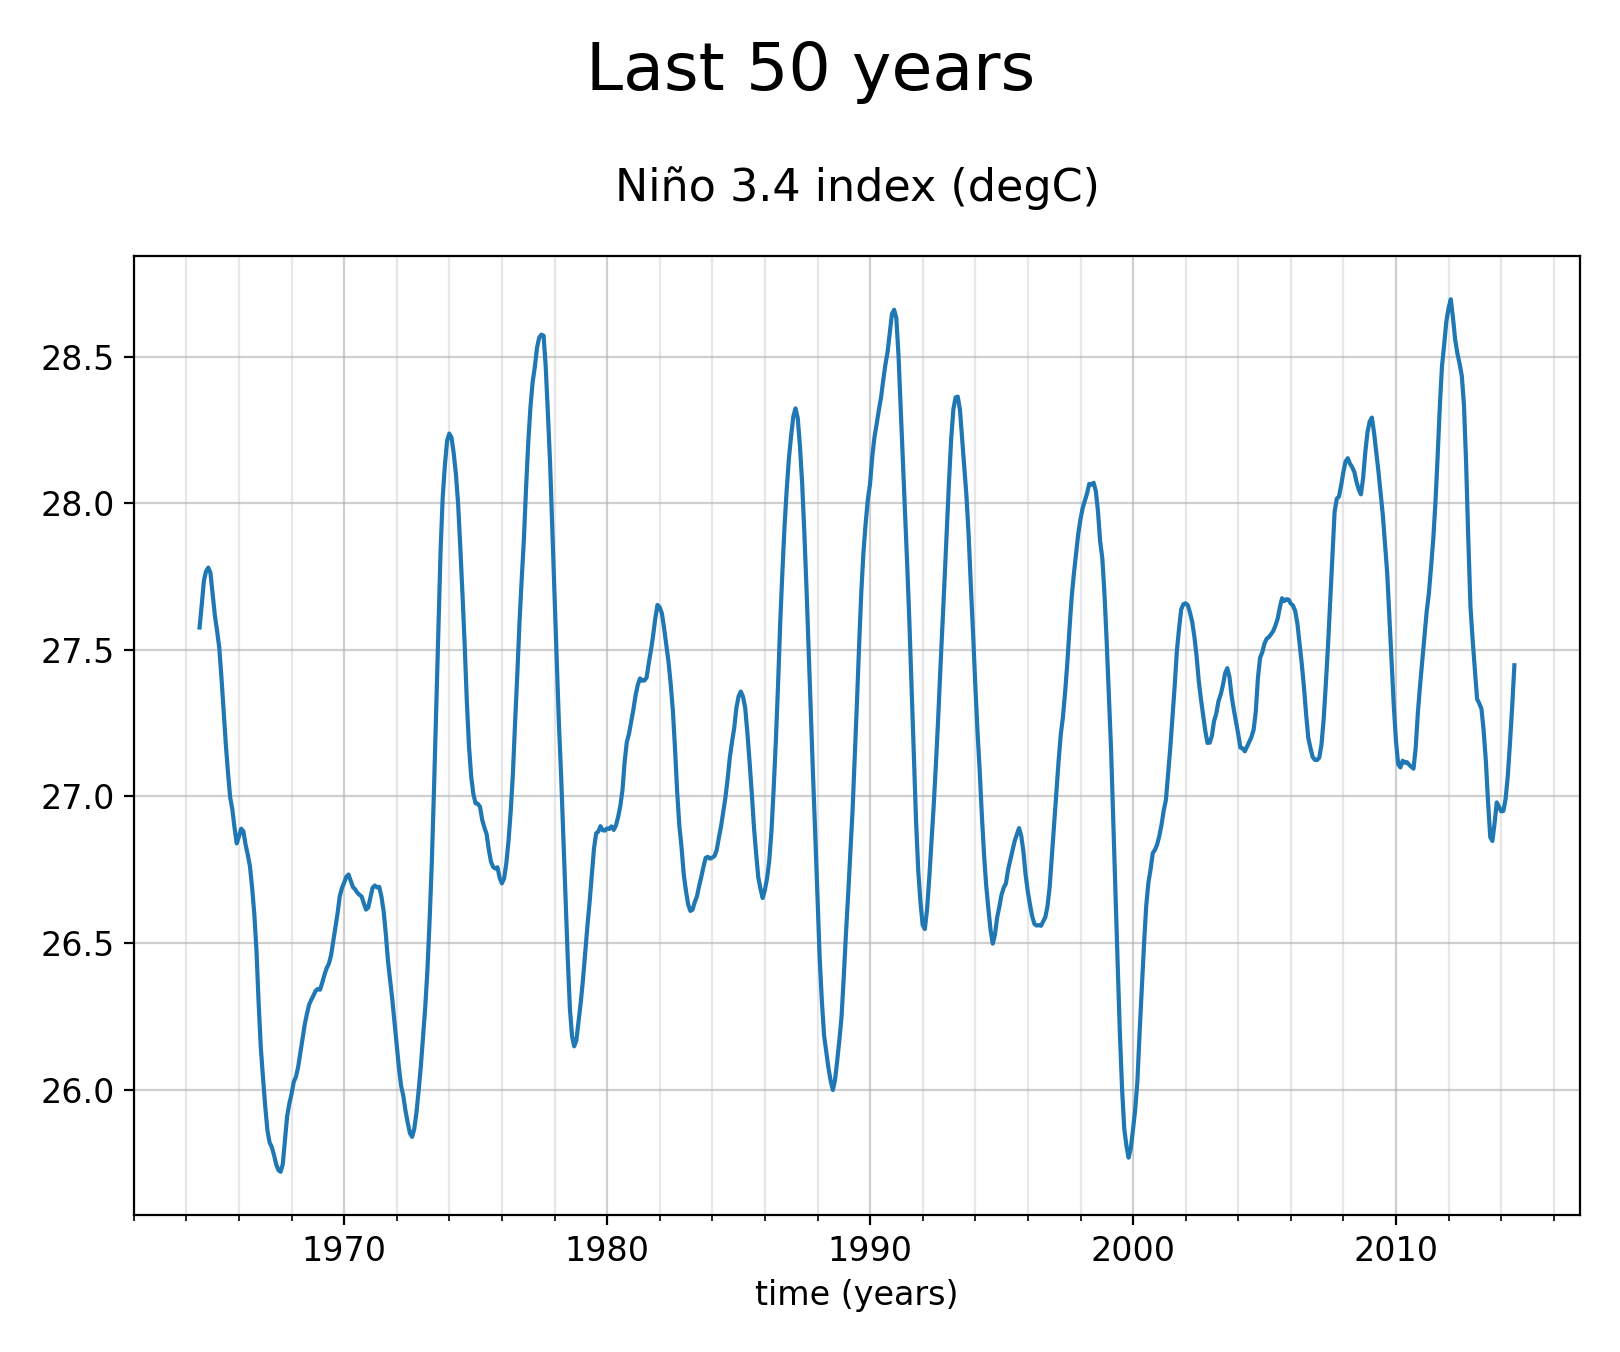
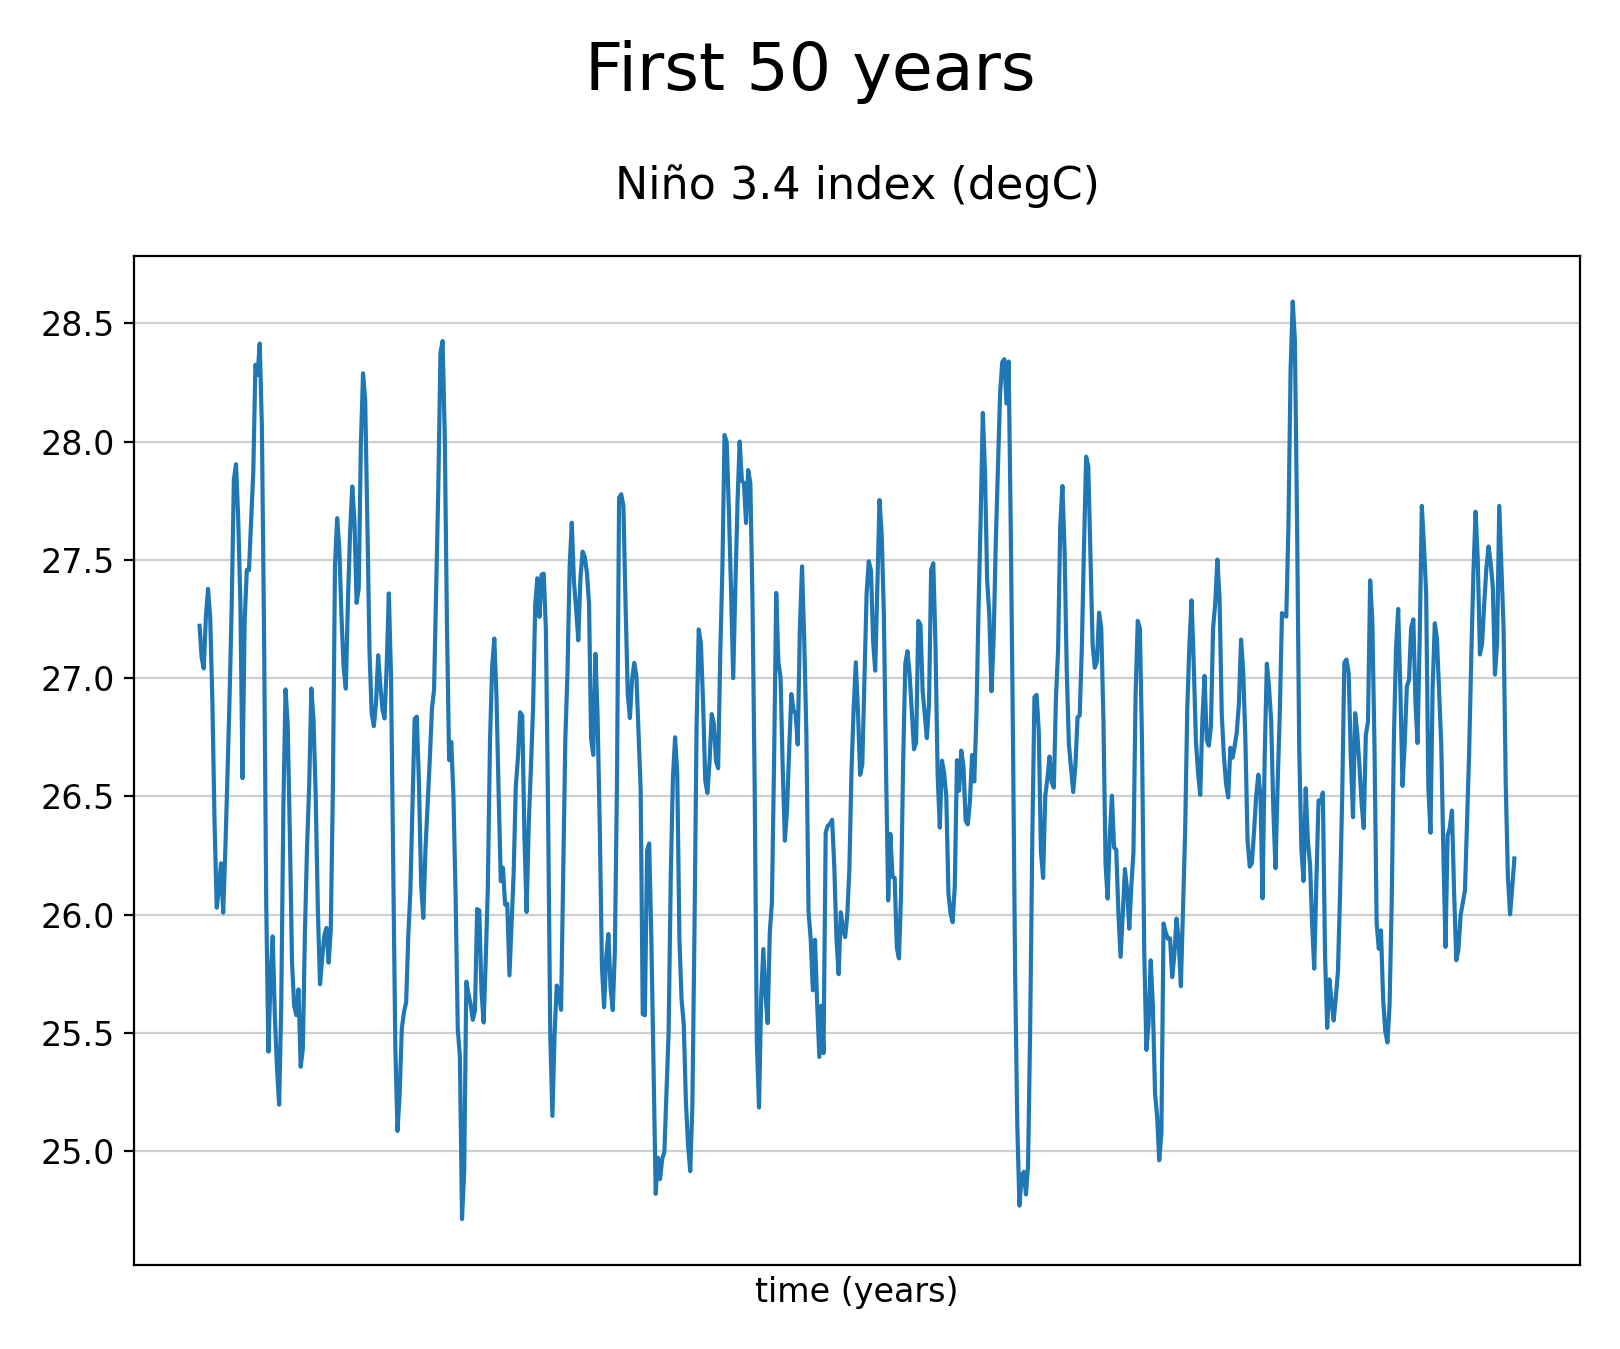
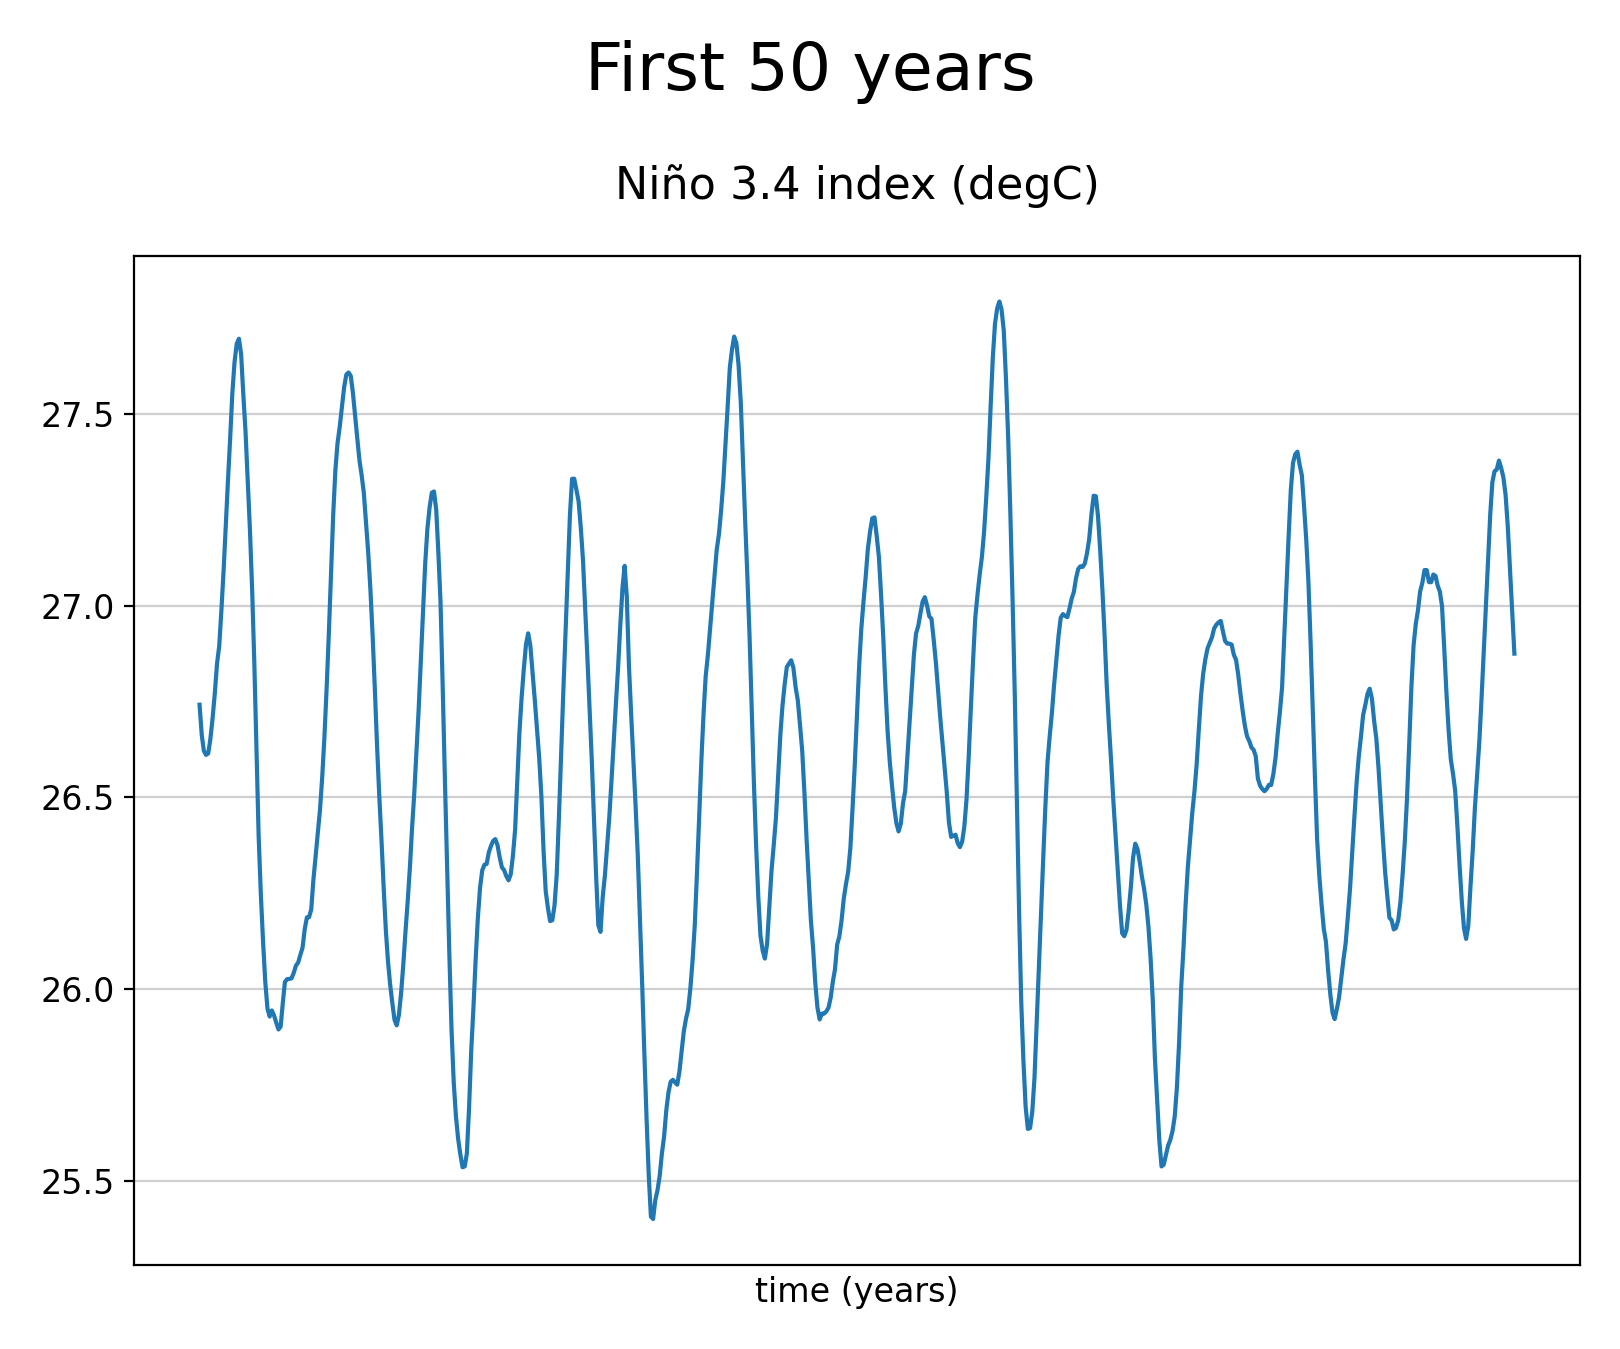
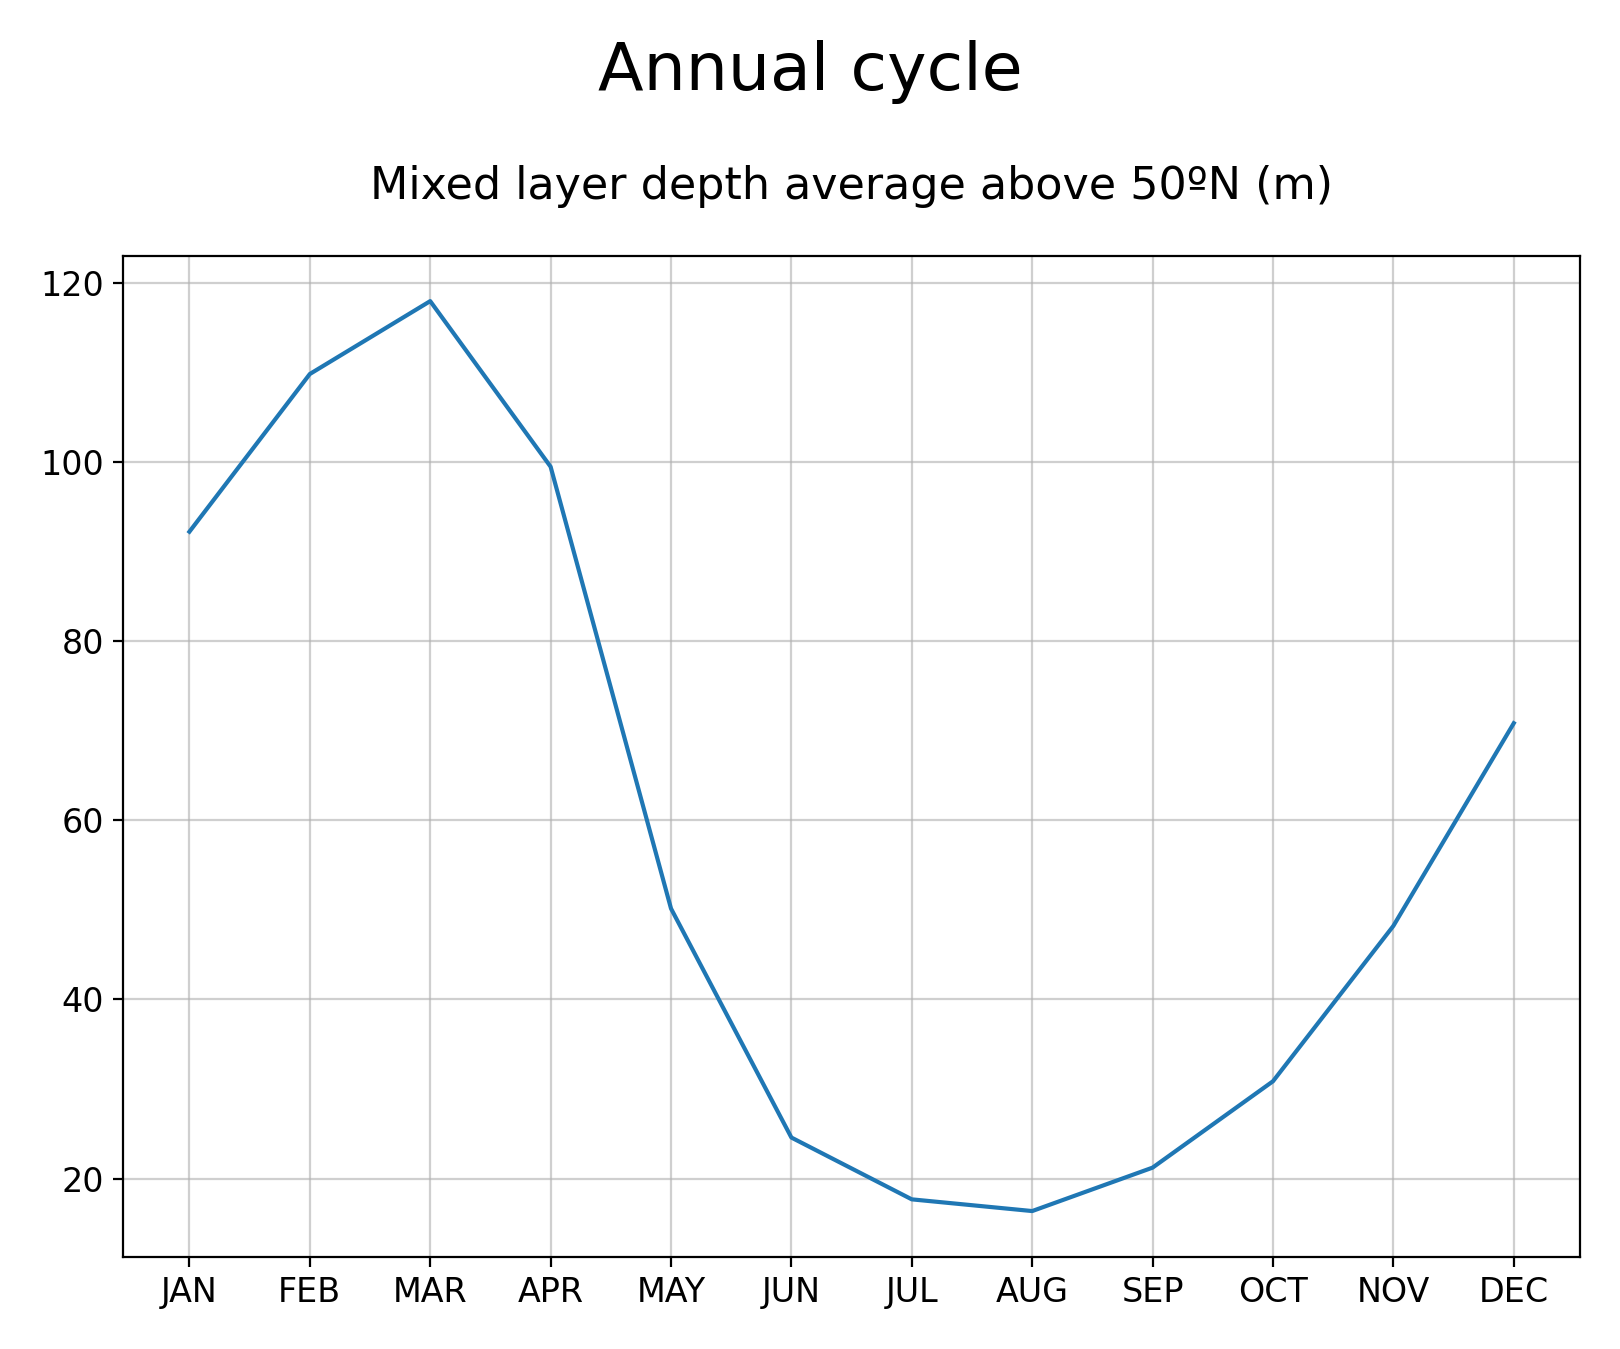
Plot time series and annualcycles
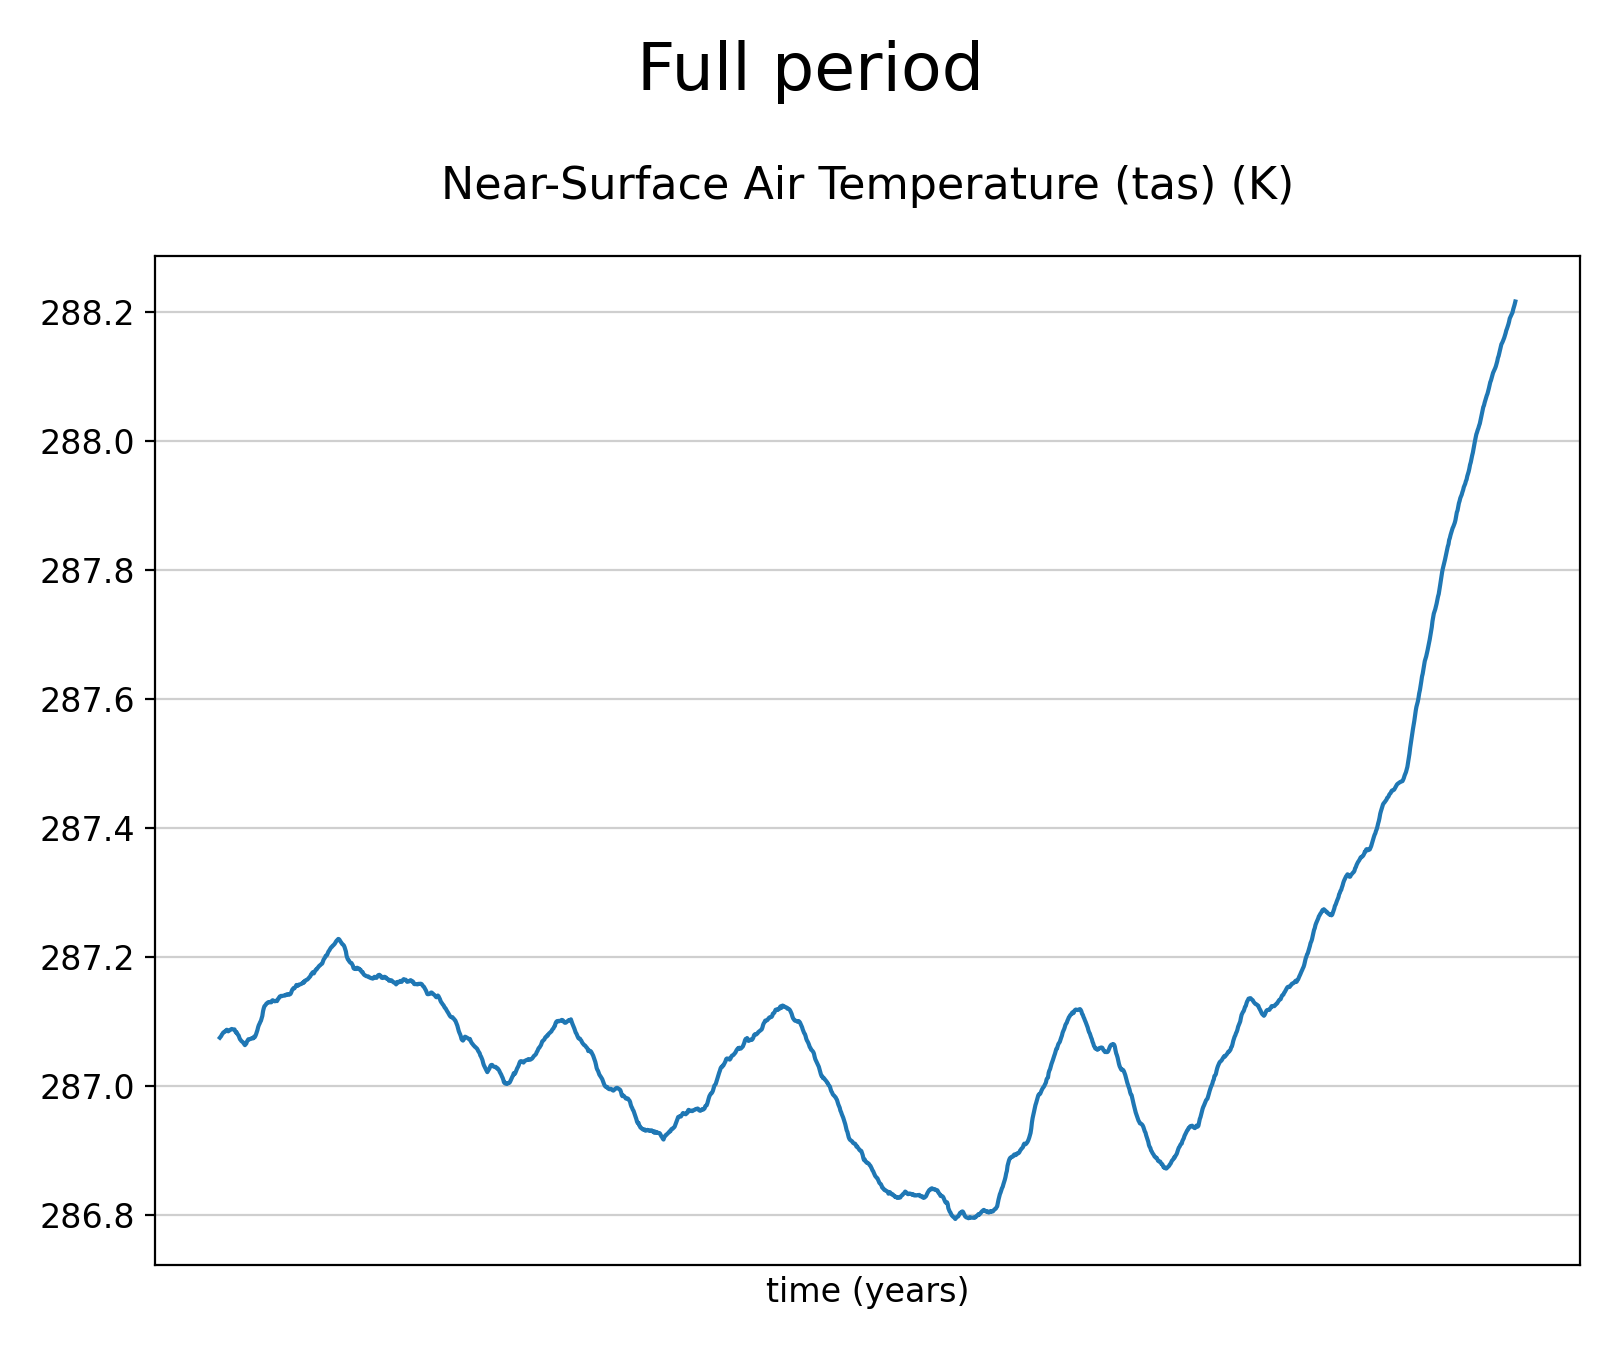
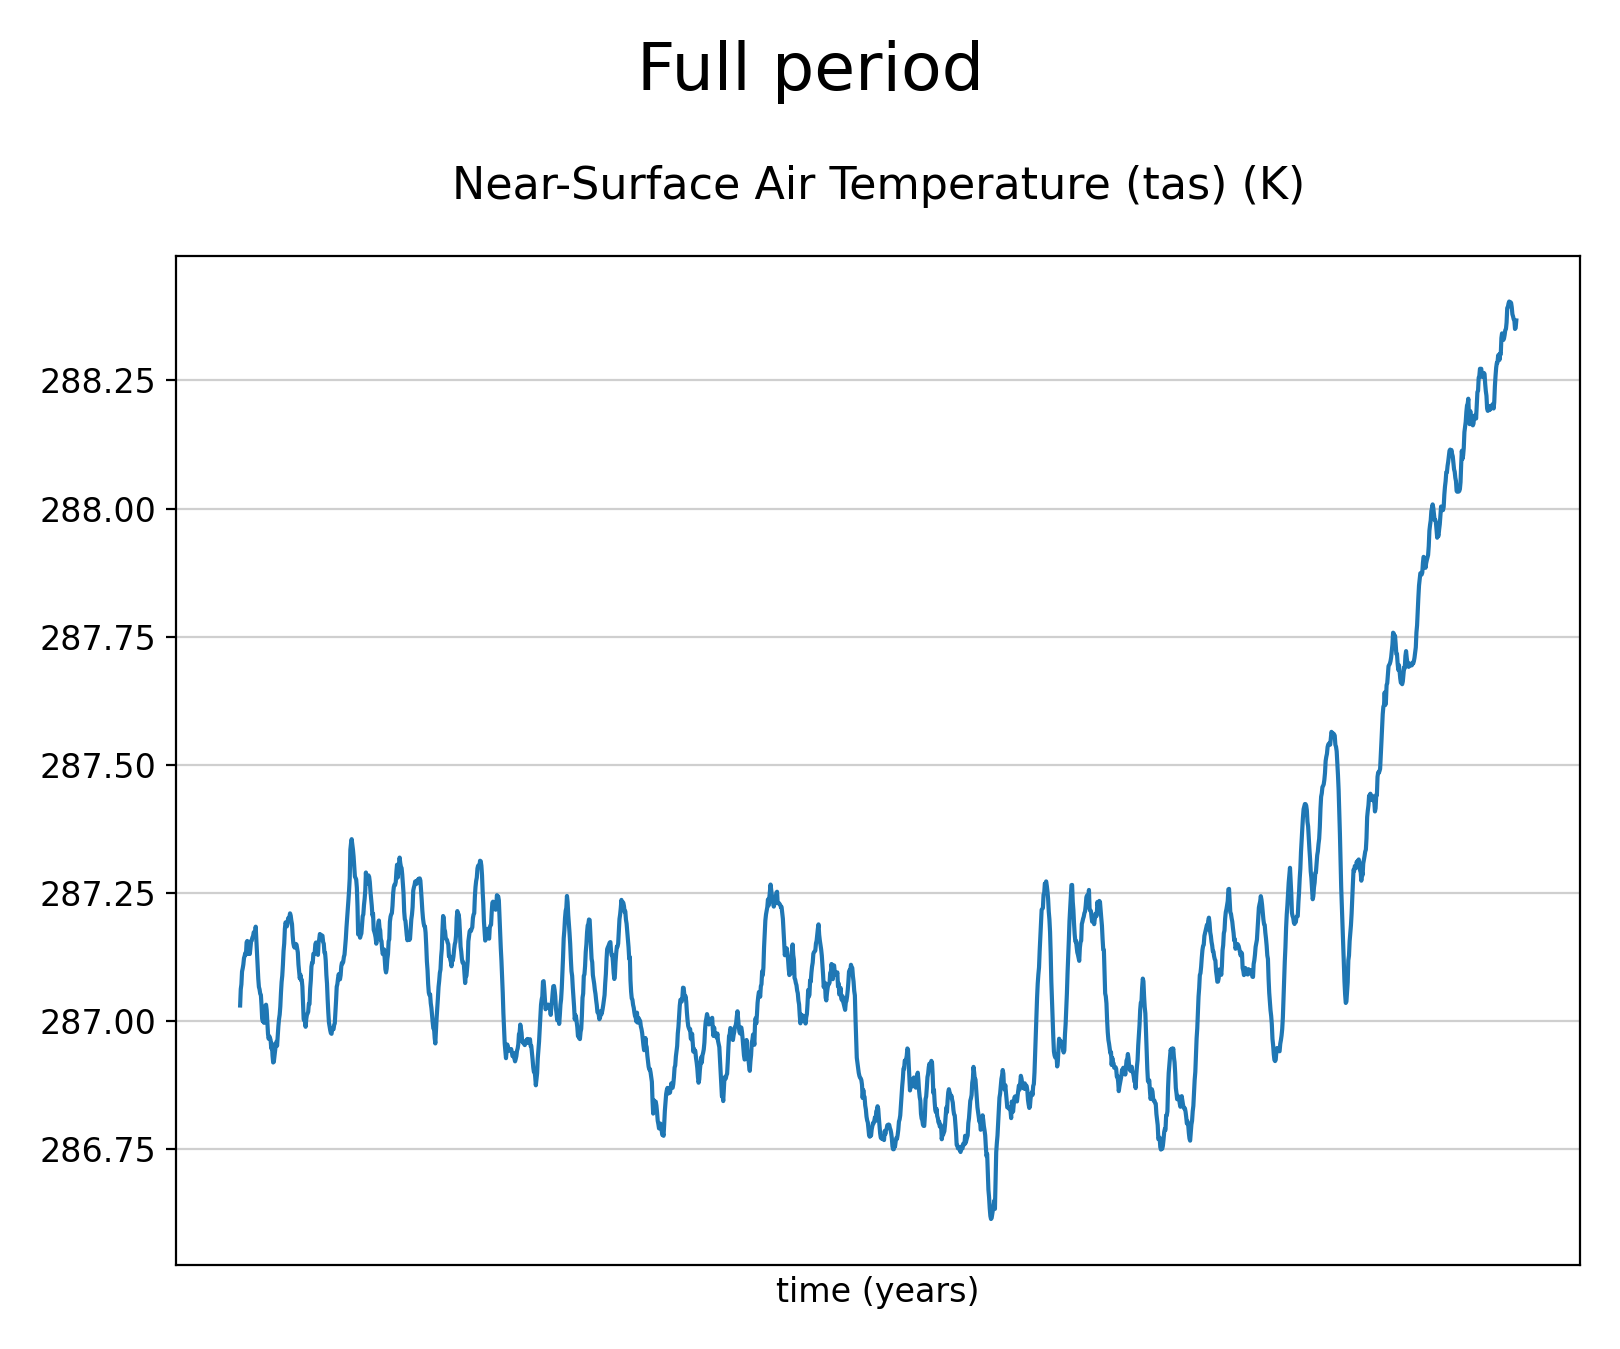
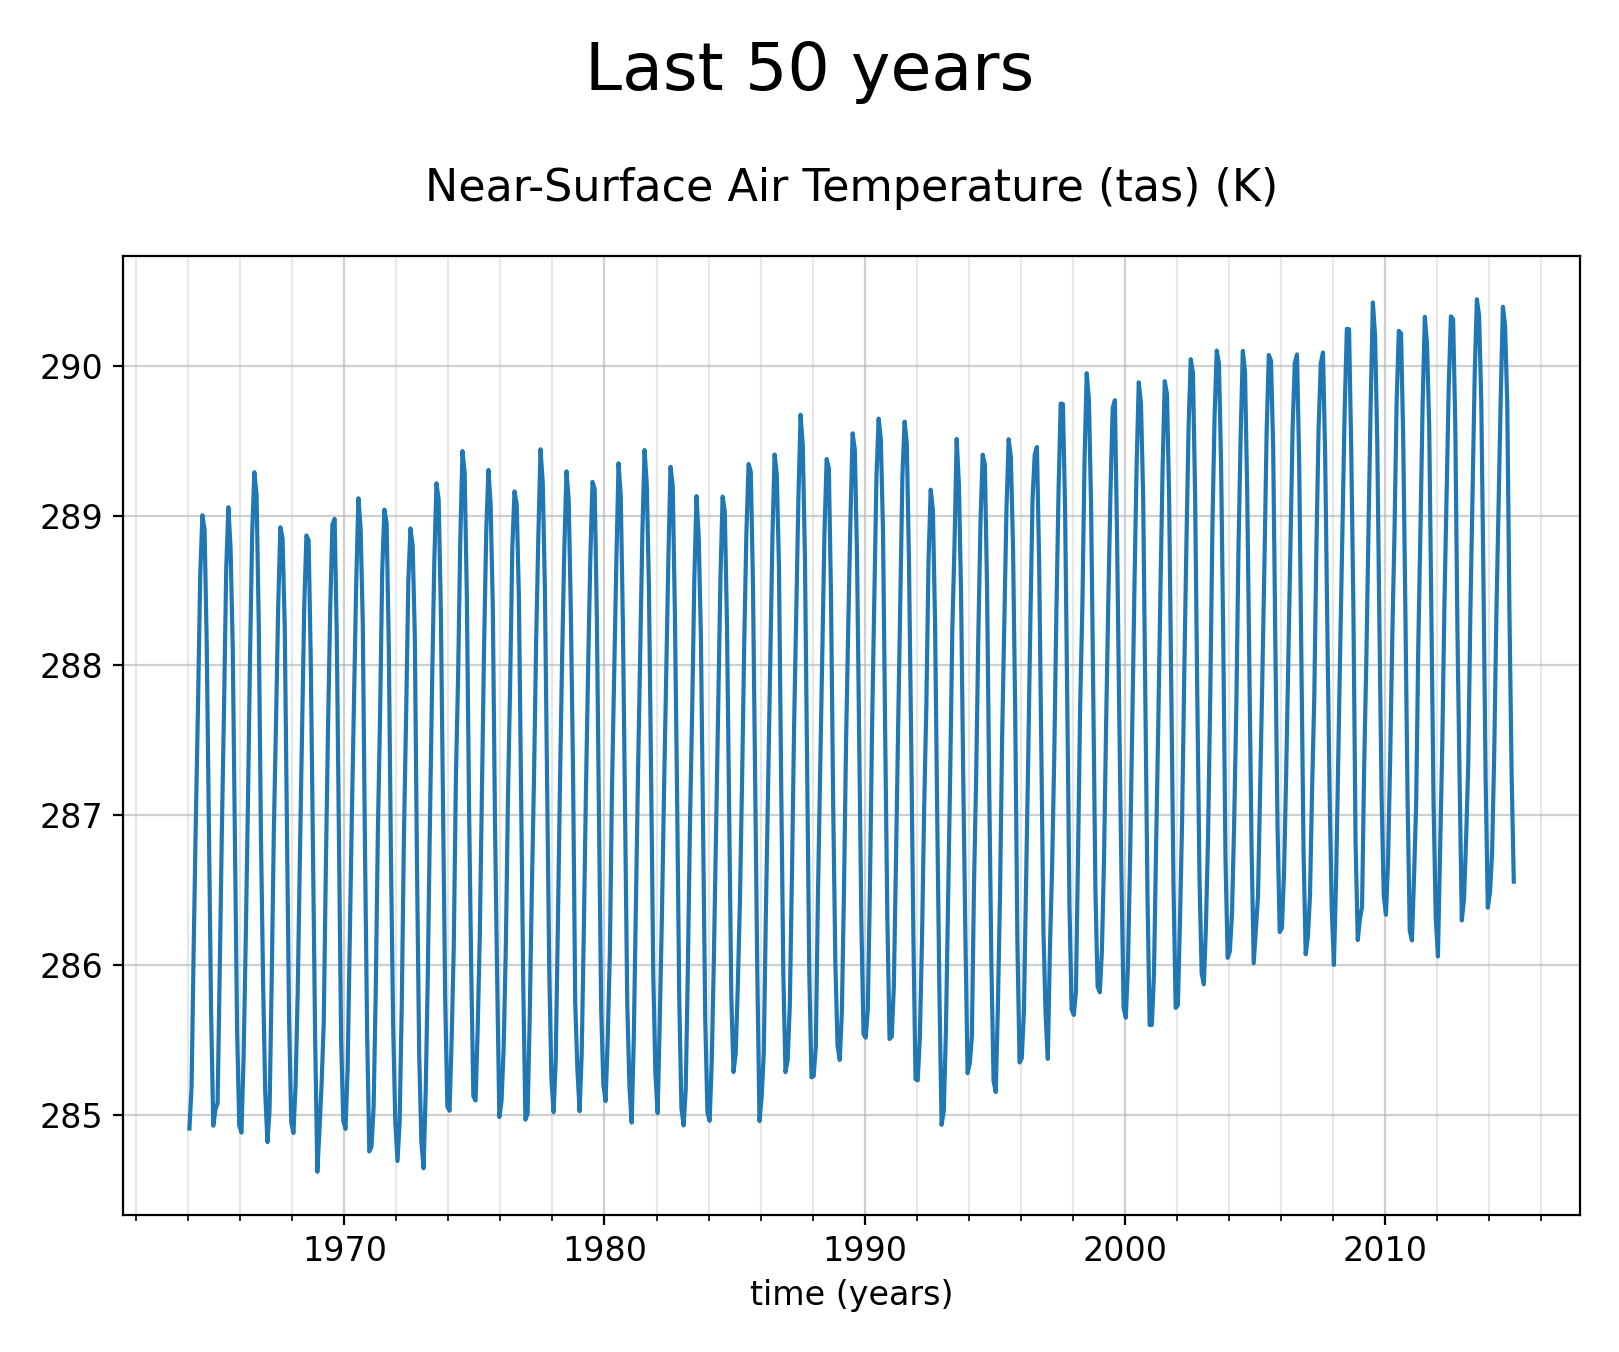
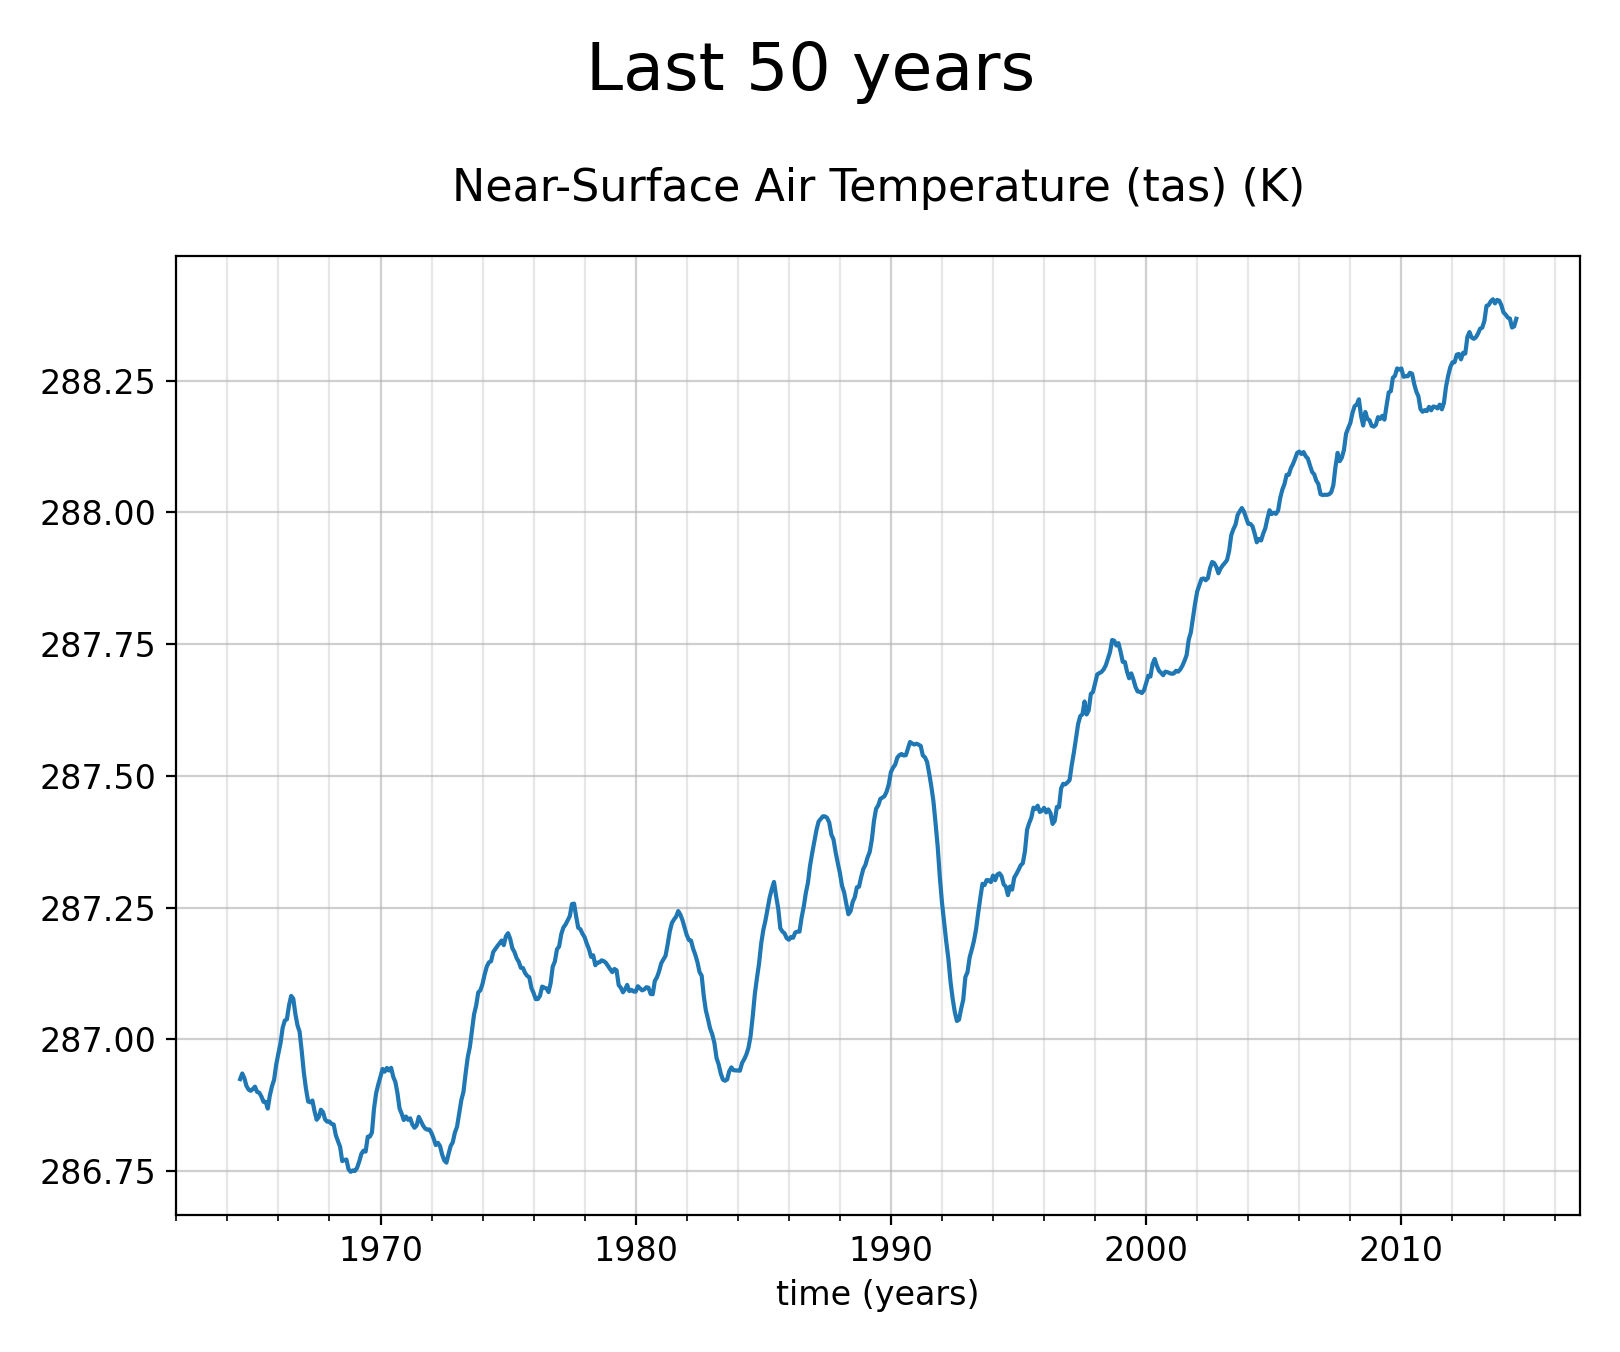
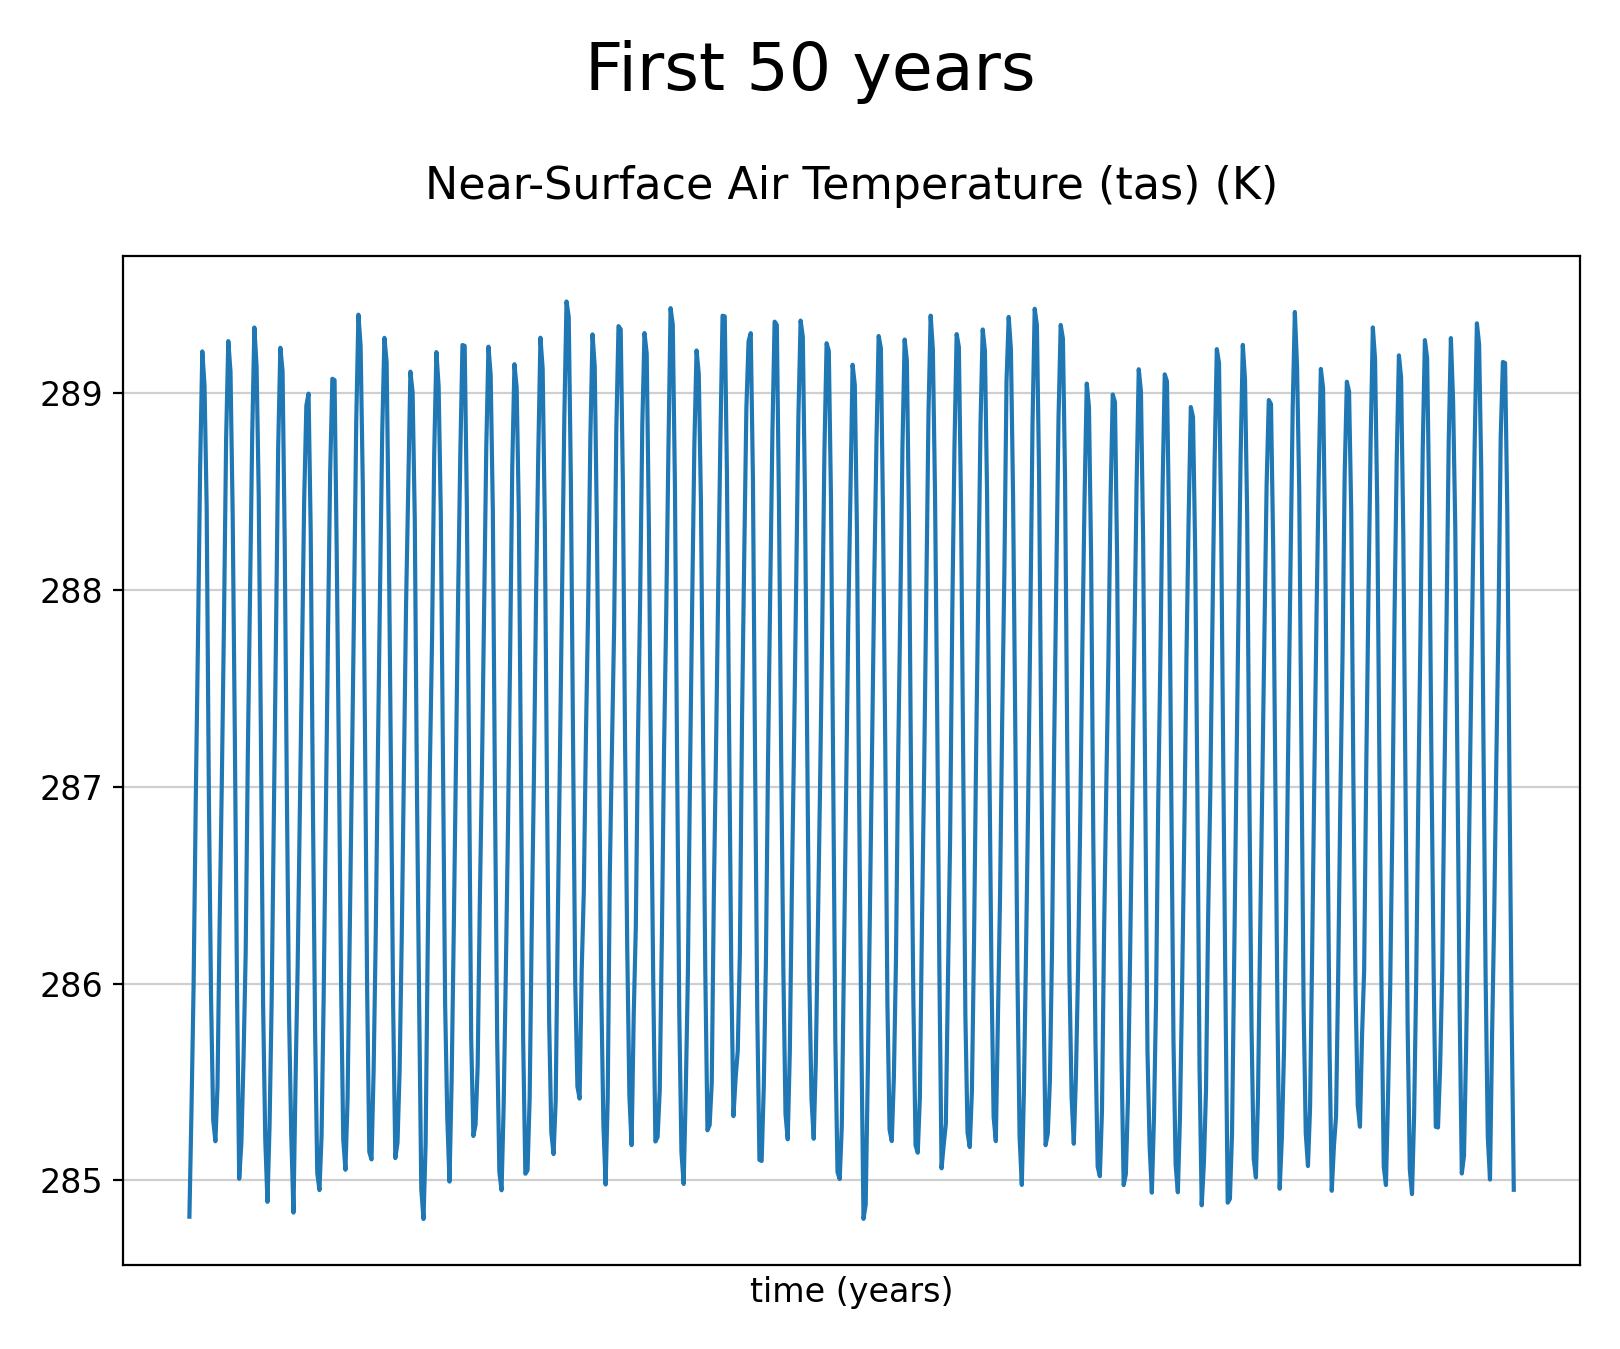
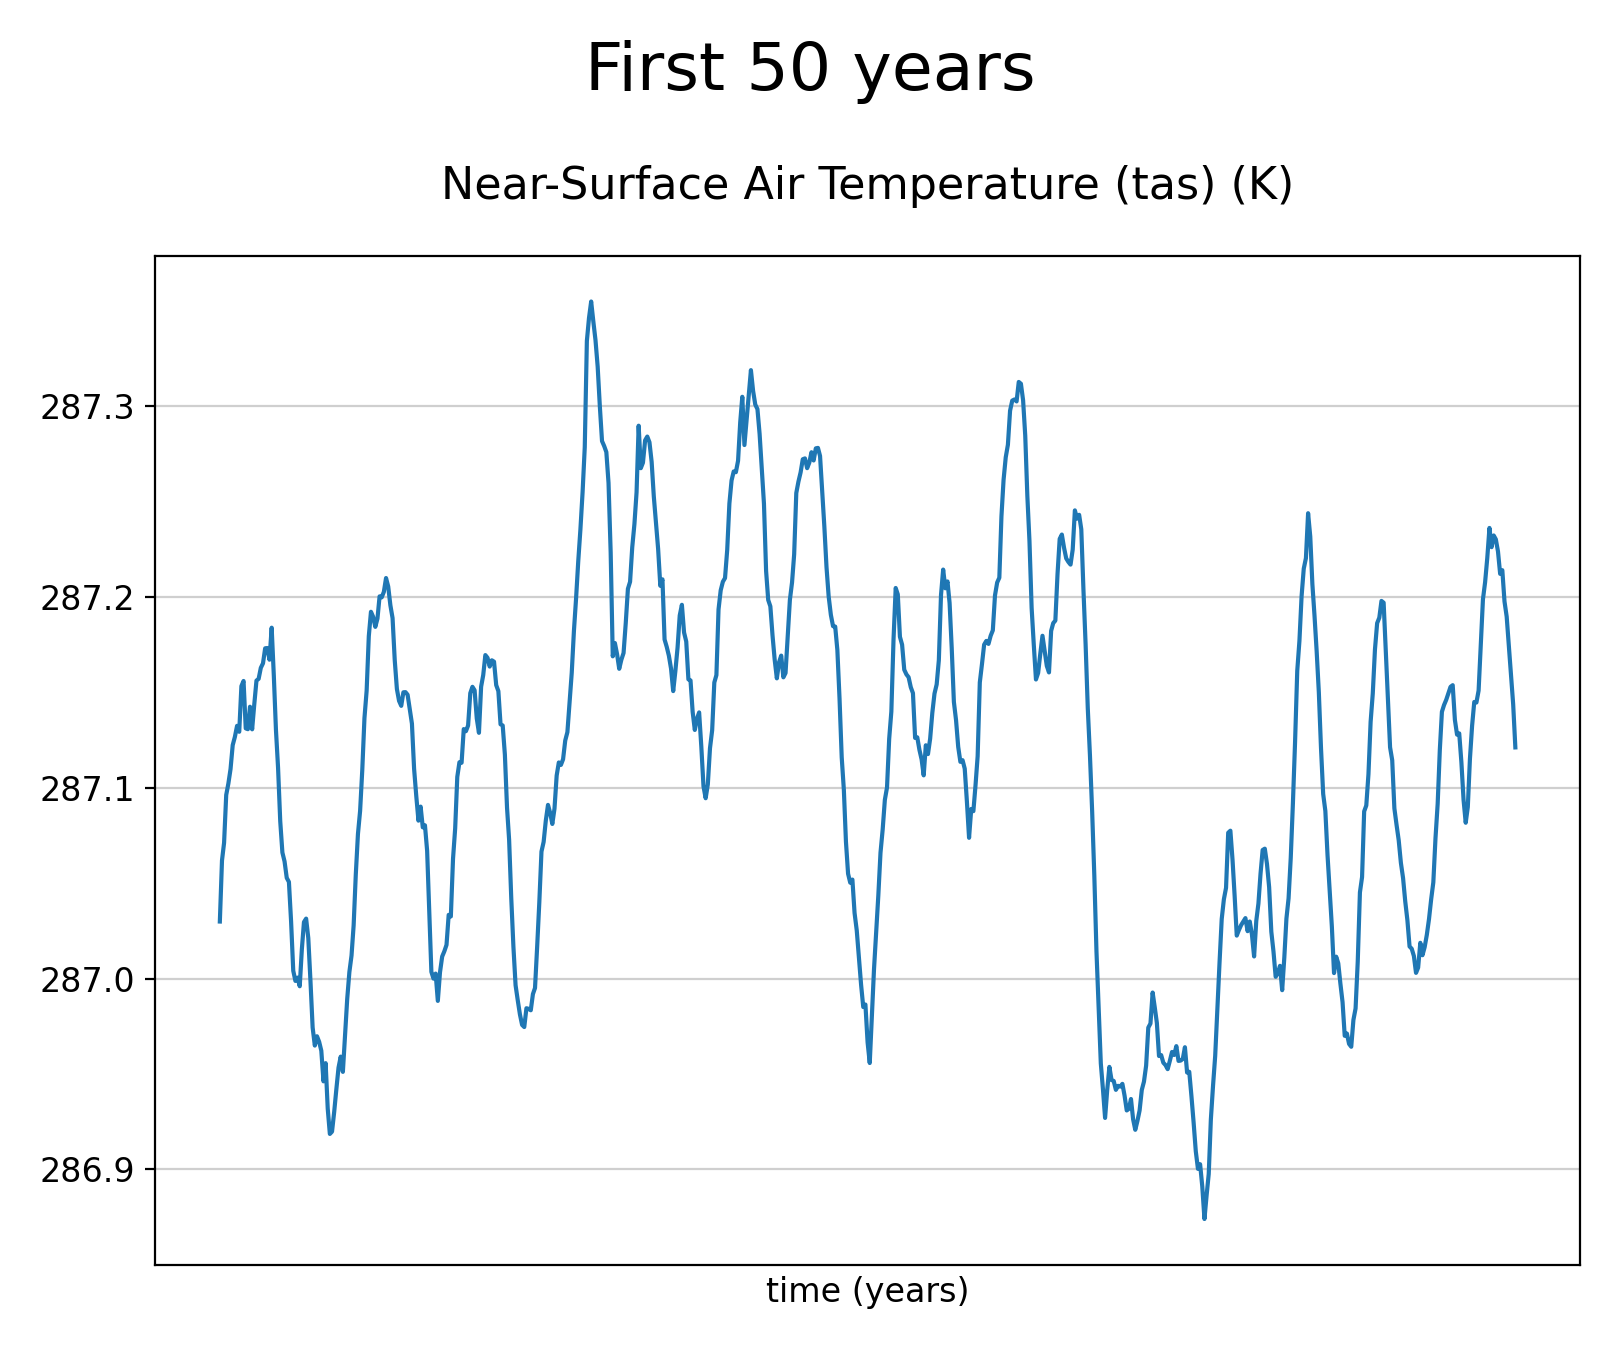
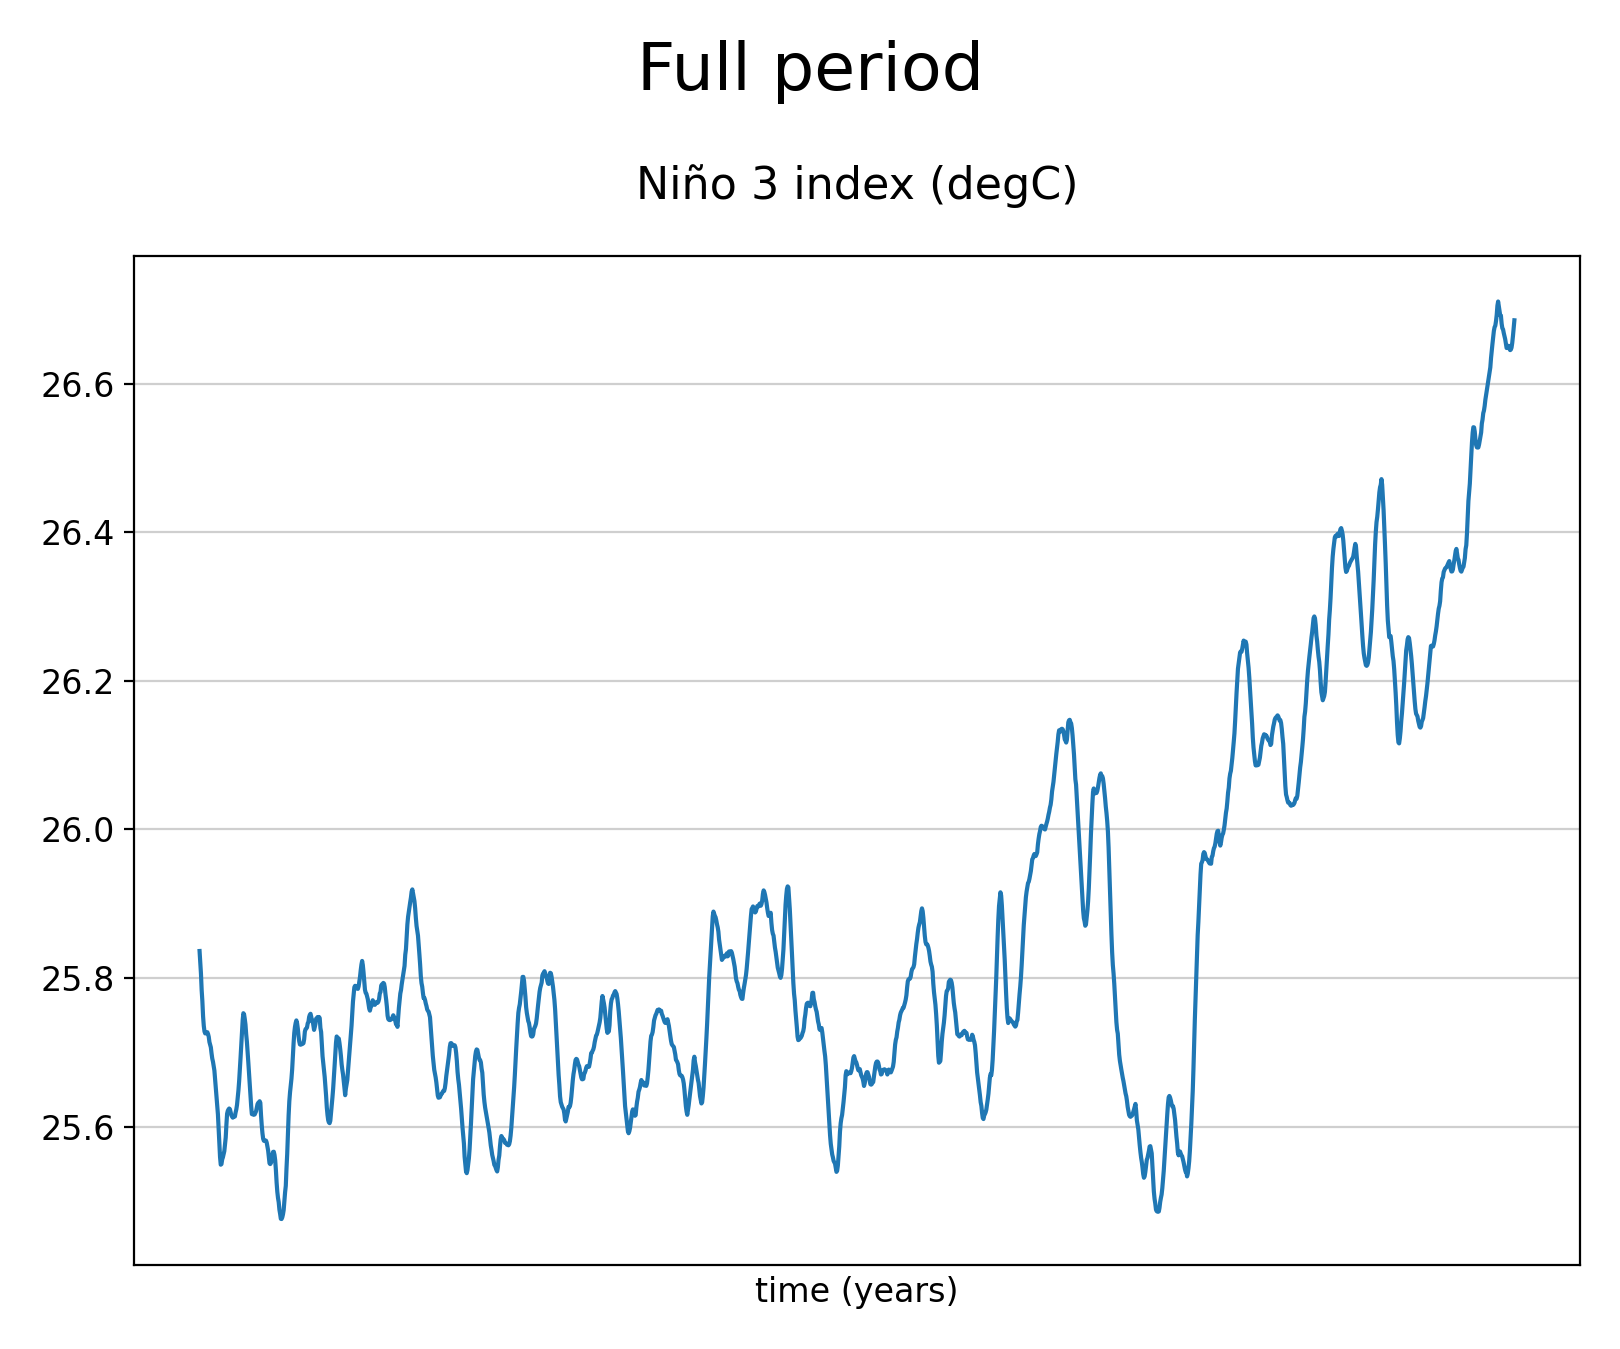
Plot time series
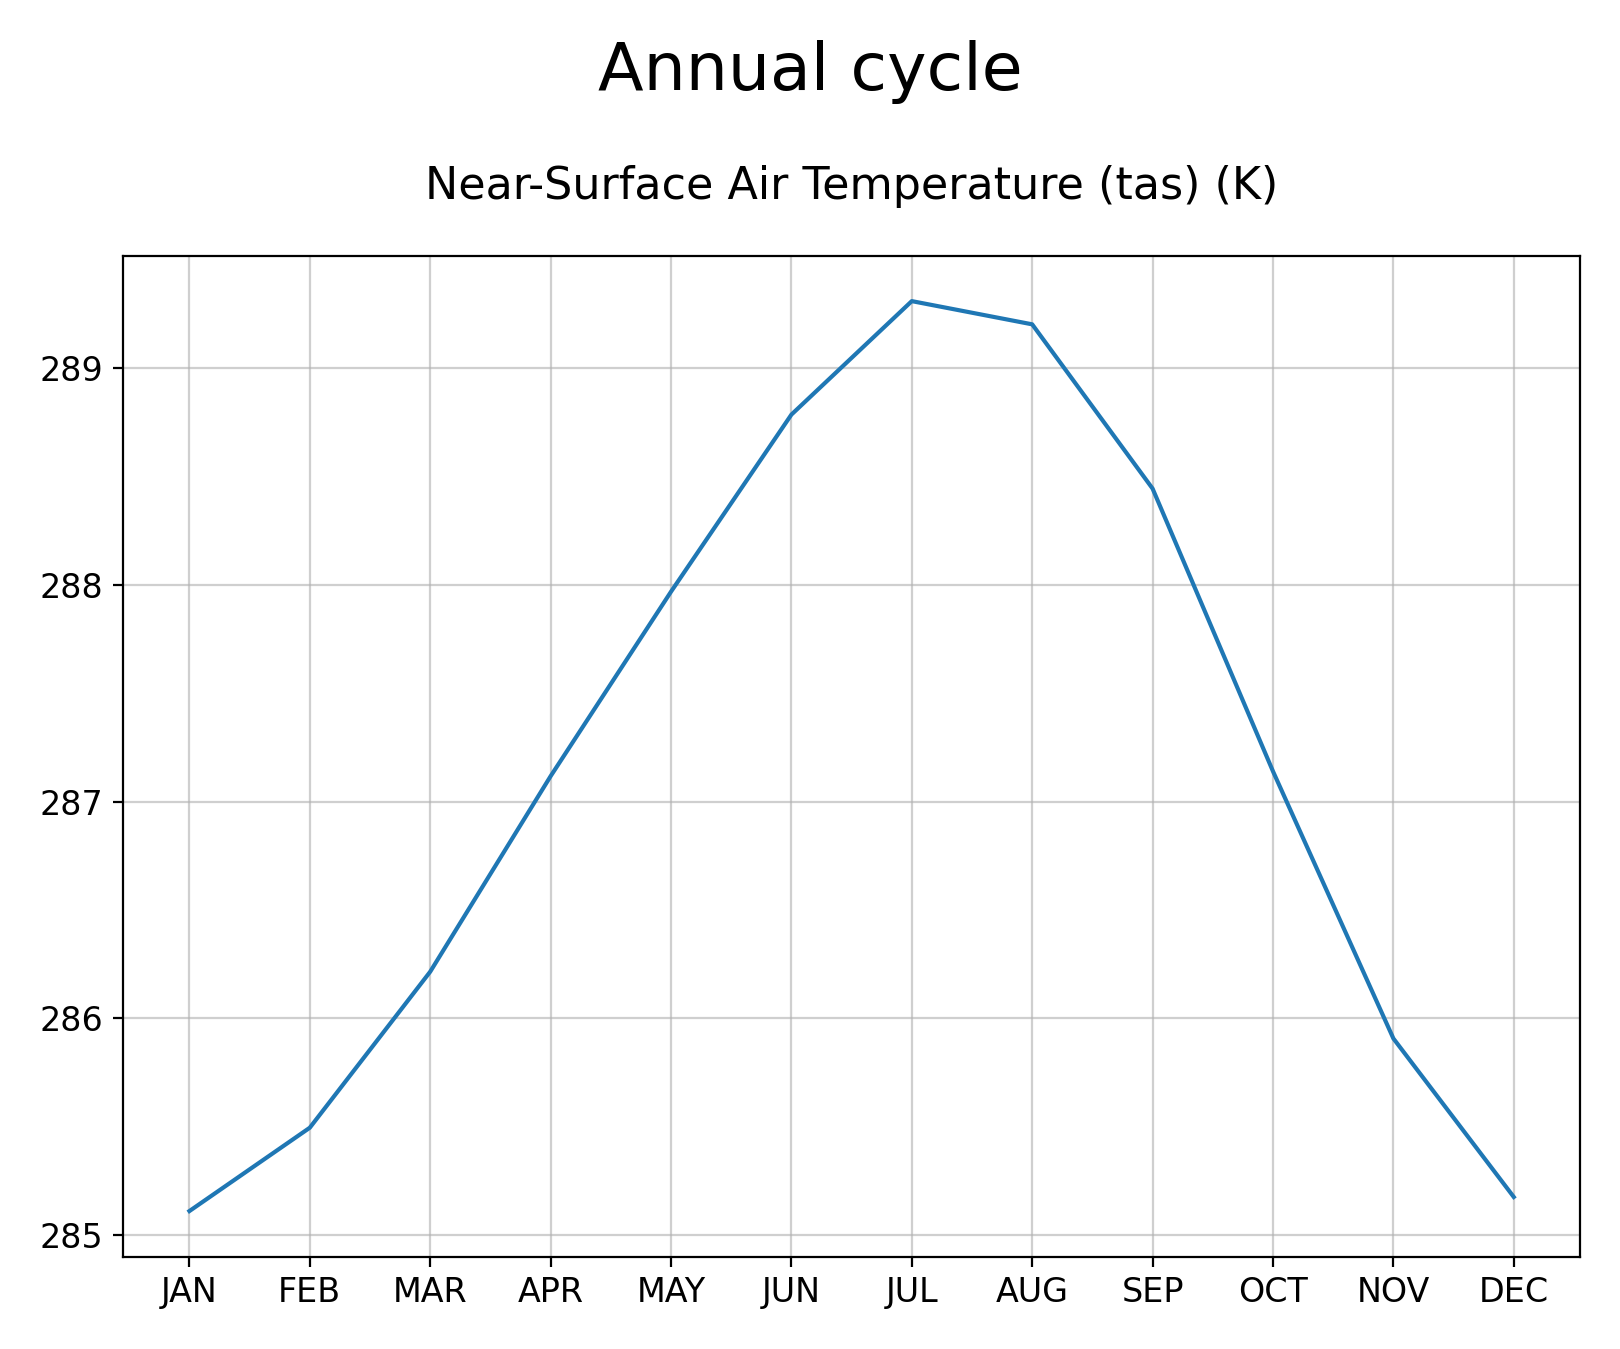
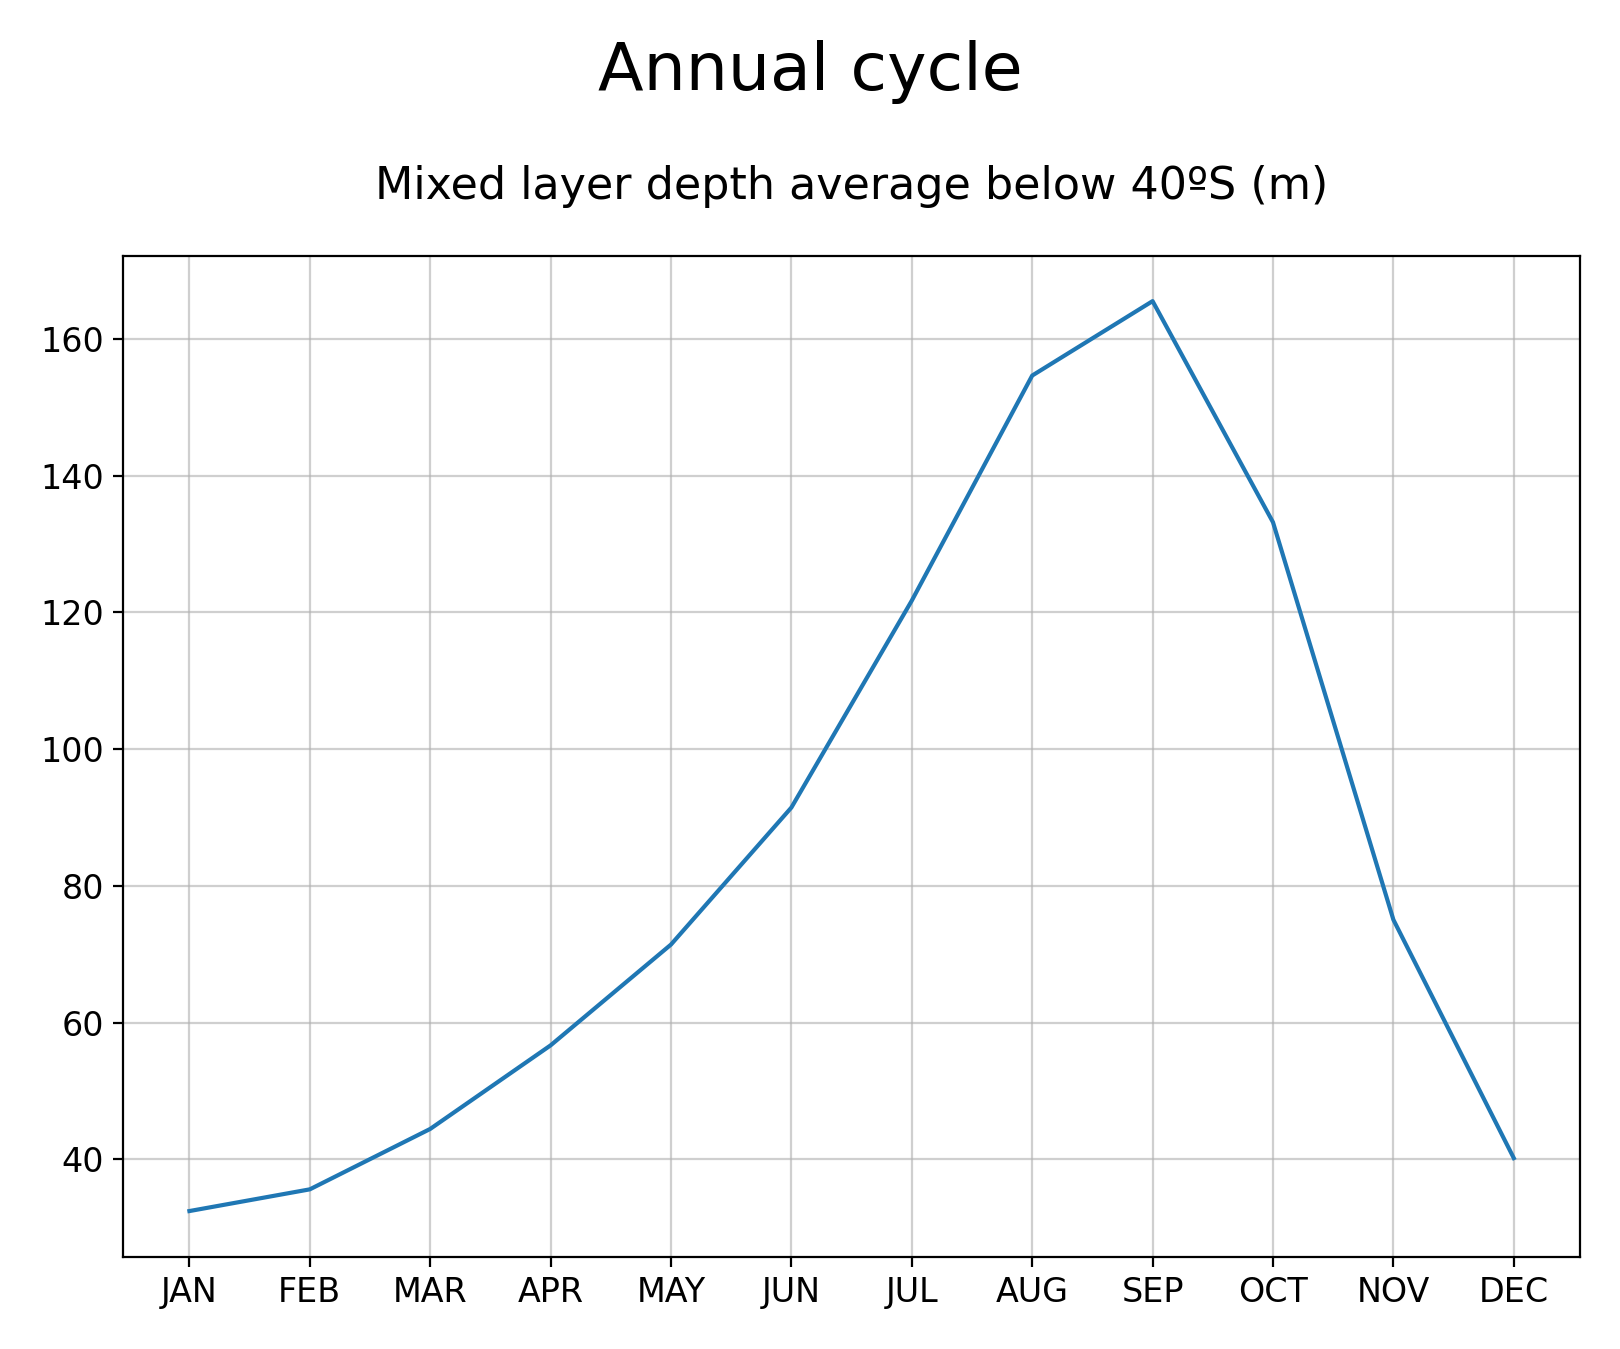
Plot annual cycles
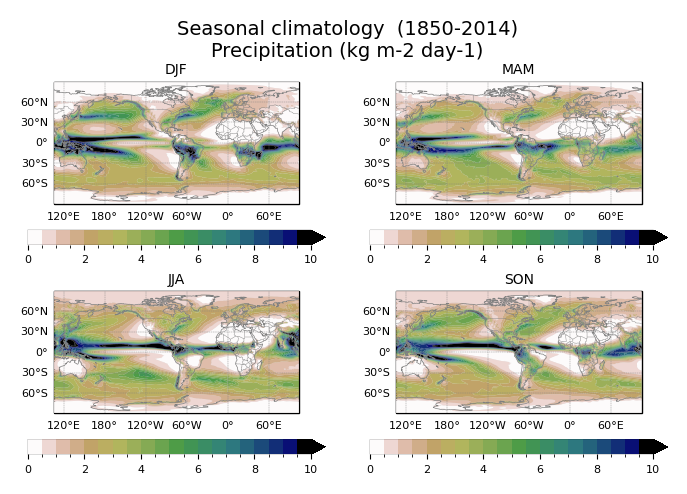
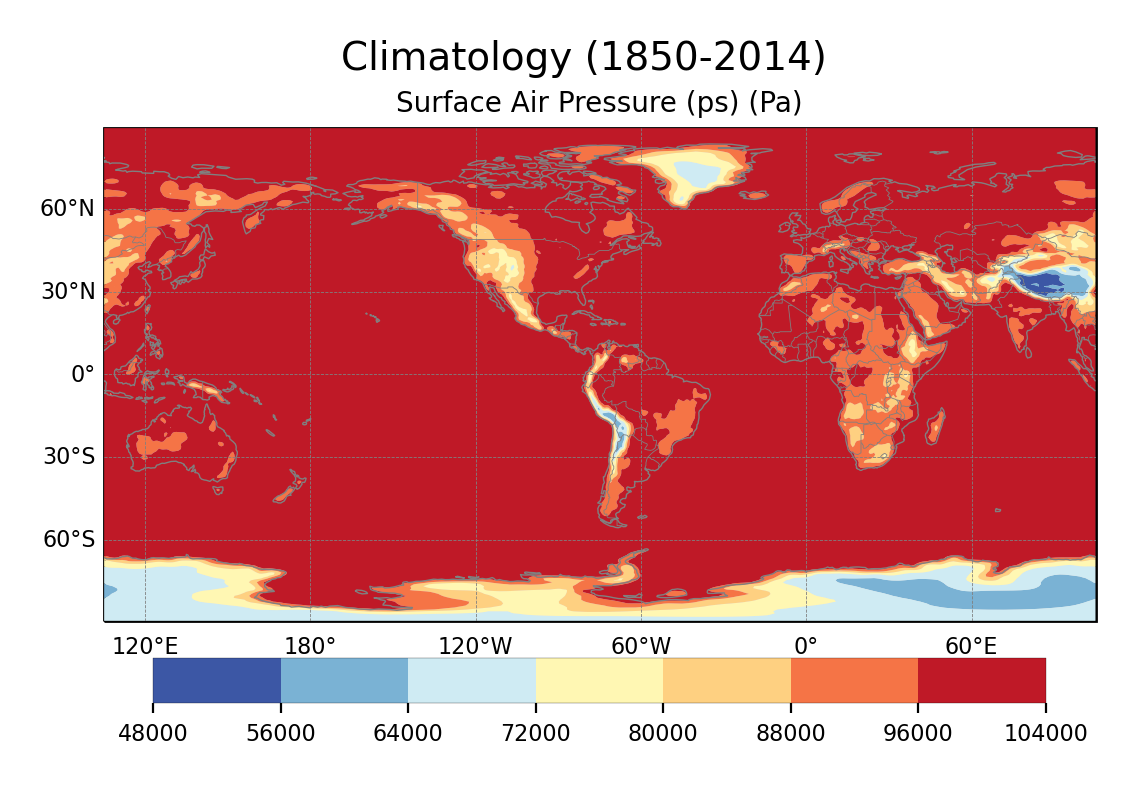
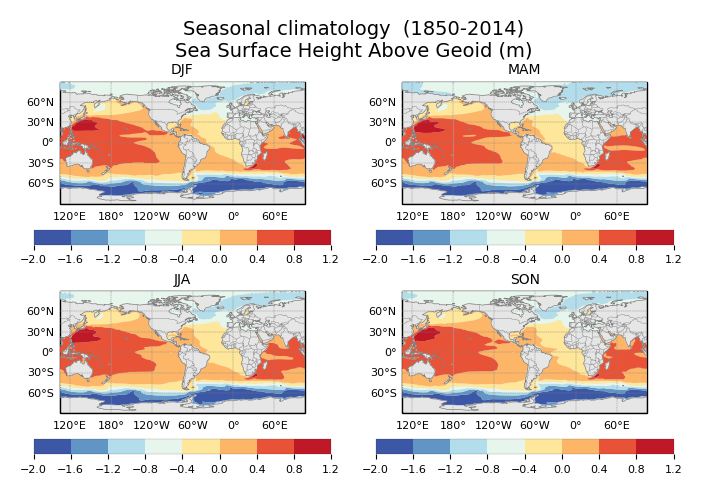
Plot map data
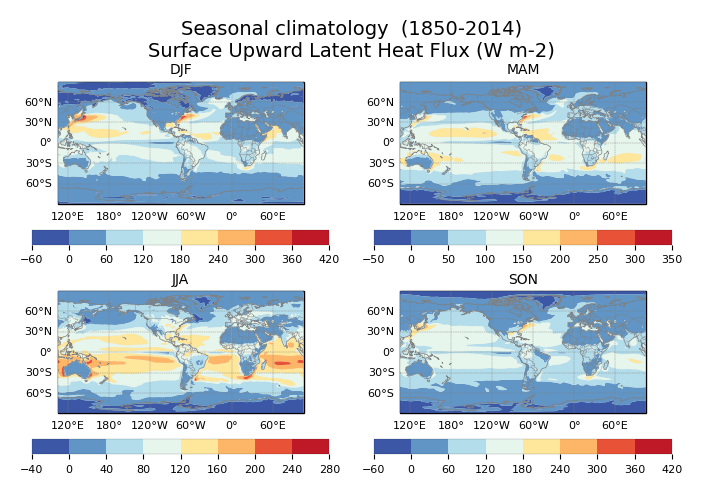
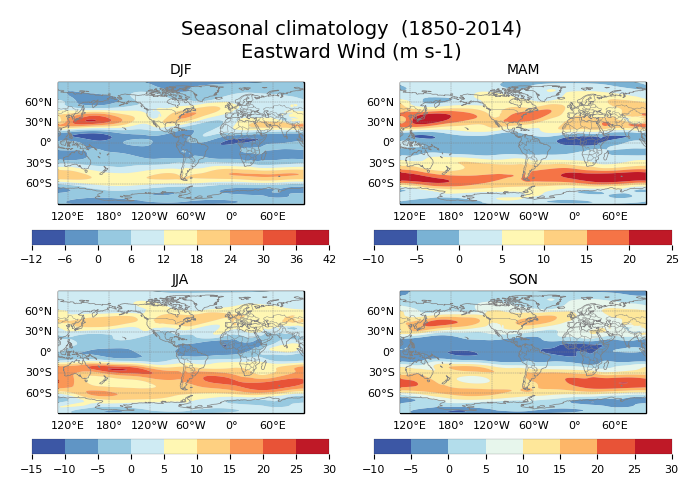
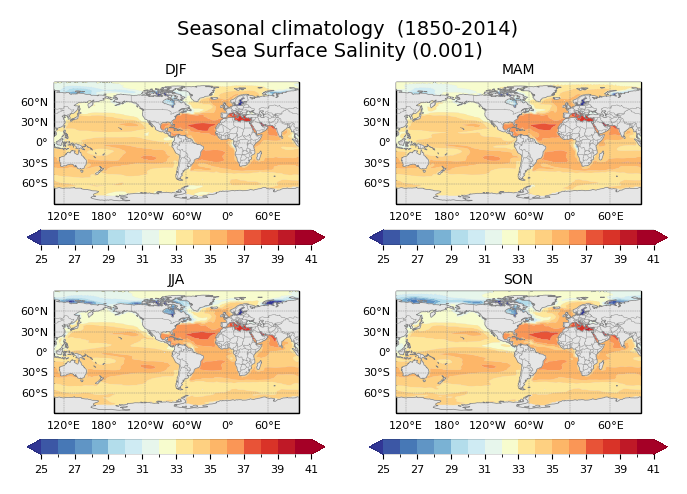
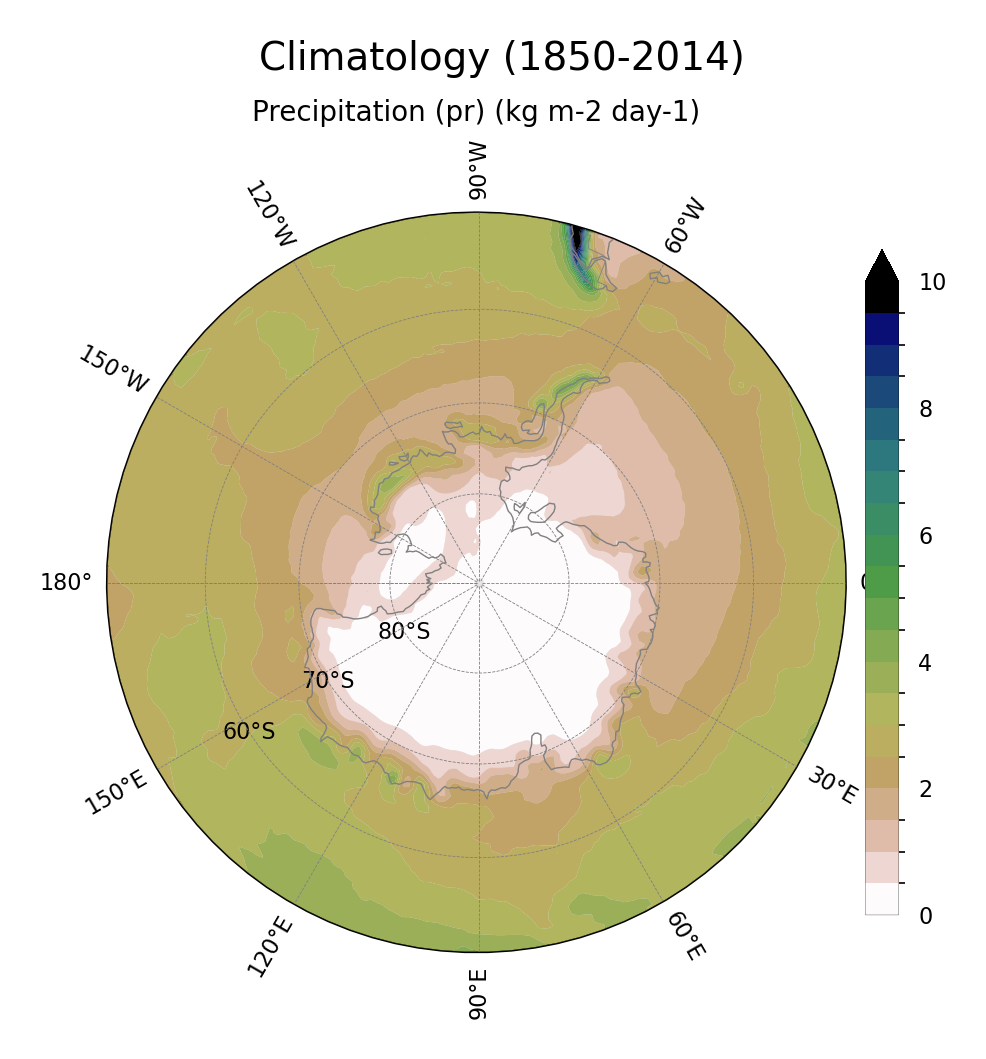
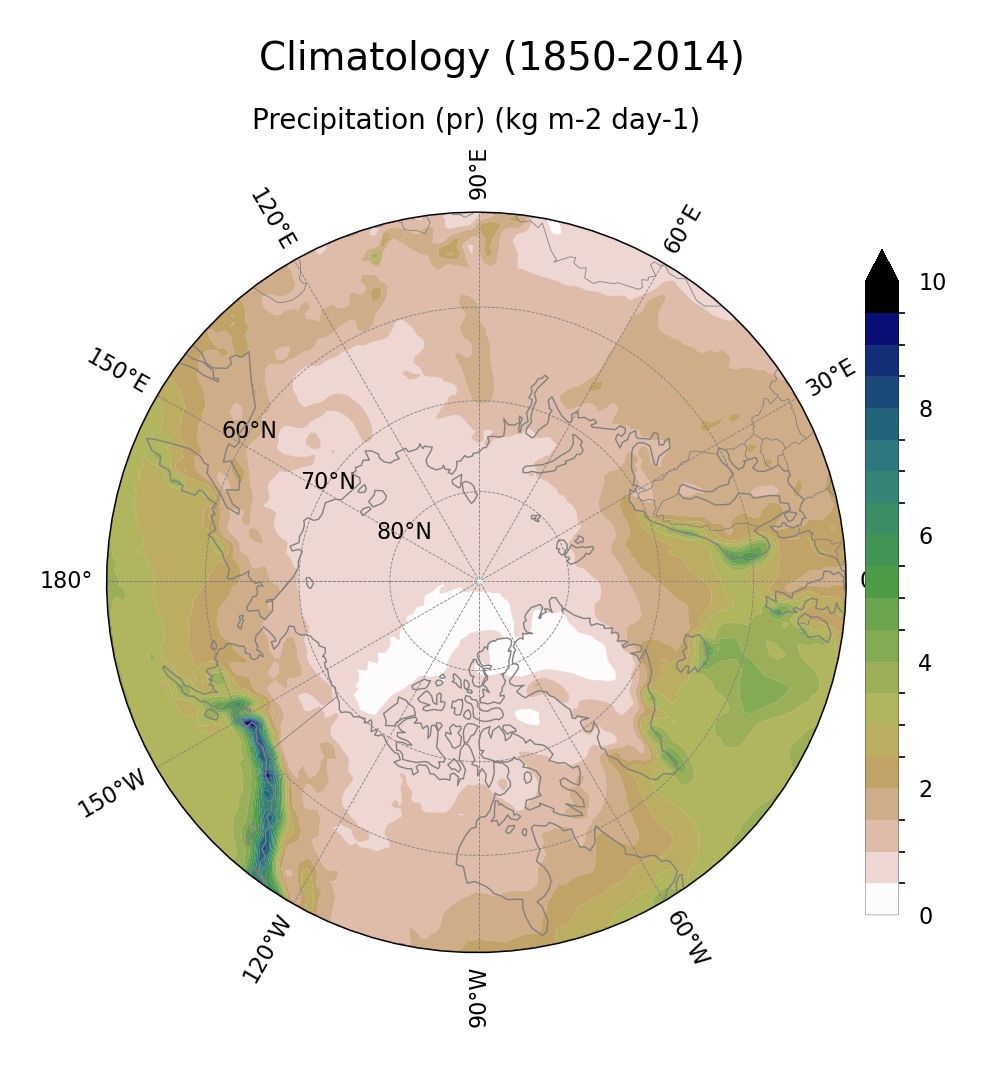
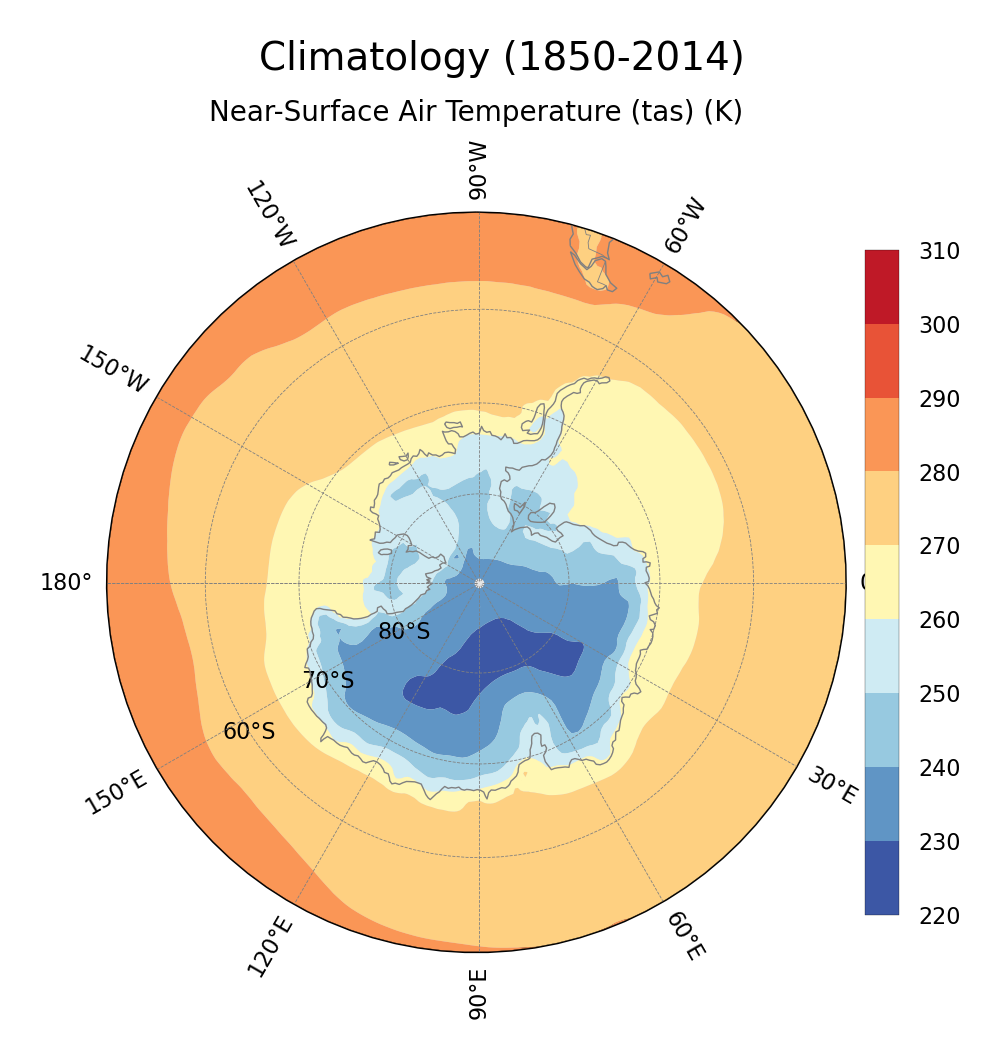
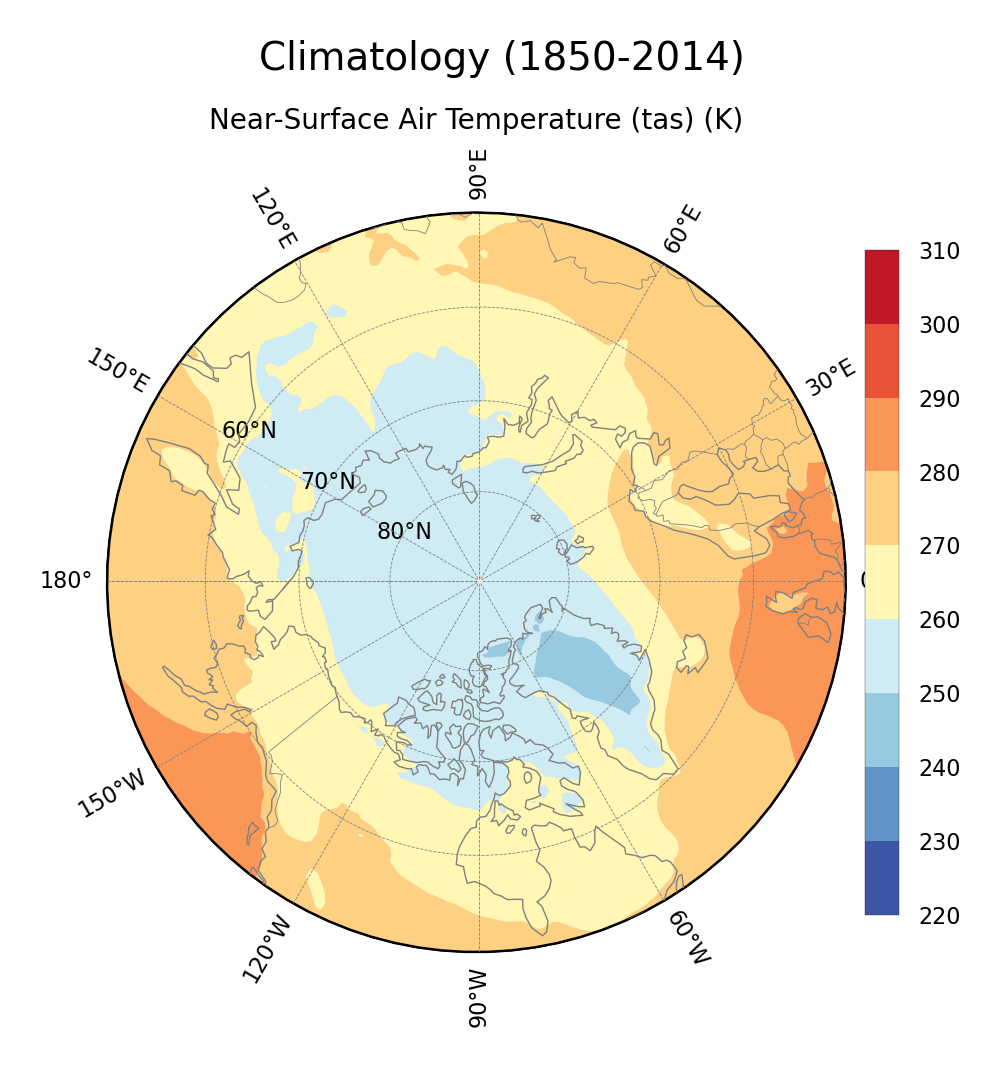
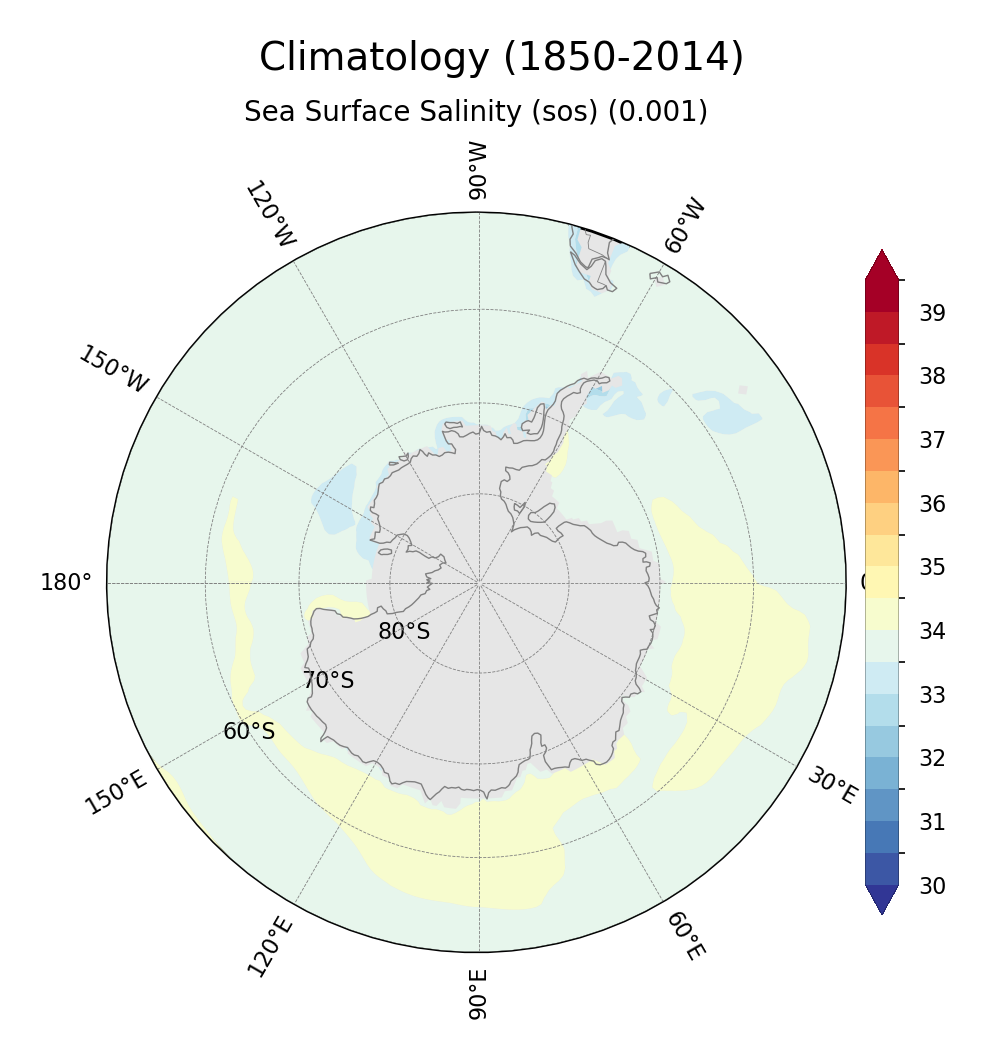
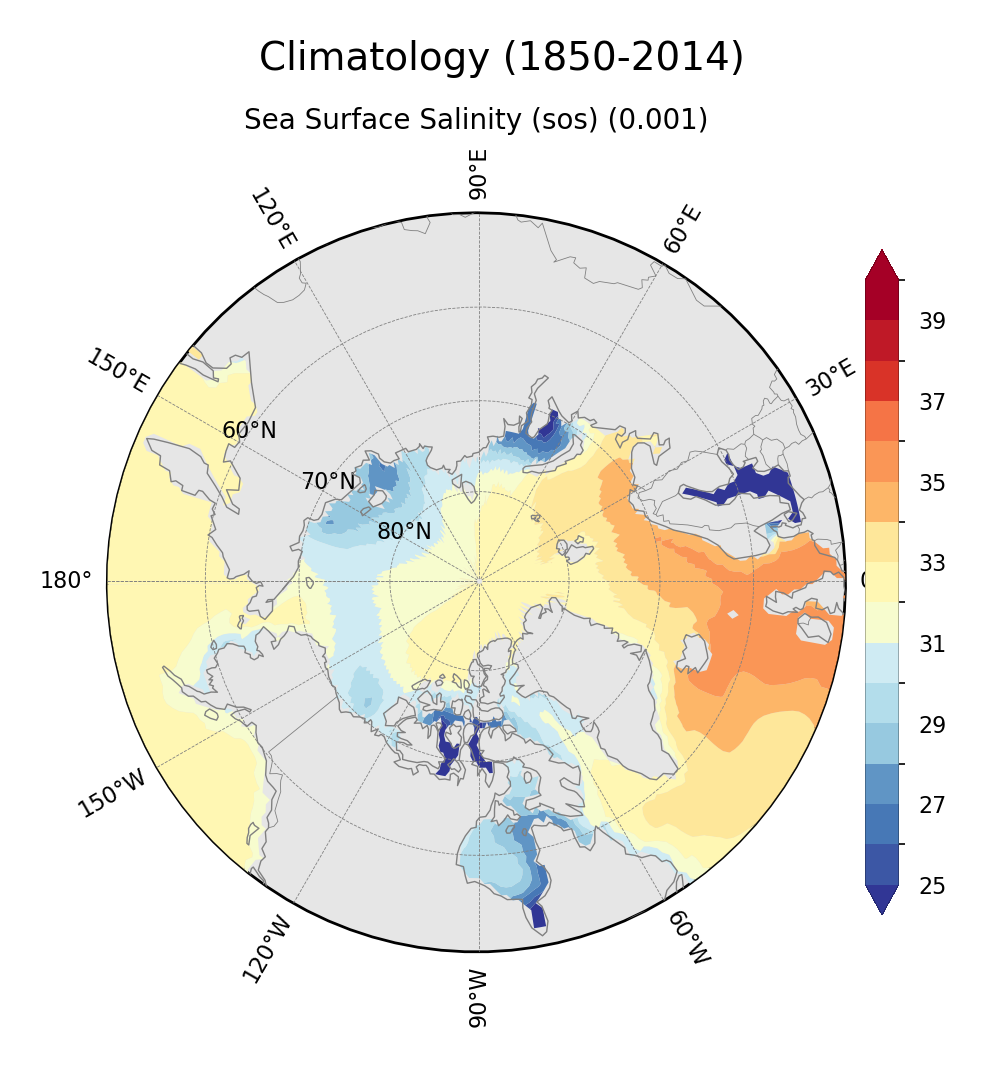
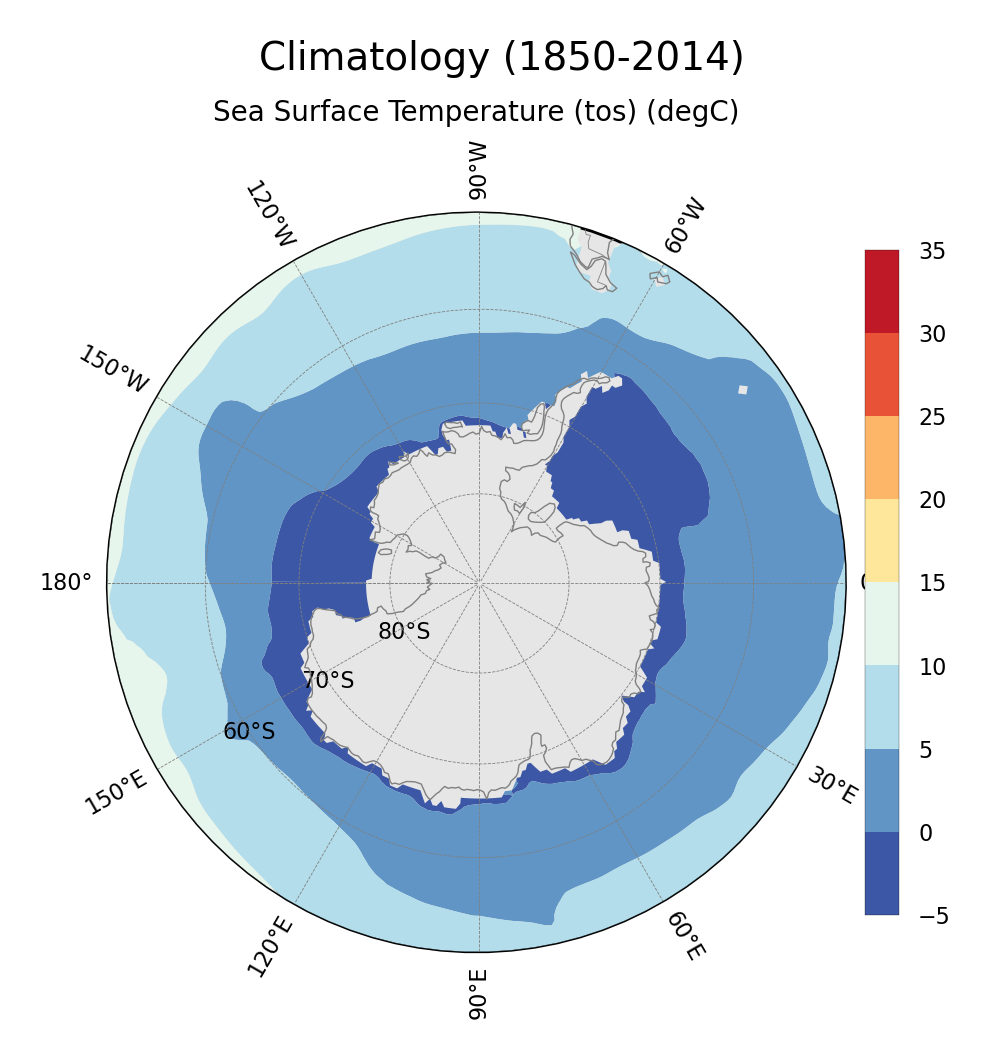
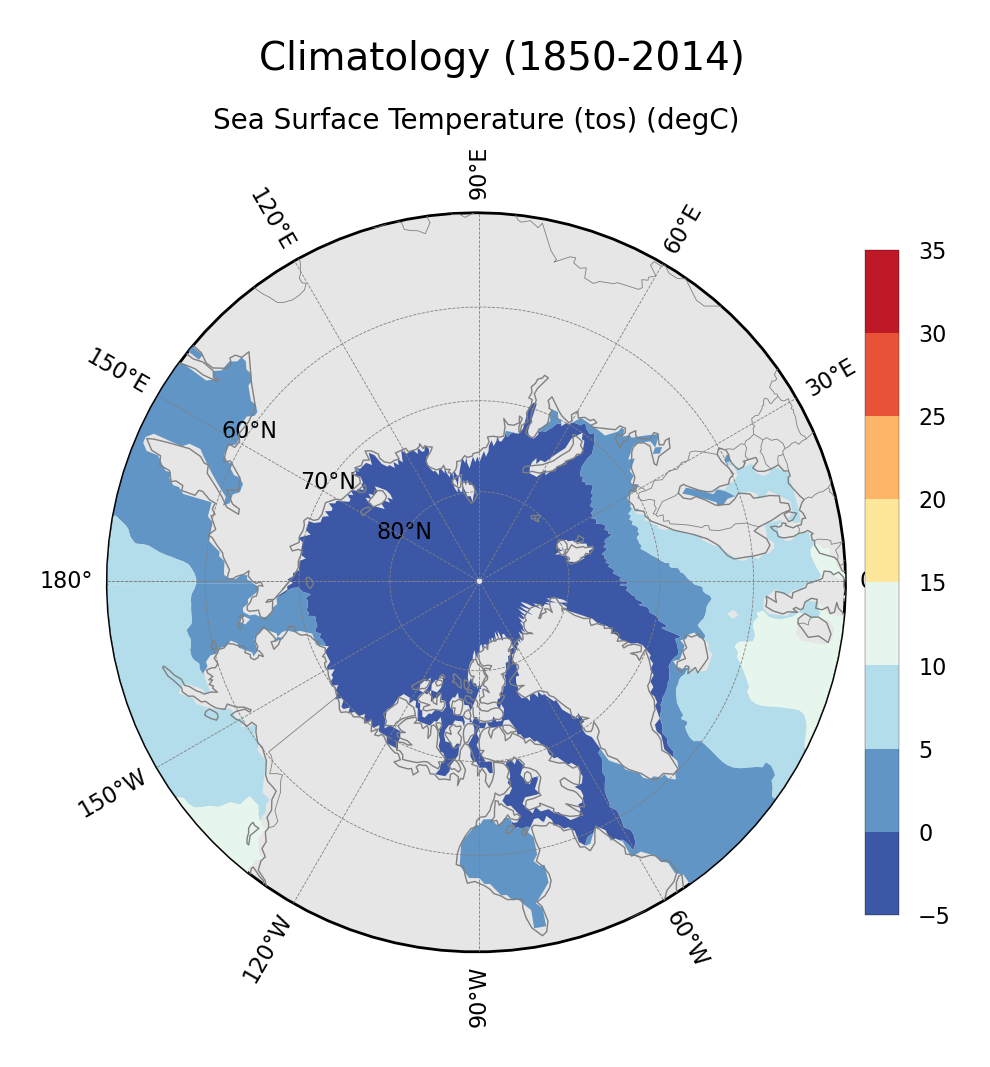
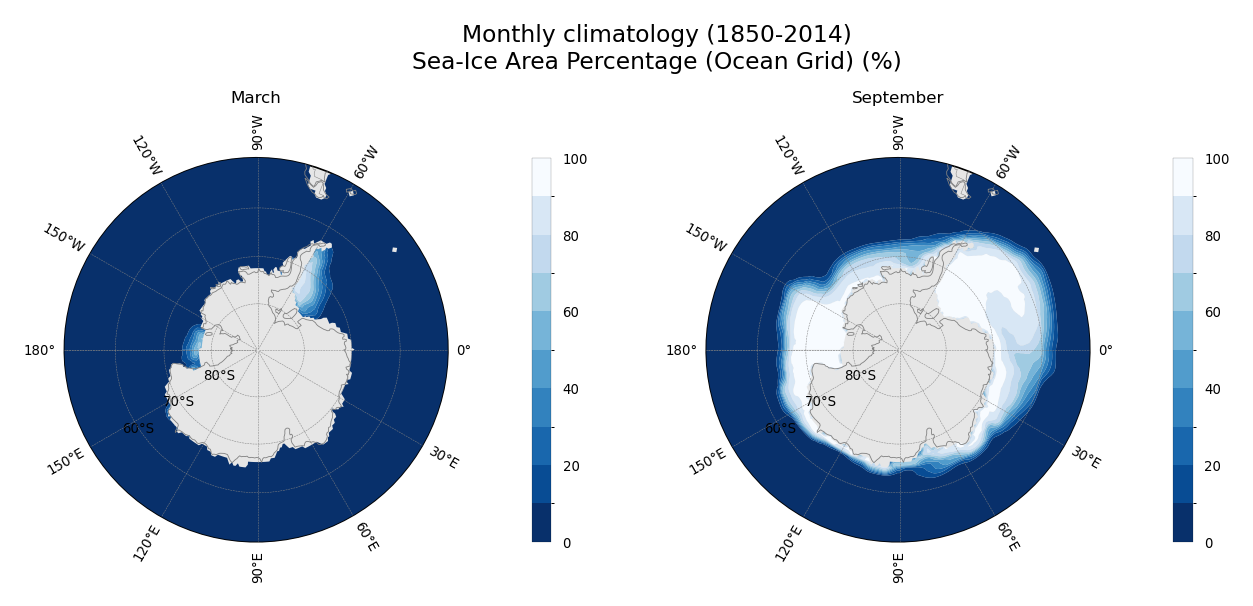
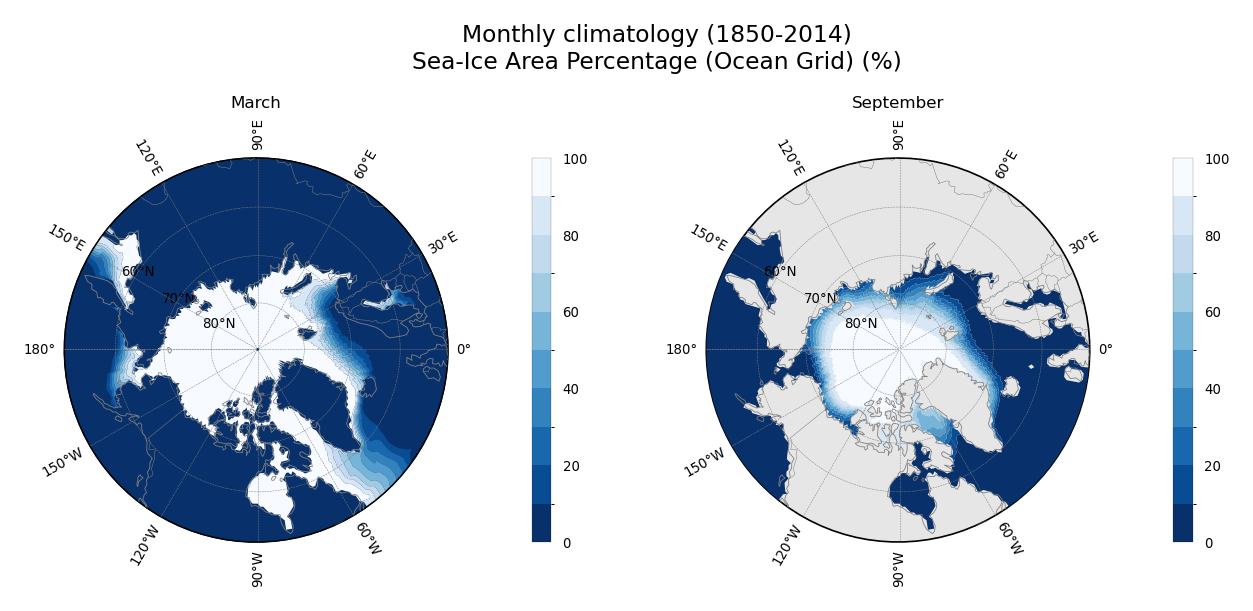
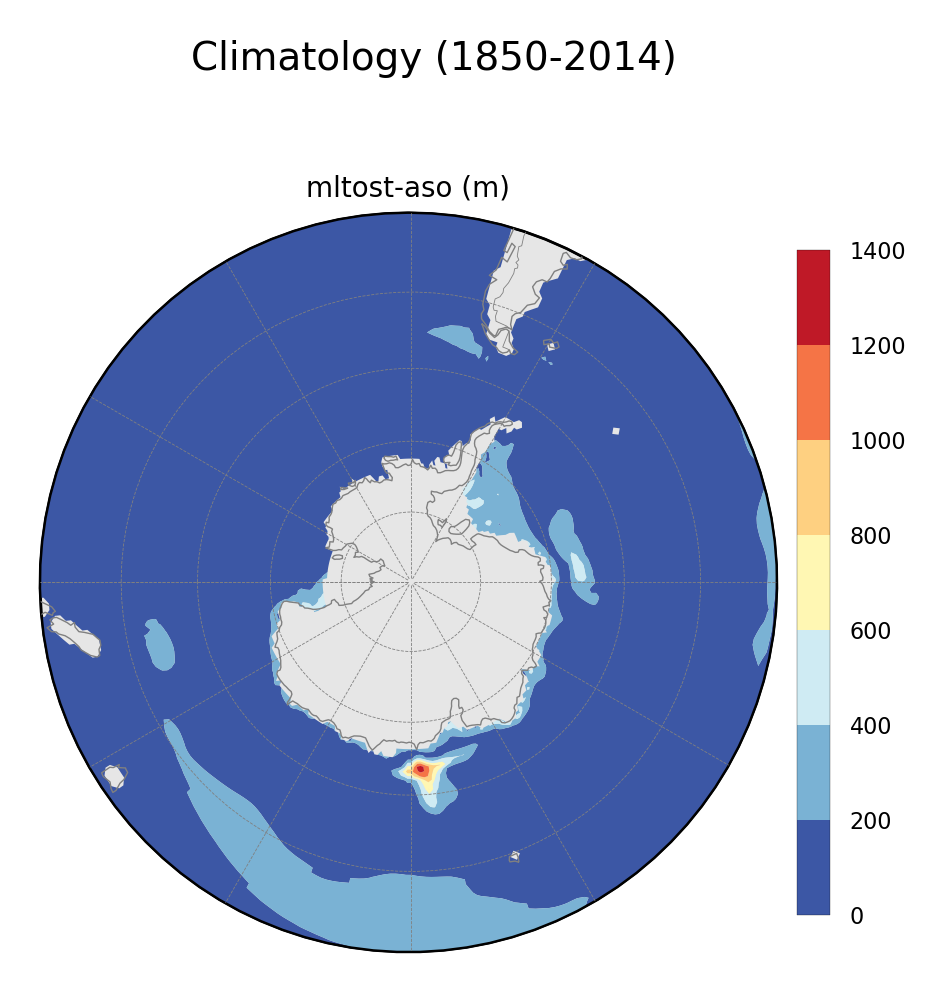
Plot climatologies on both poles
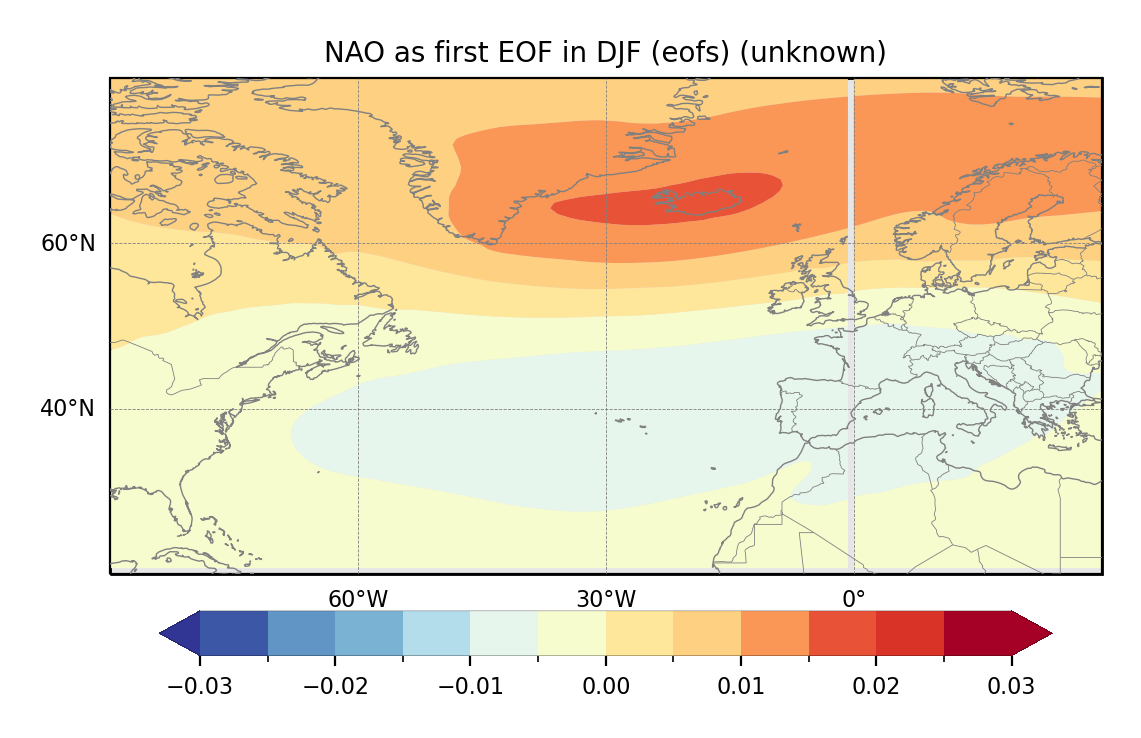
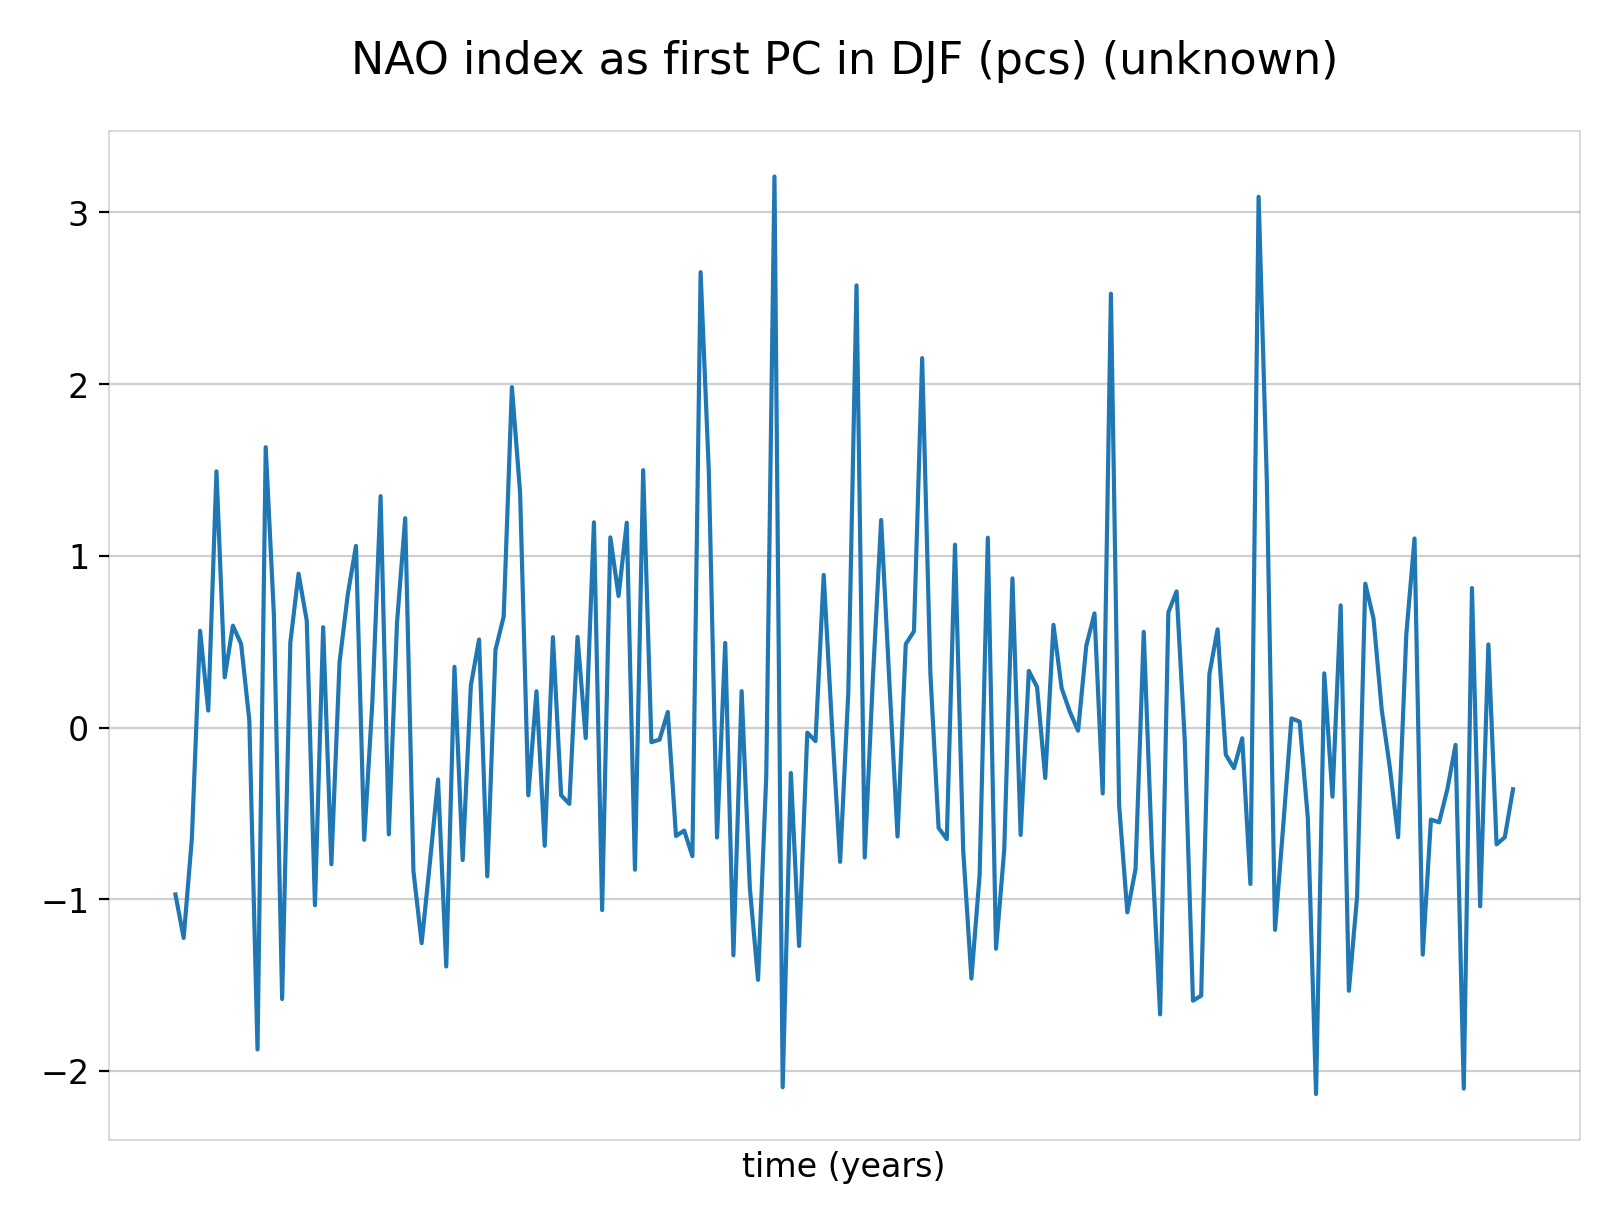
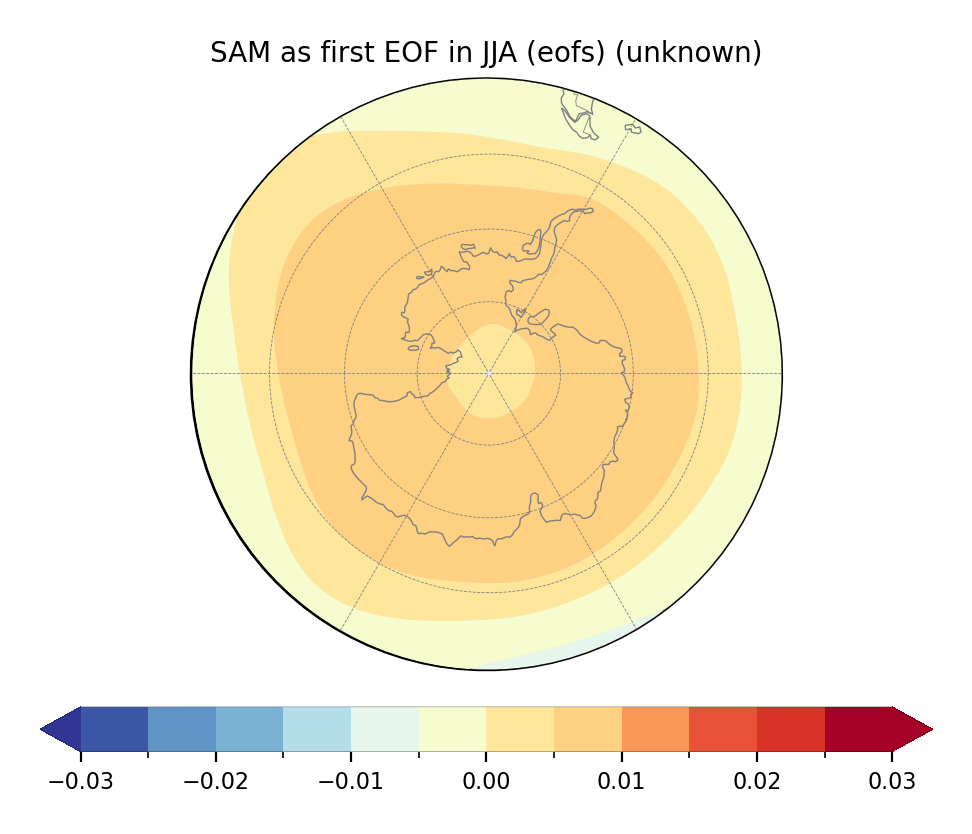
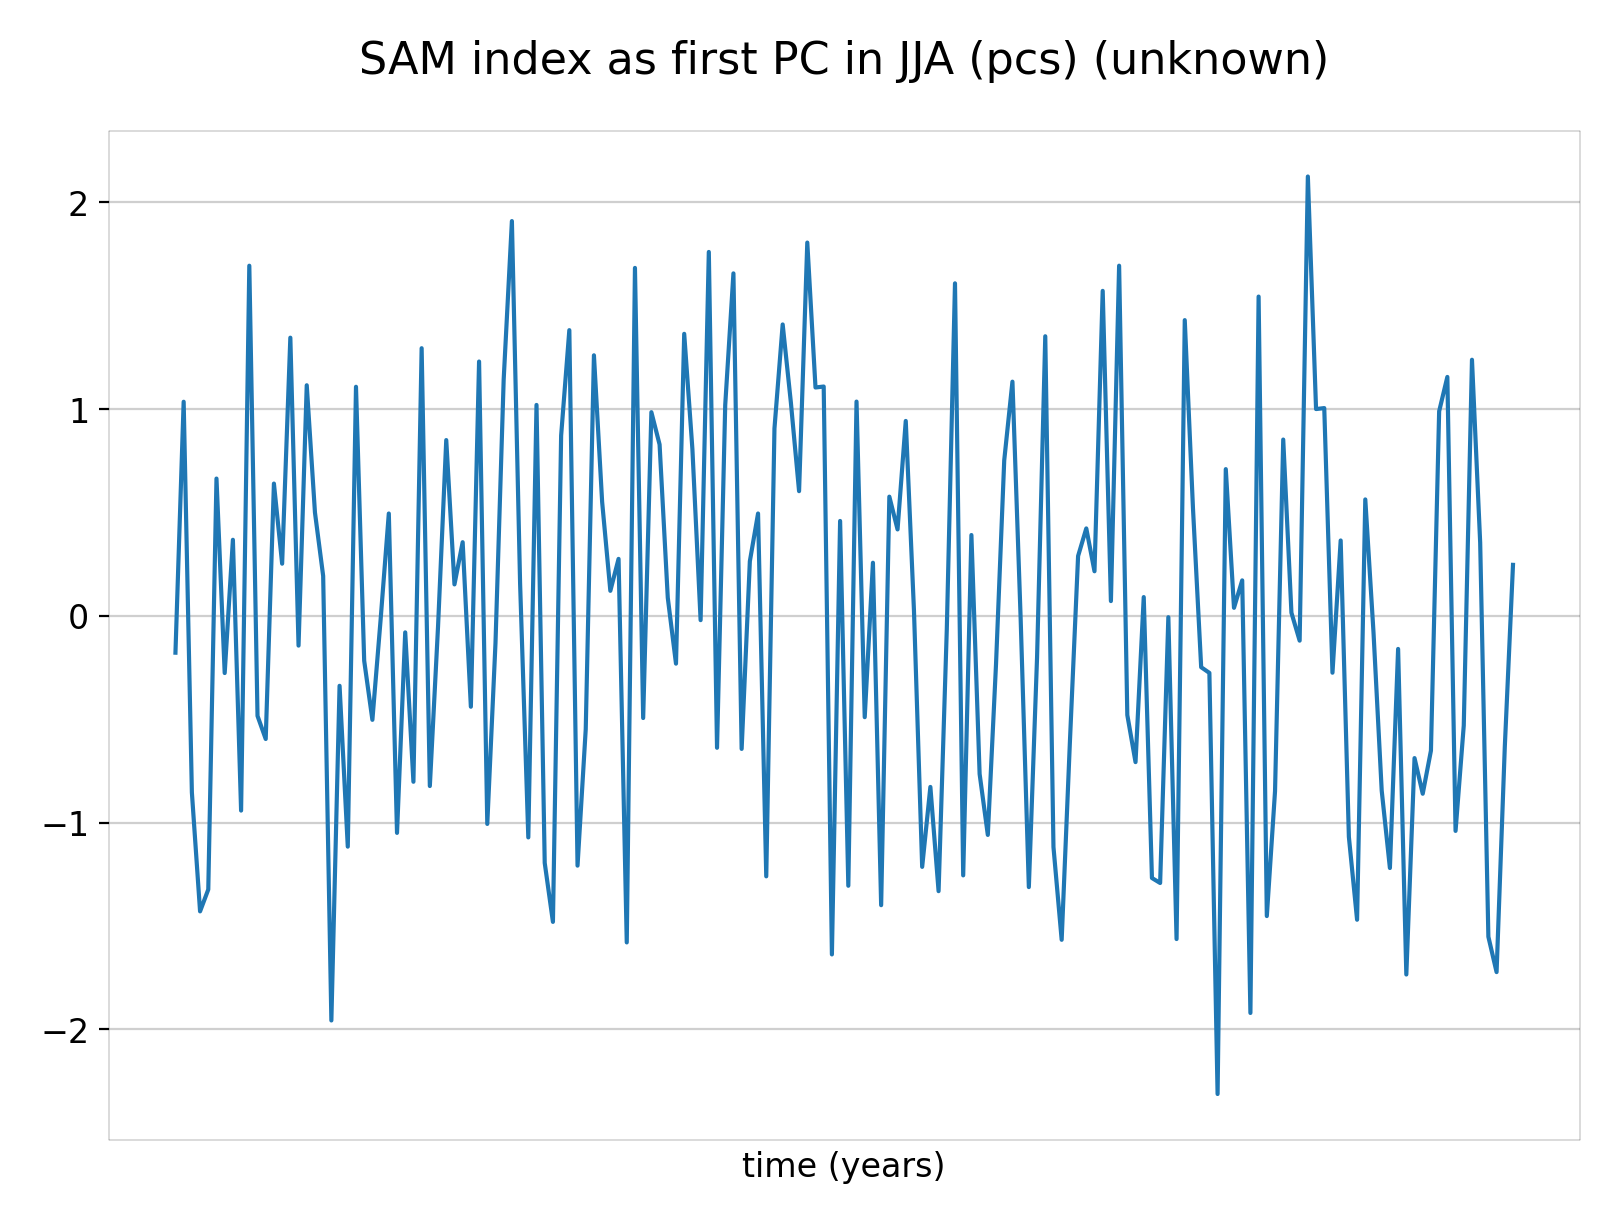
Compute eofs
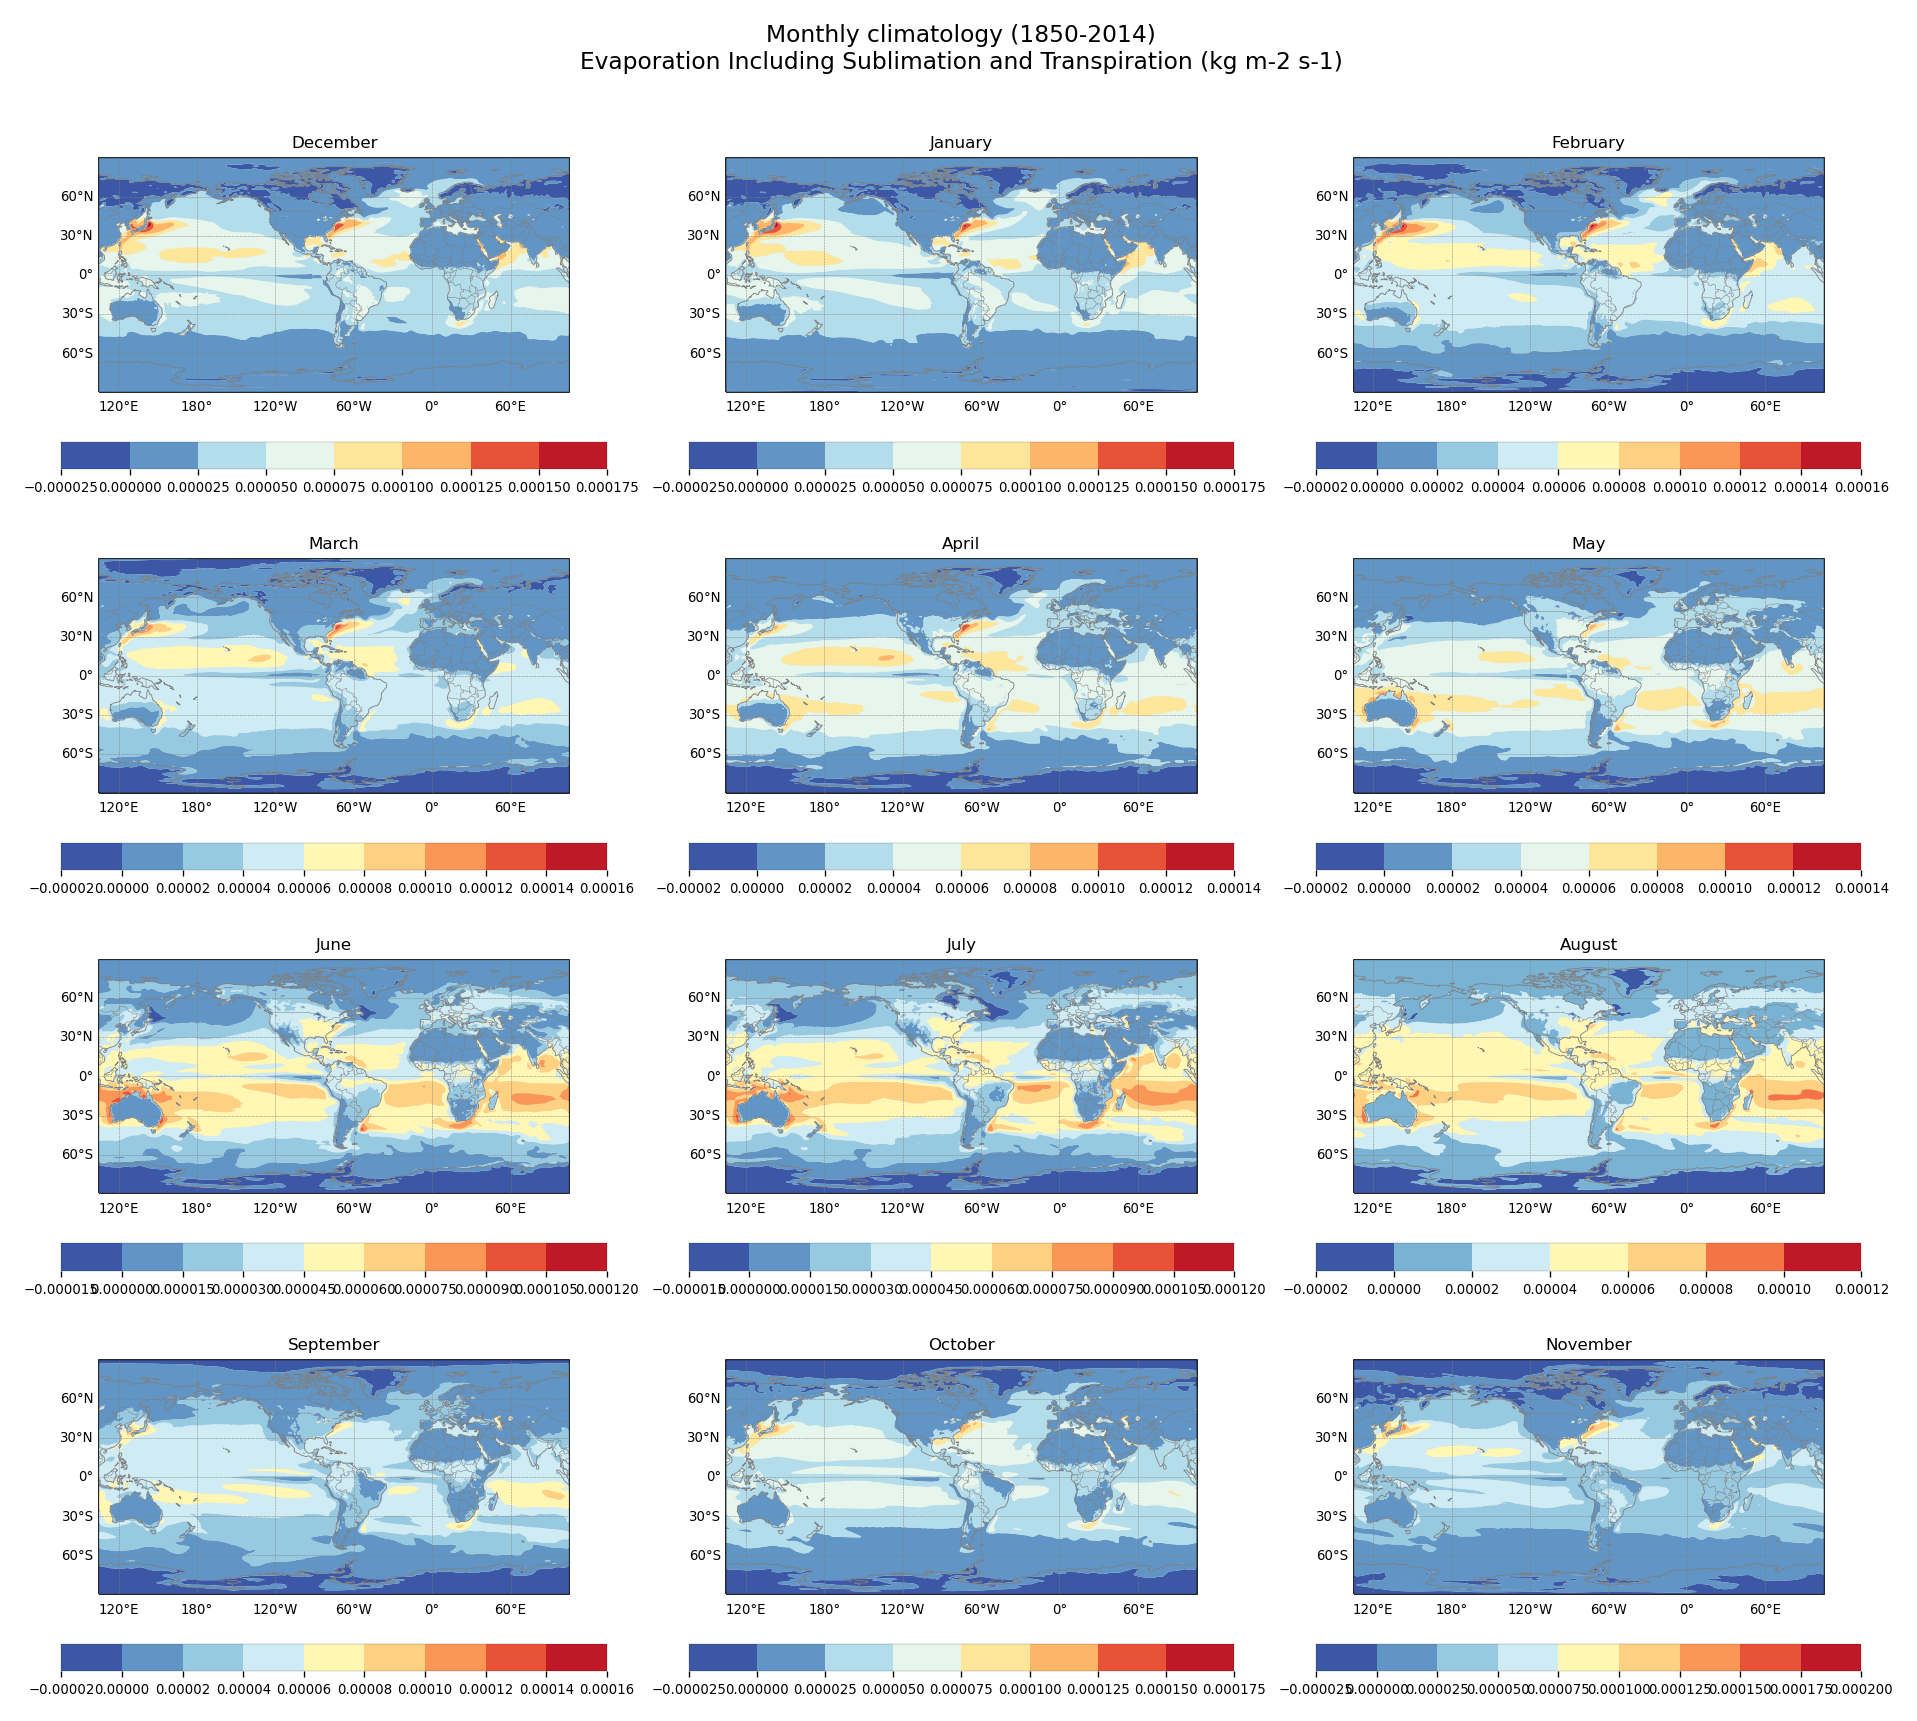
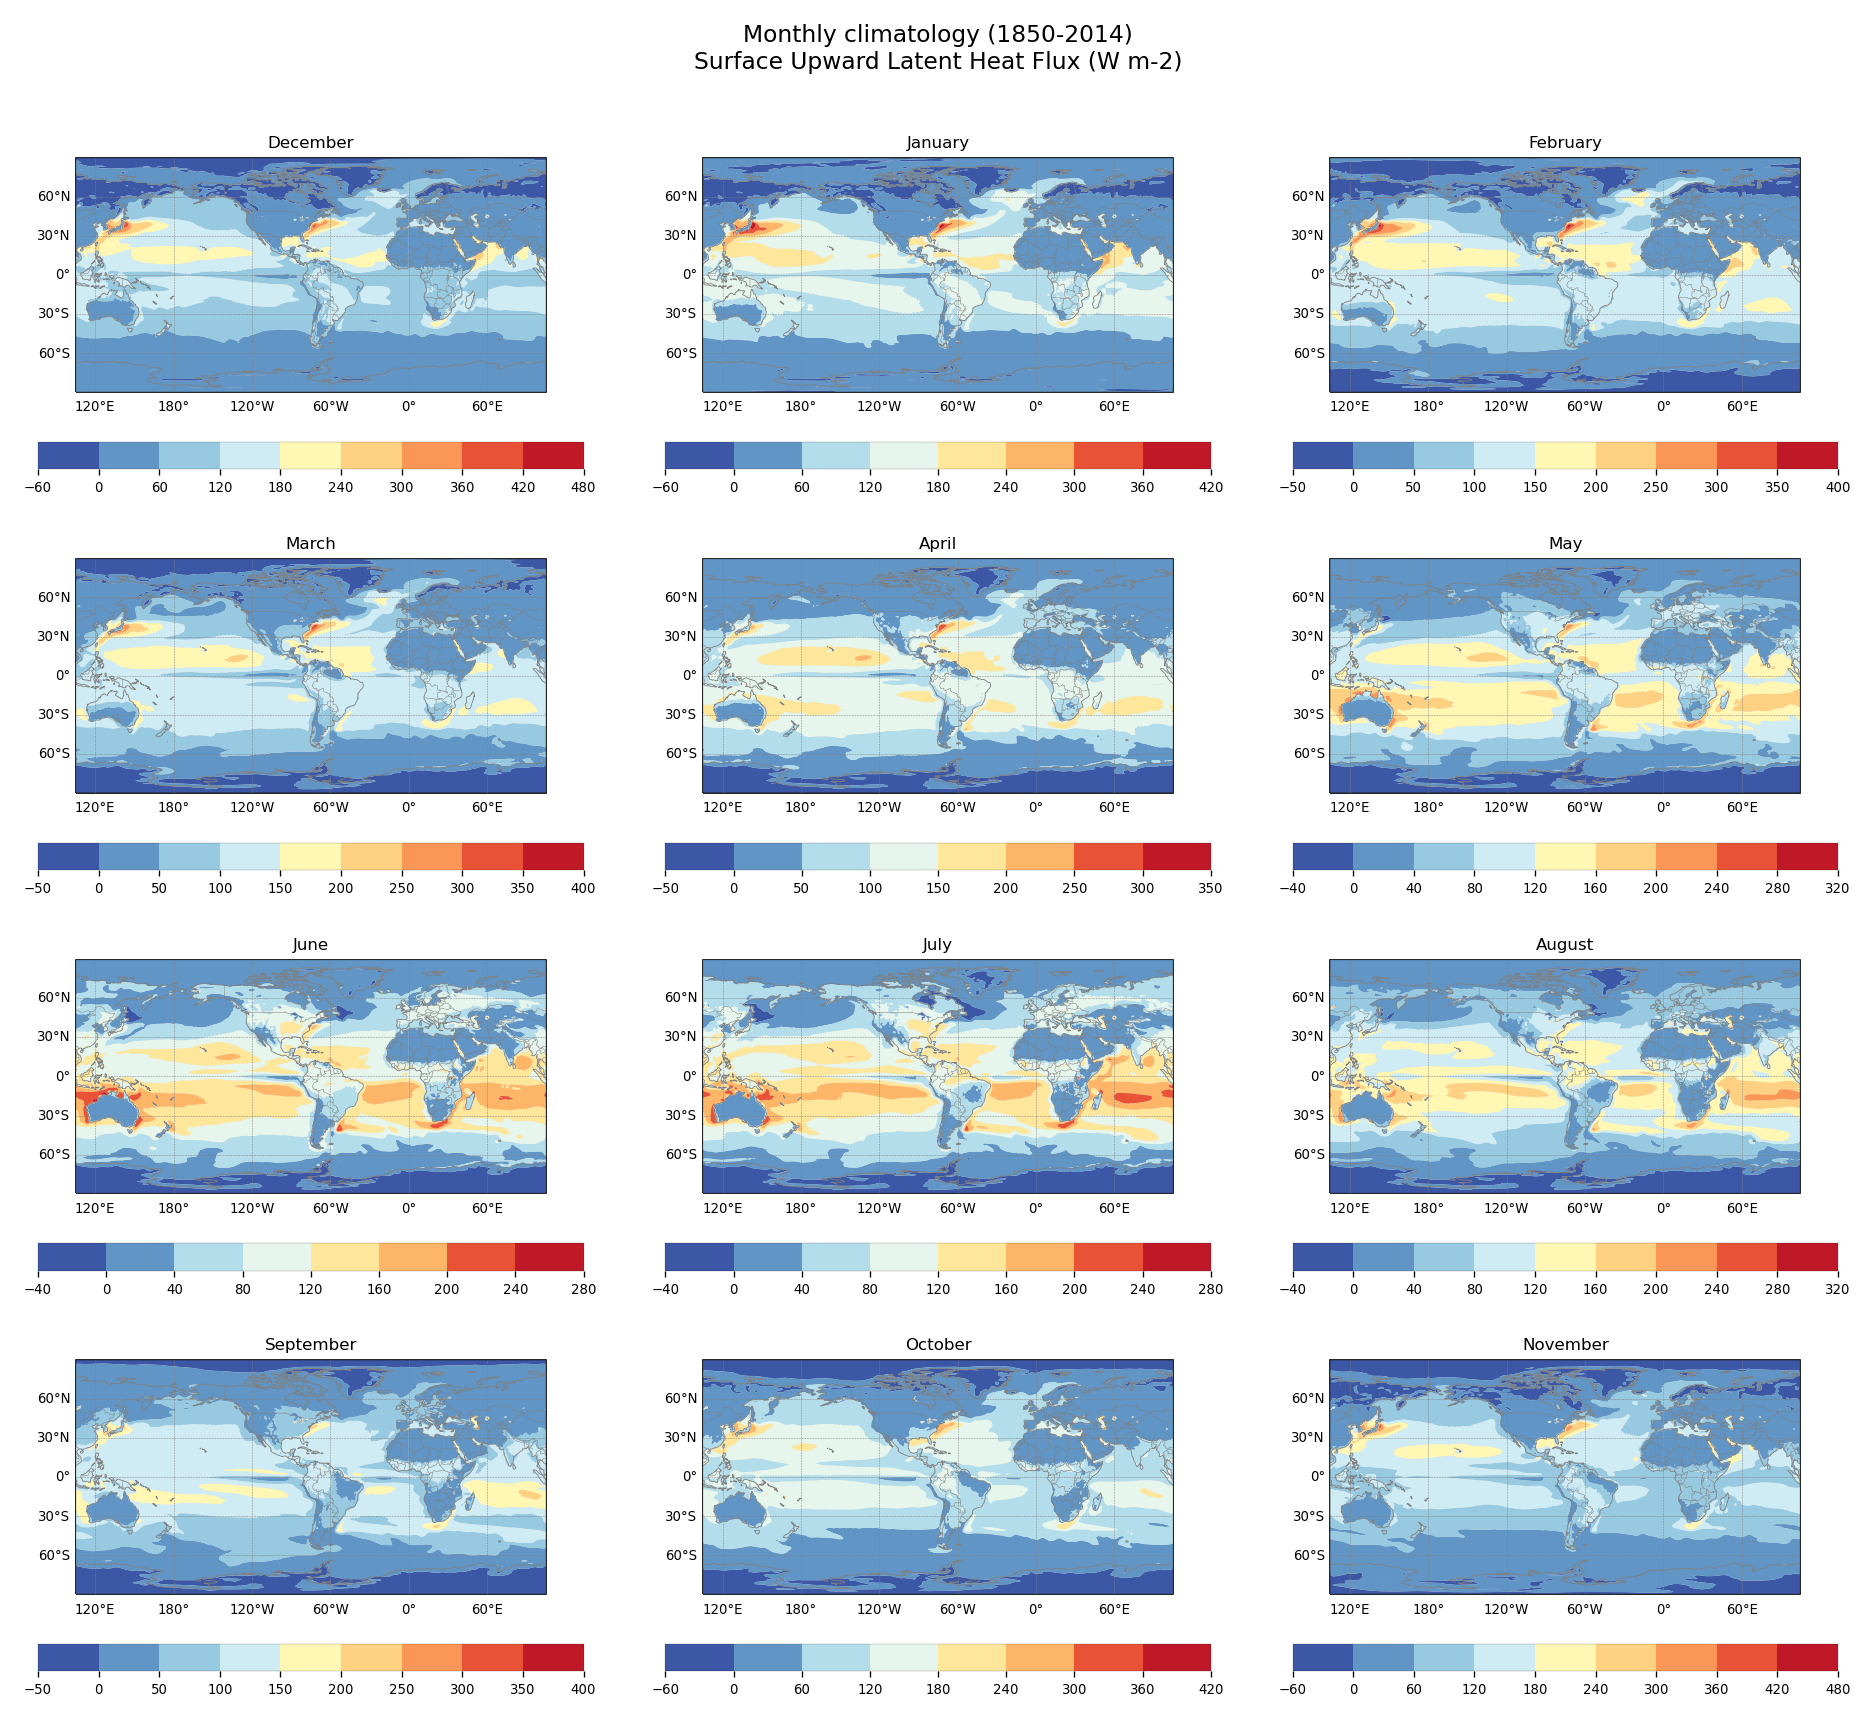
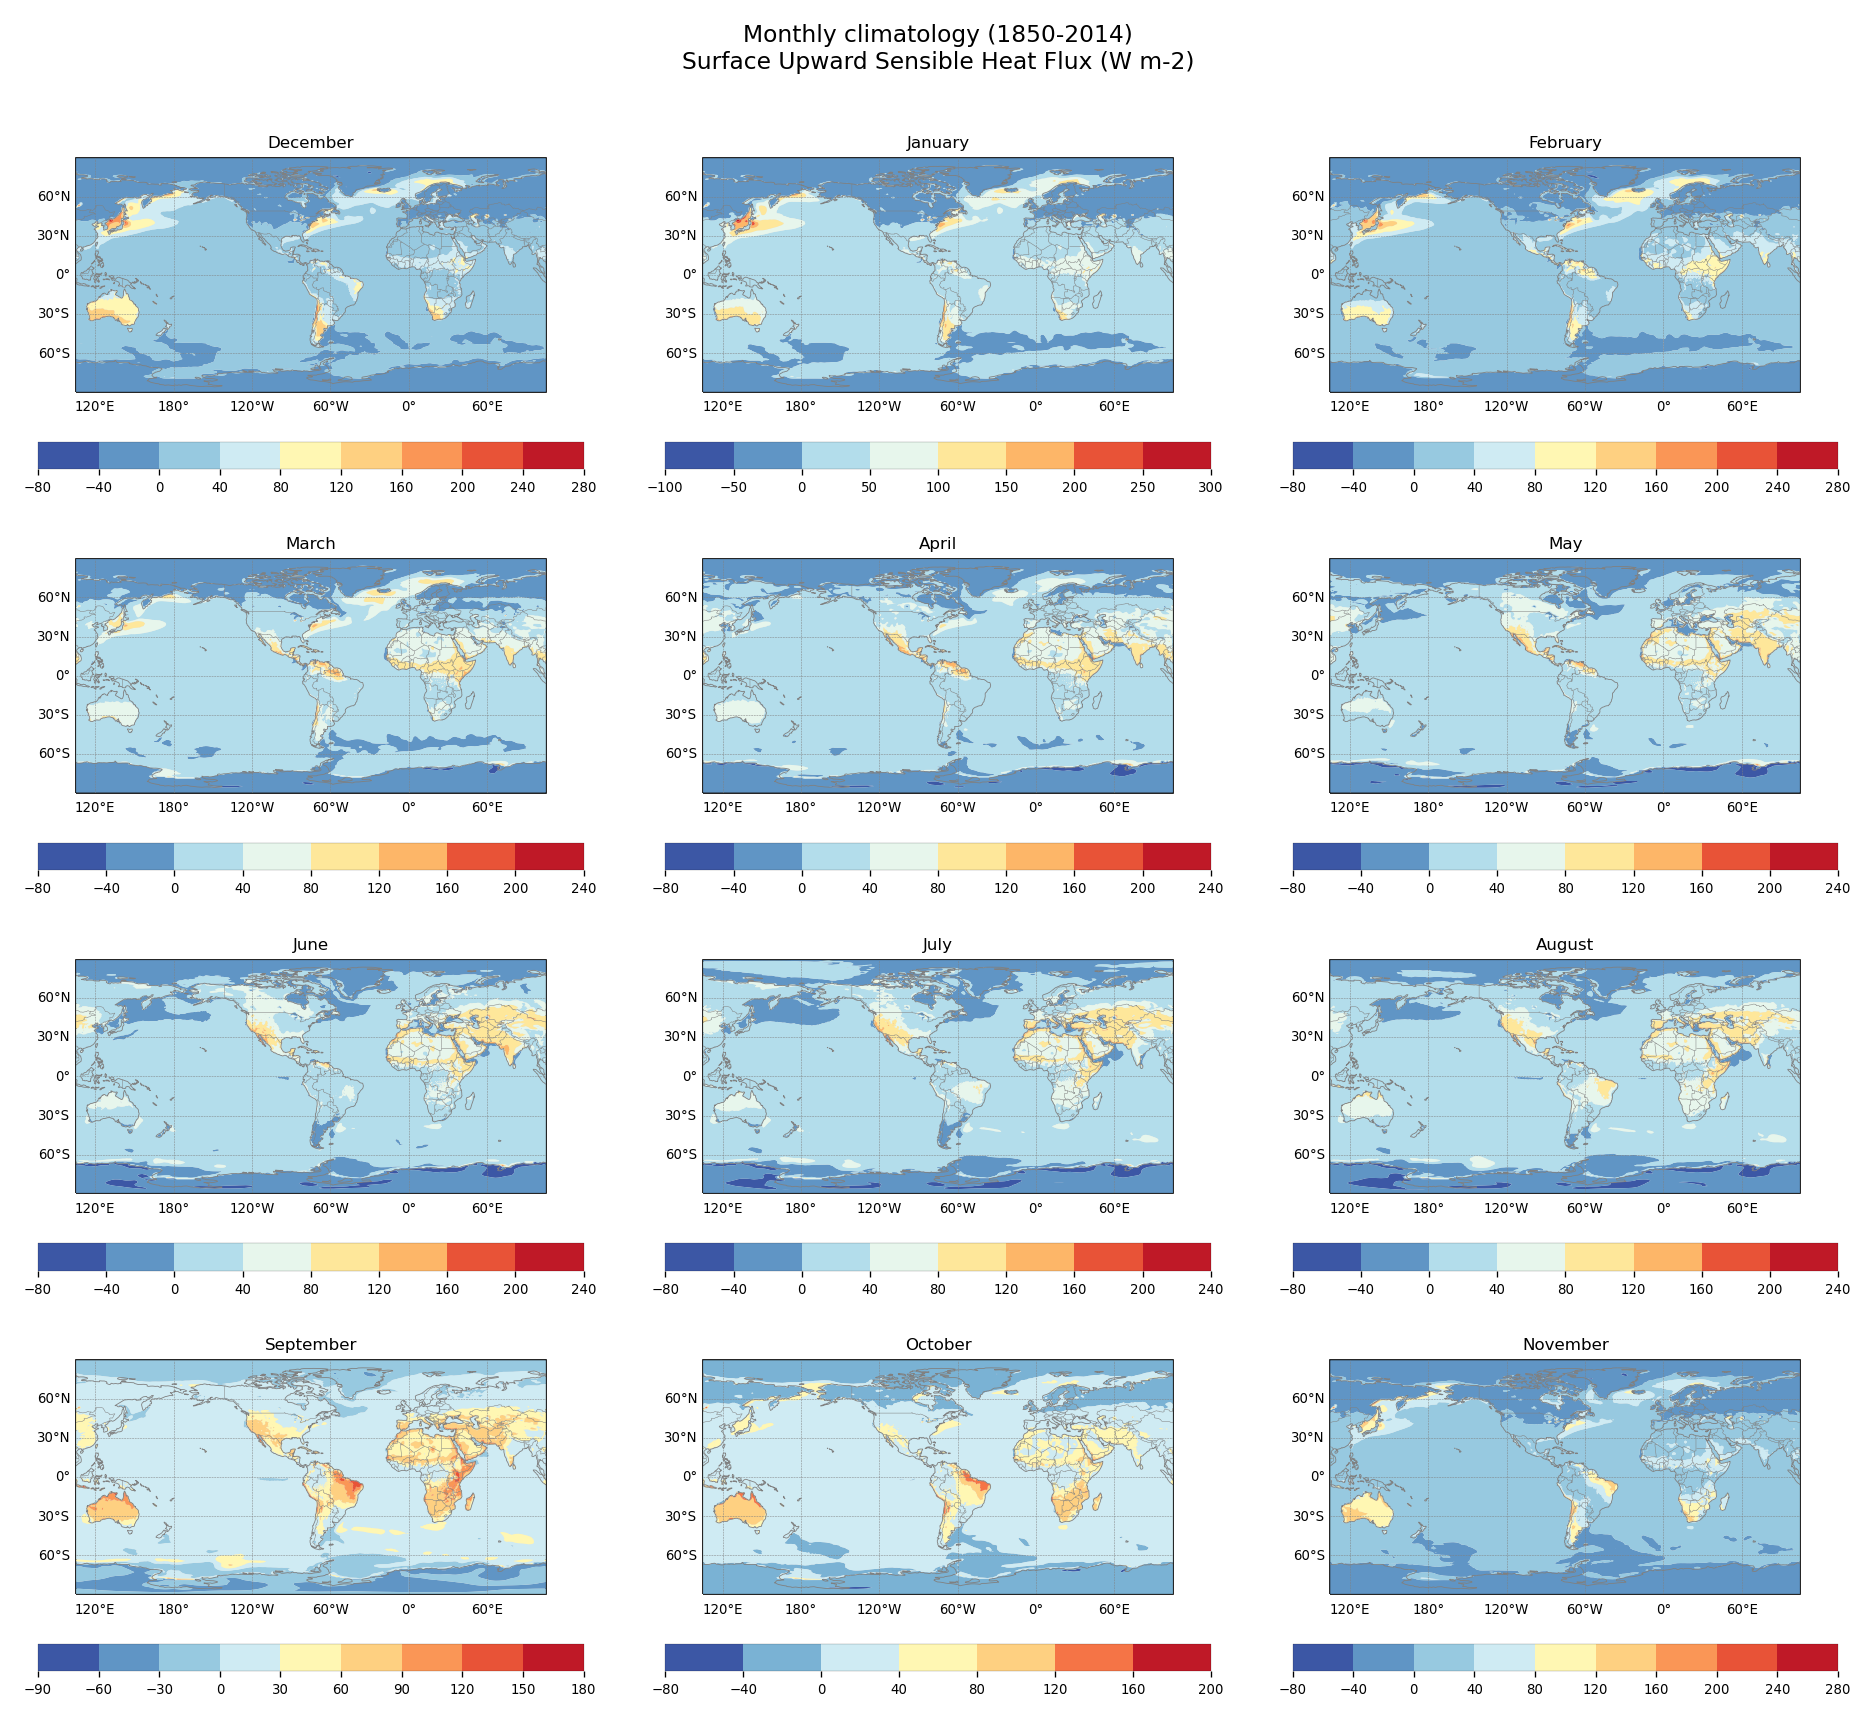
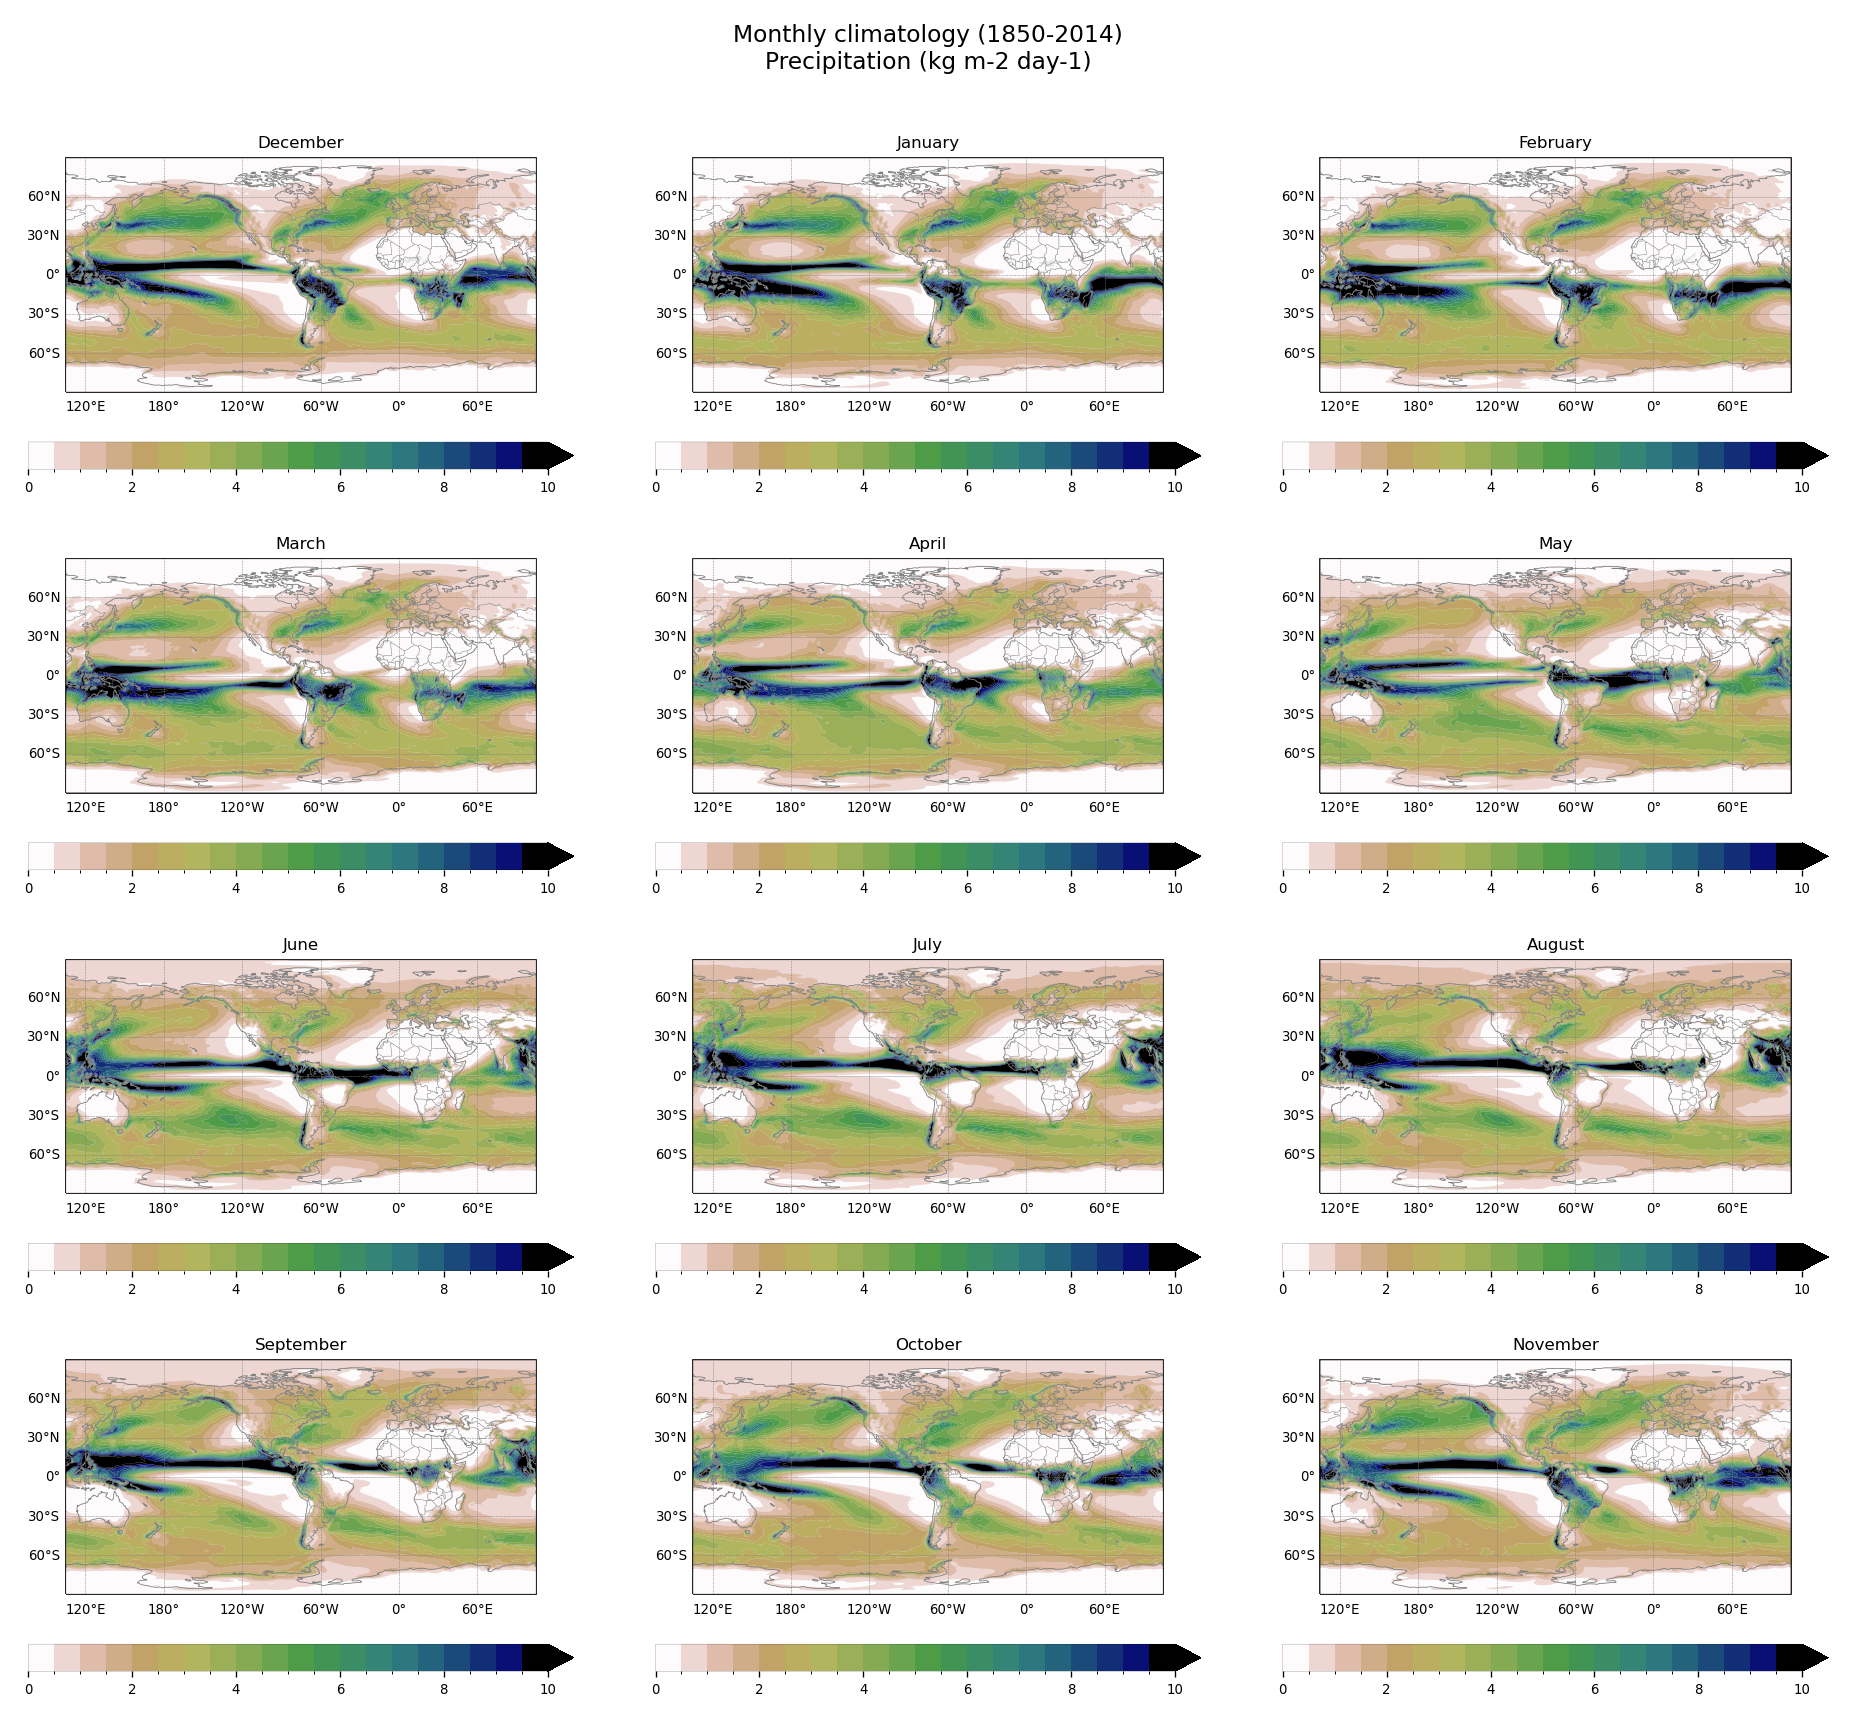
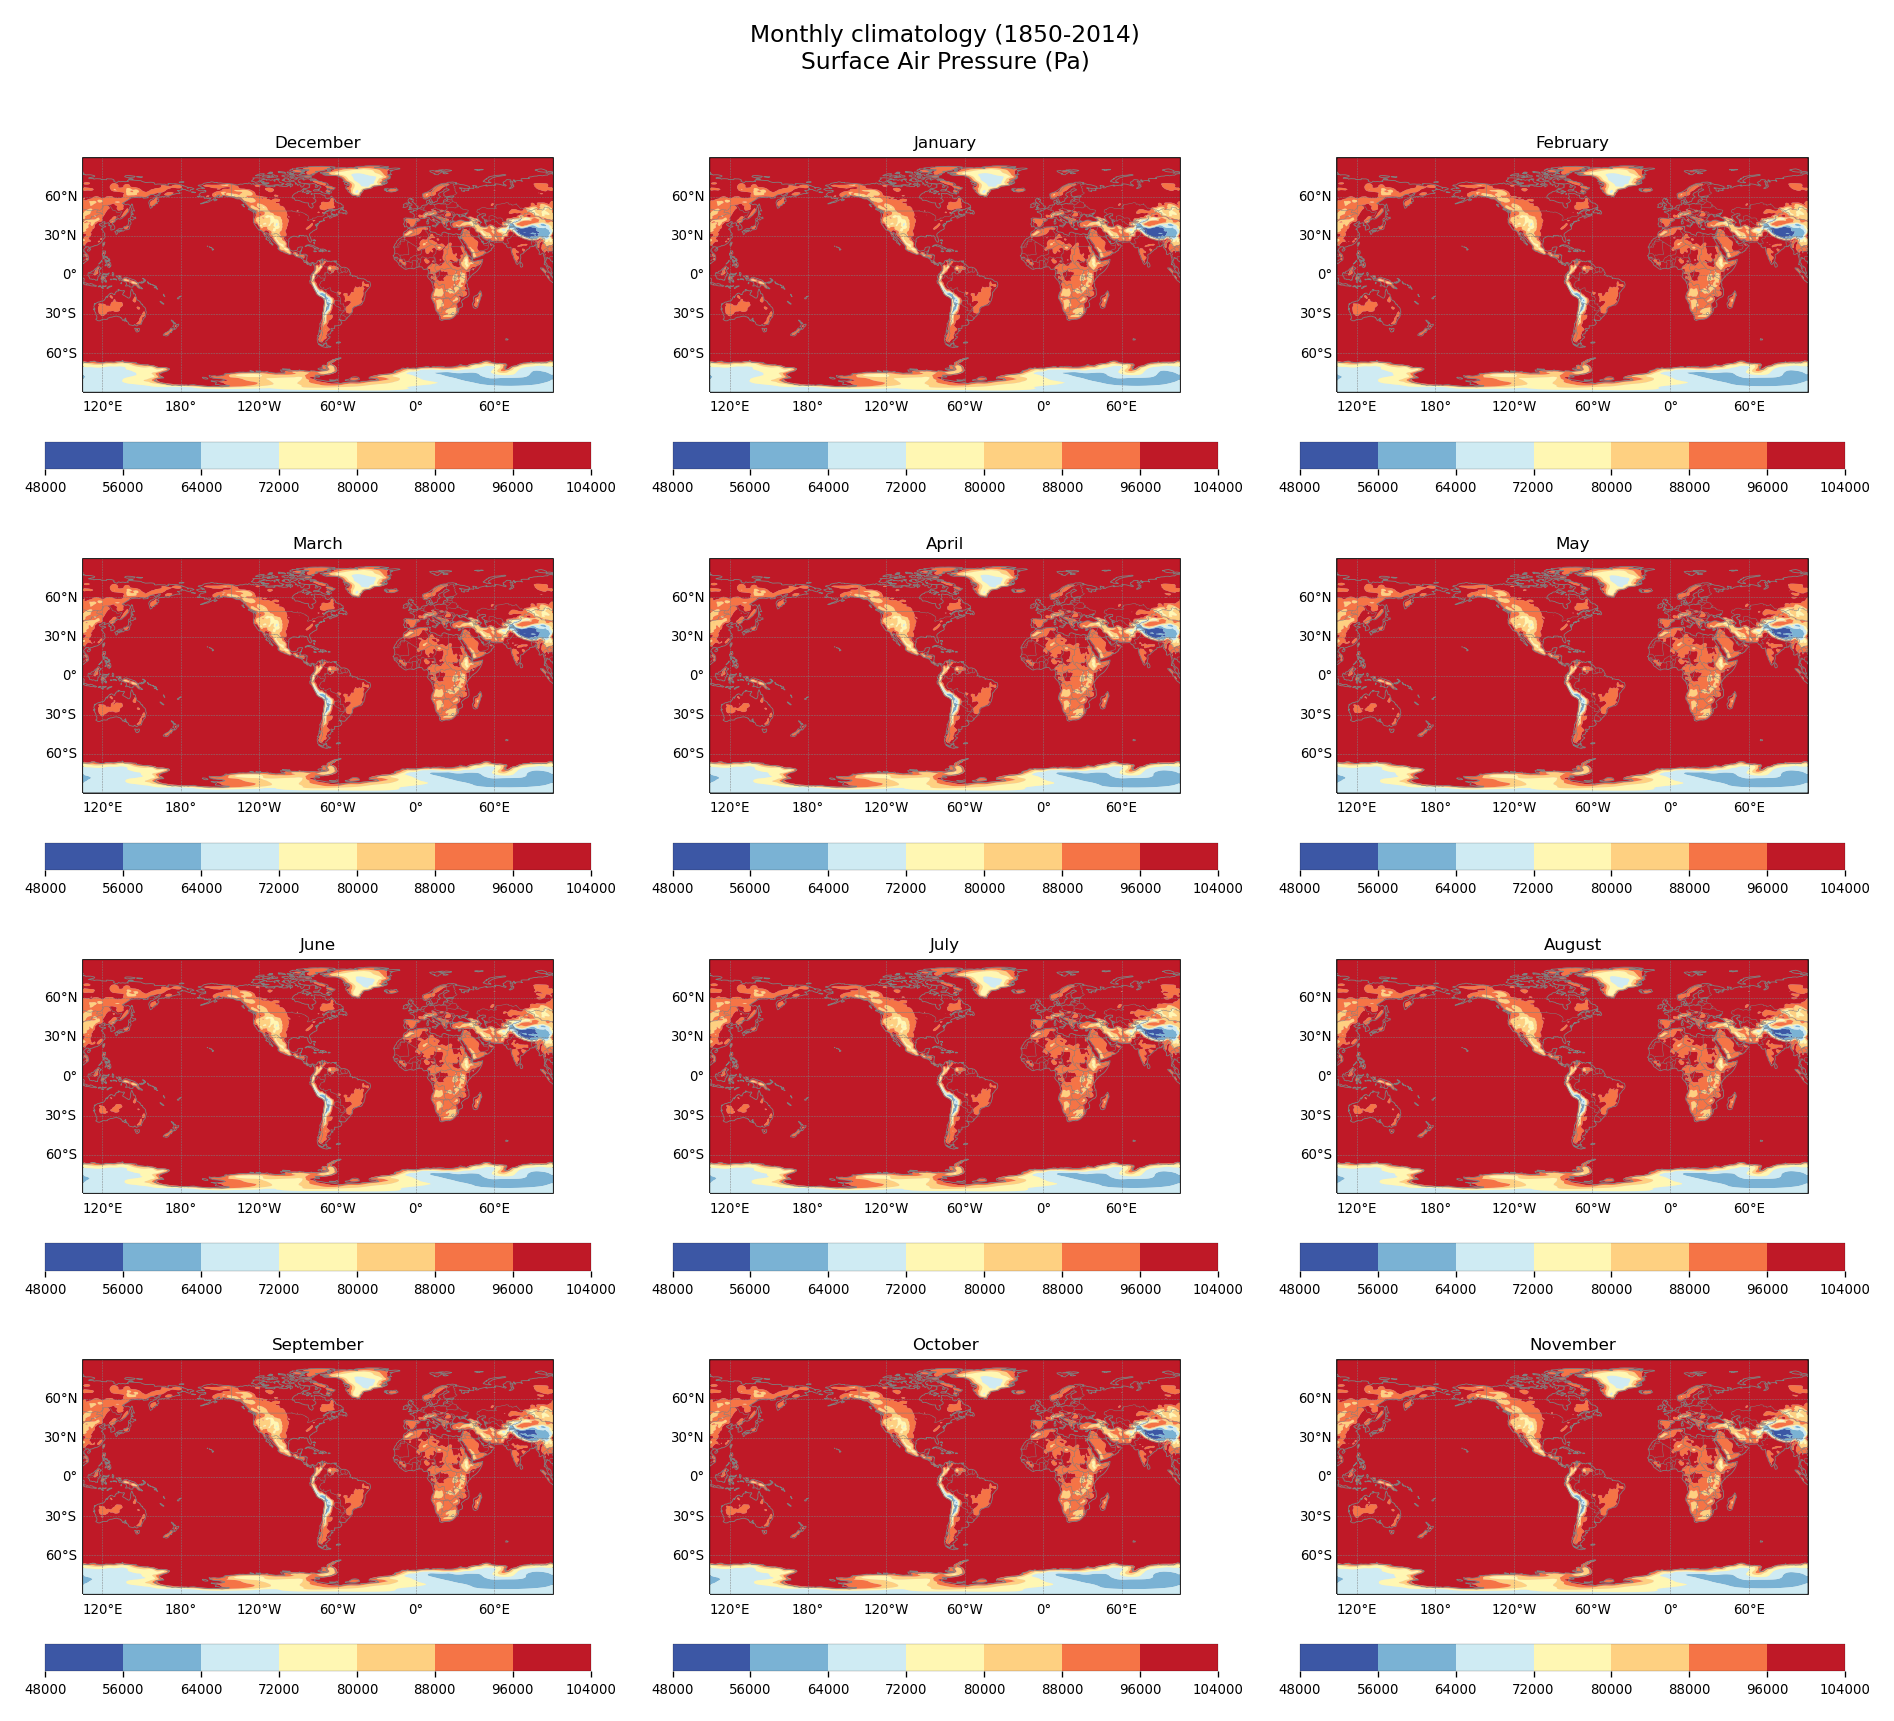
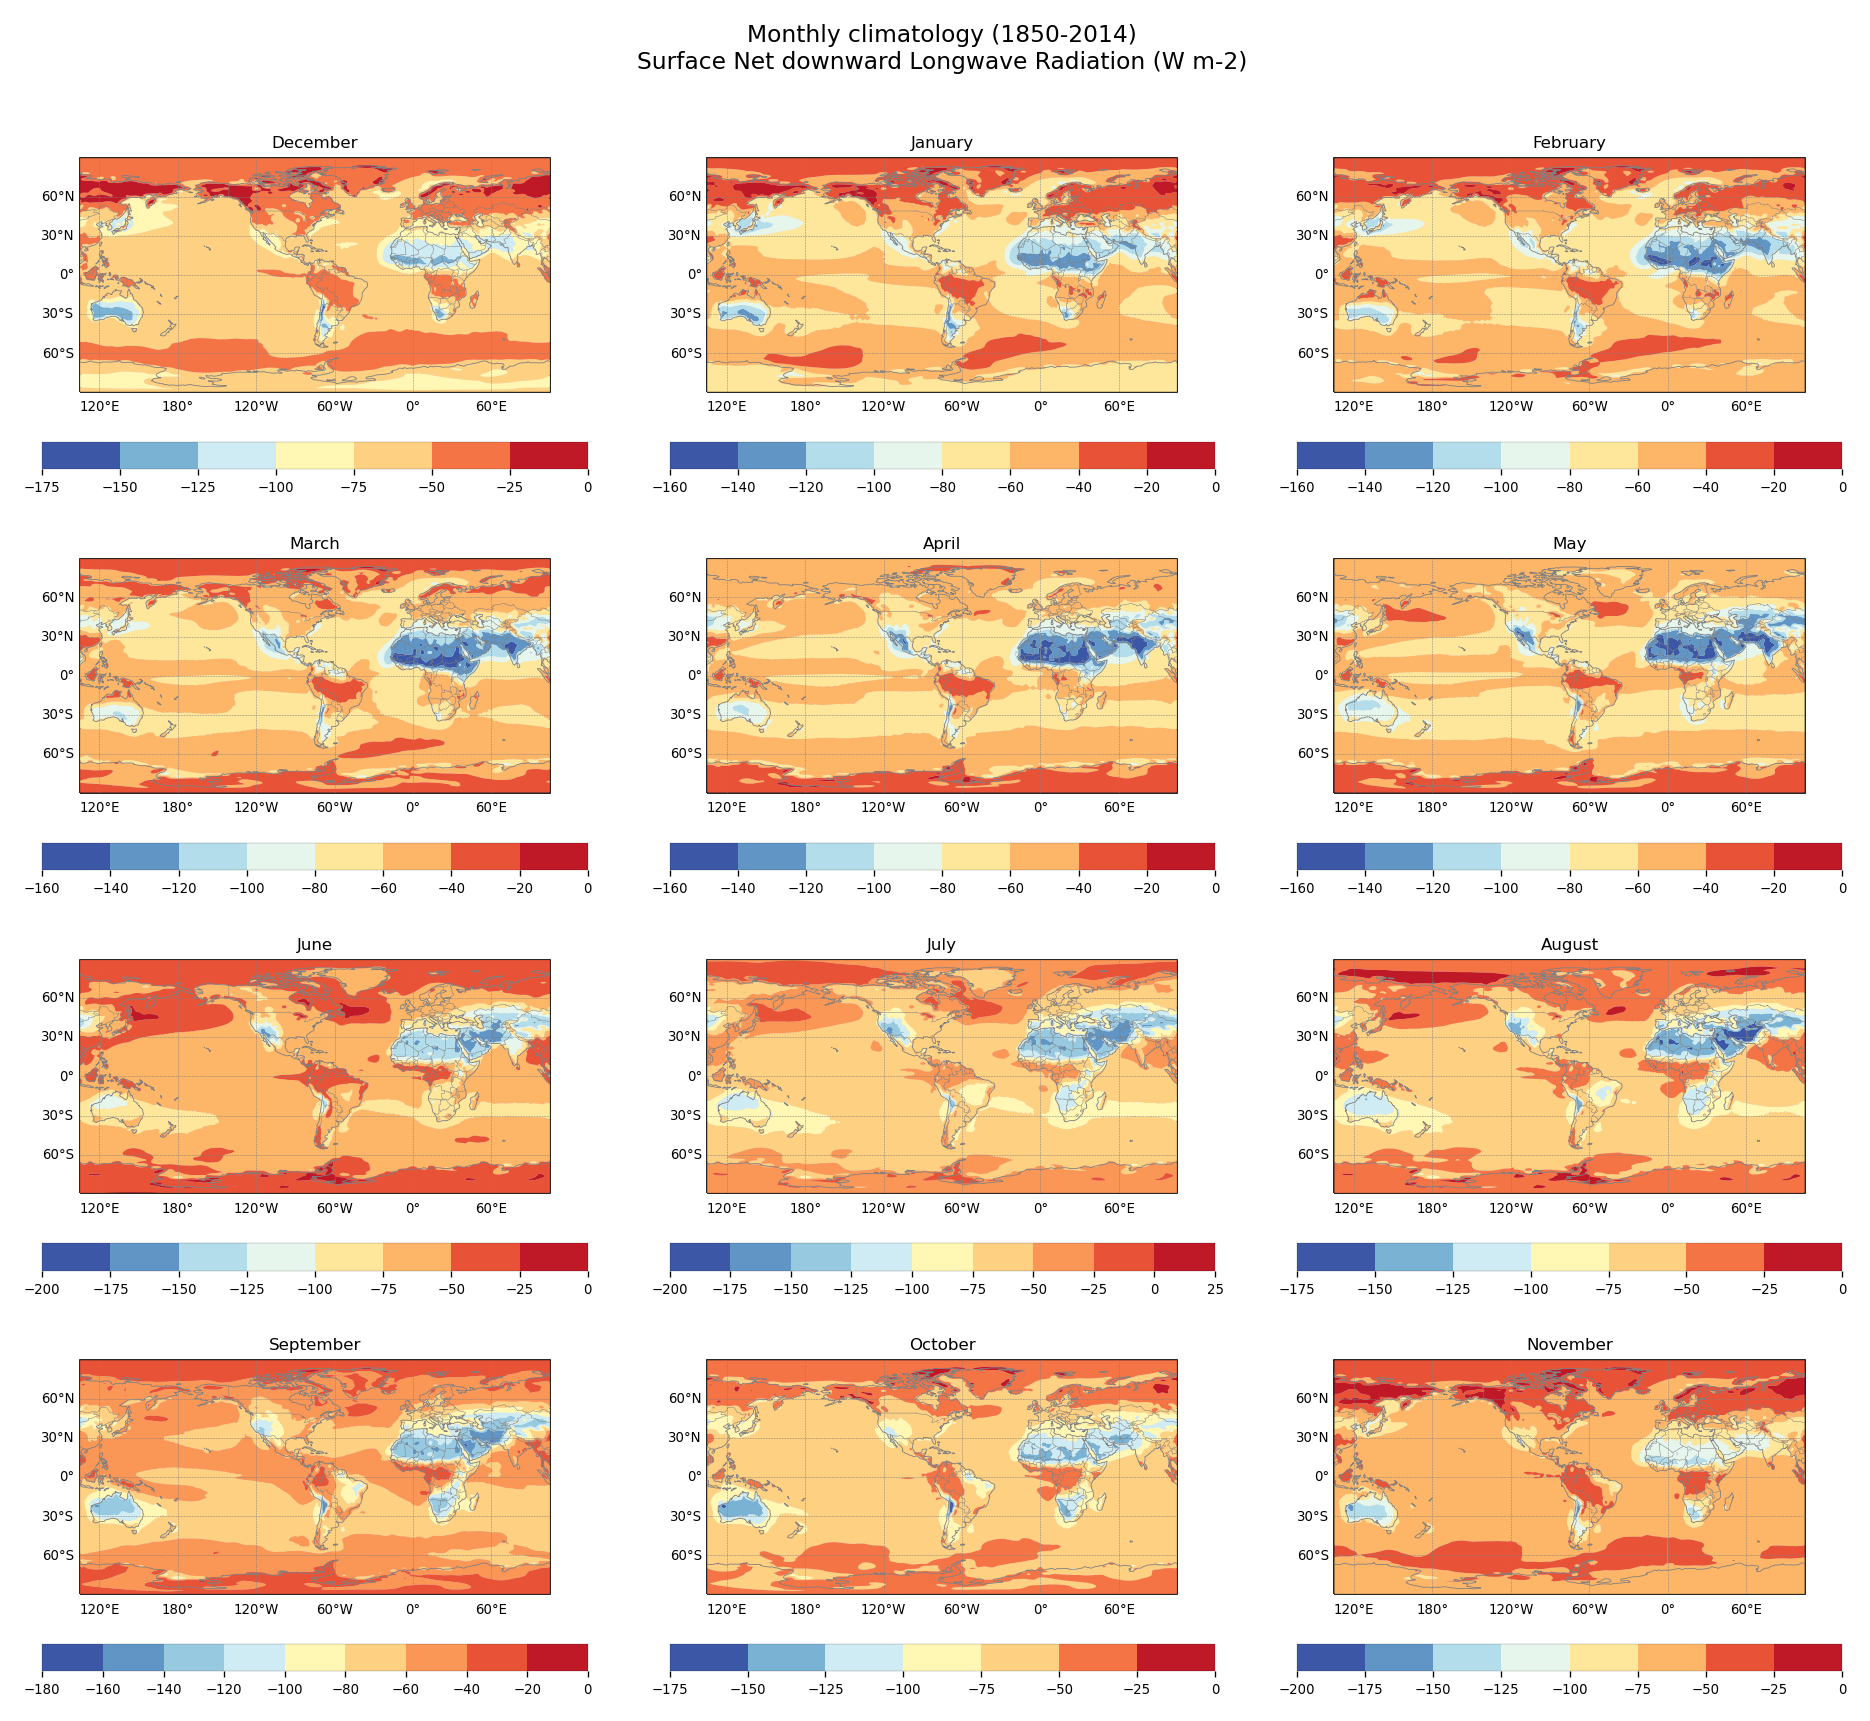
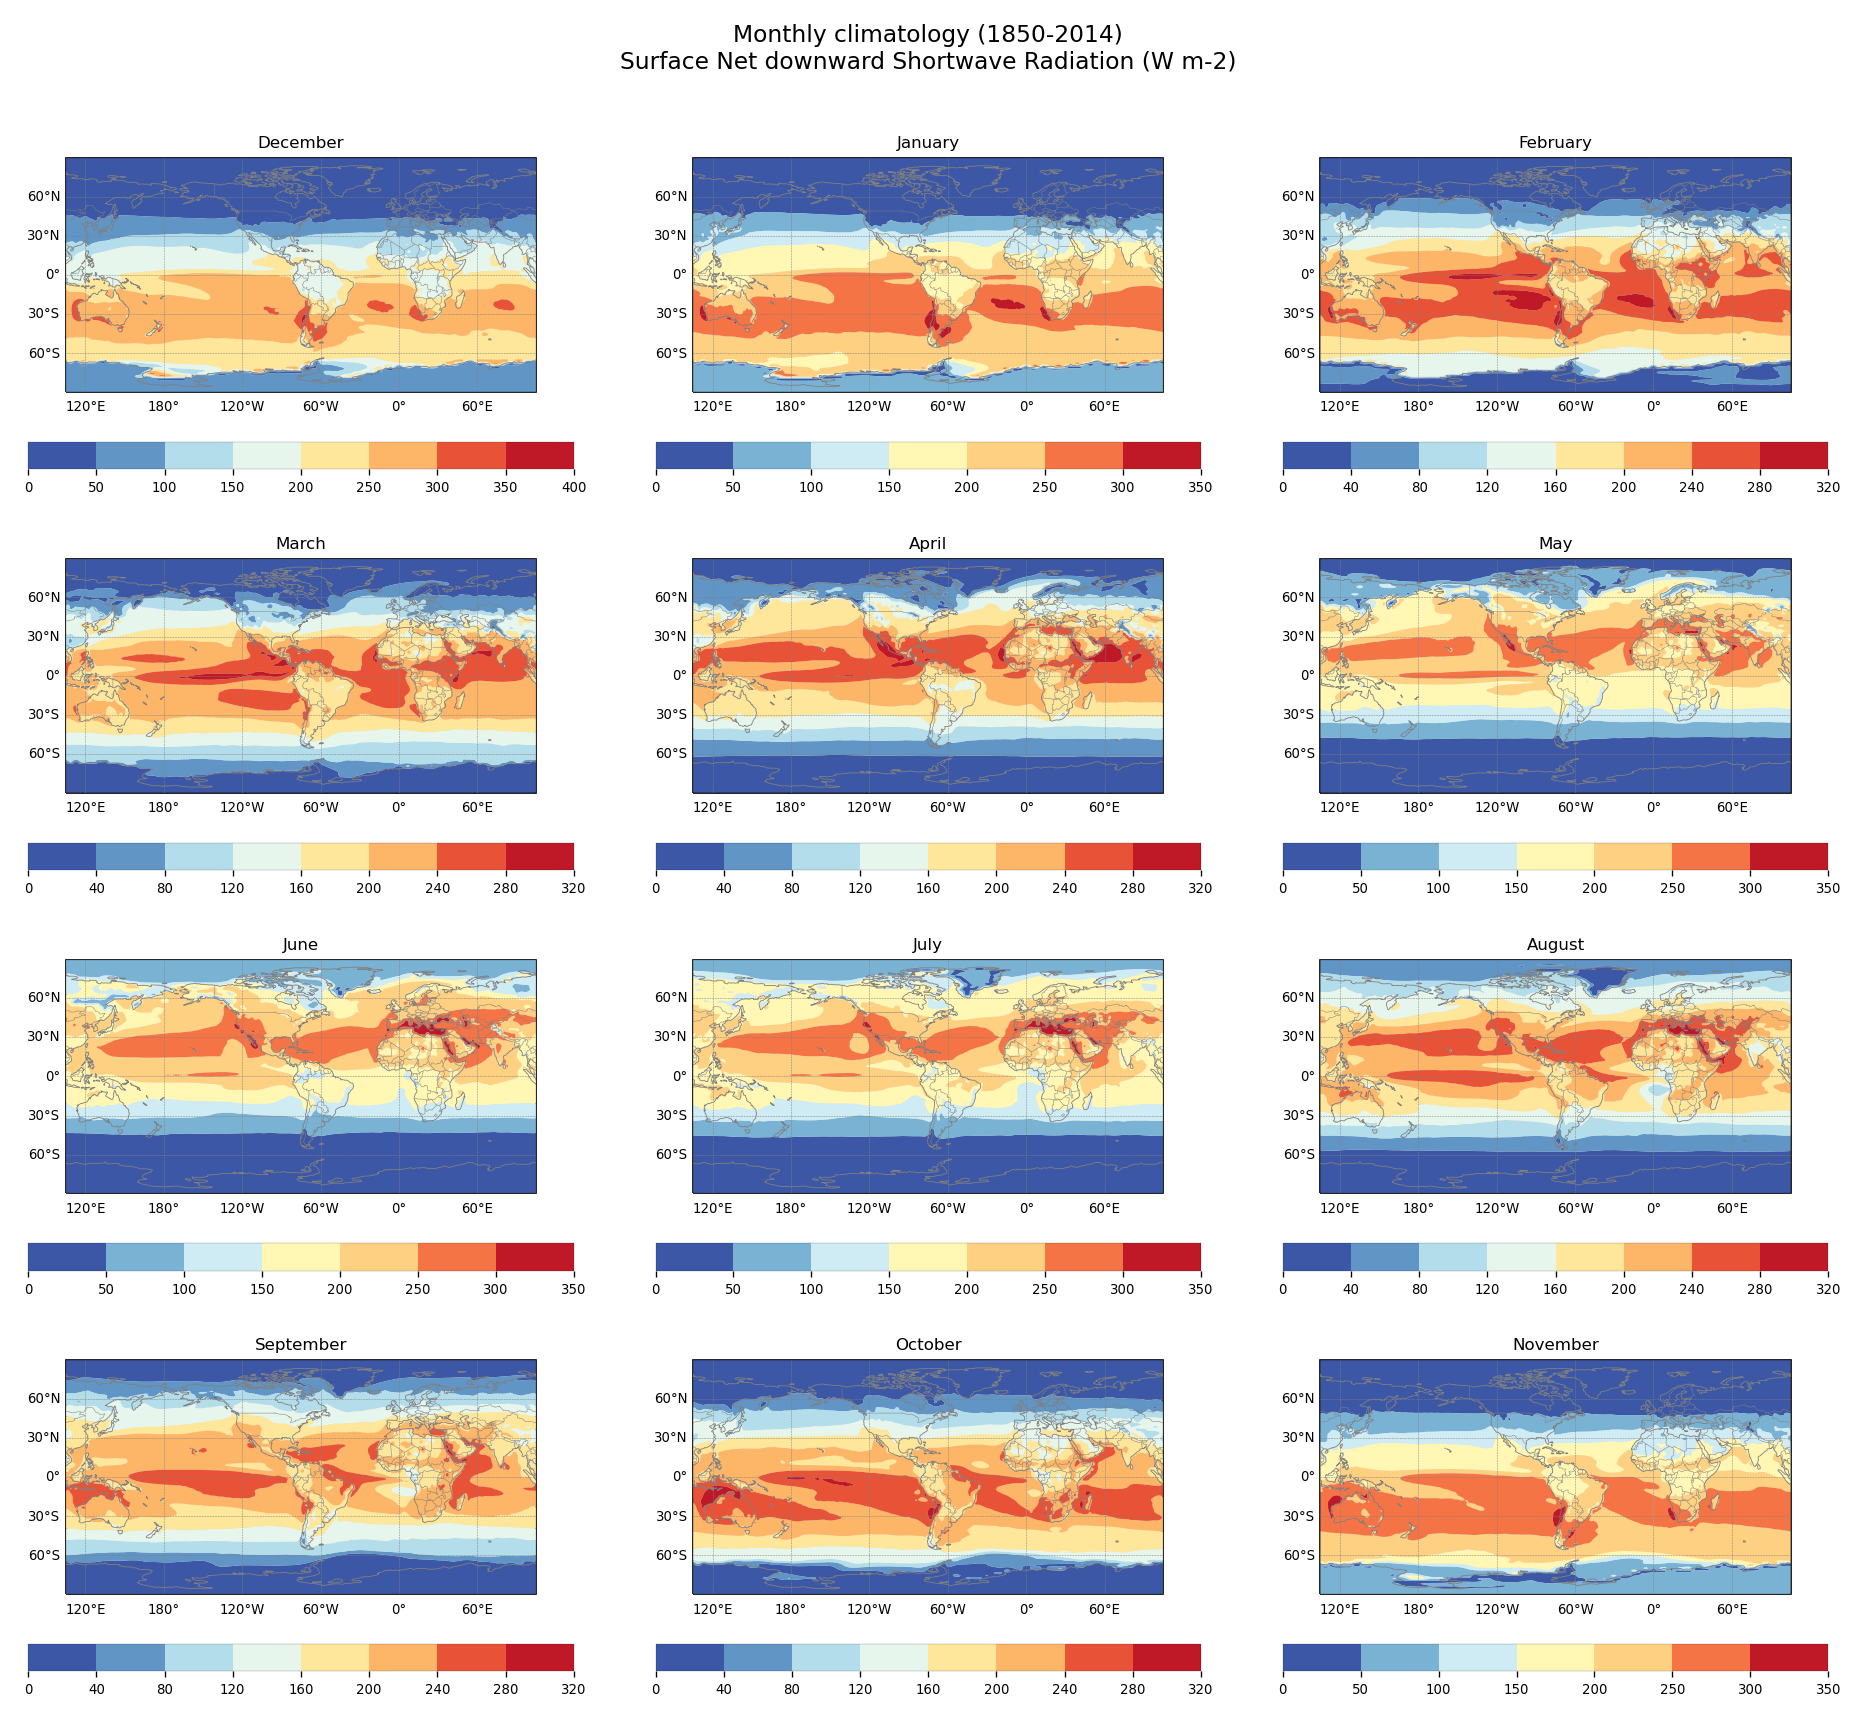
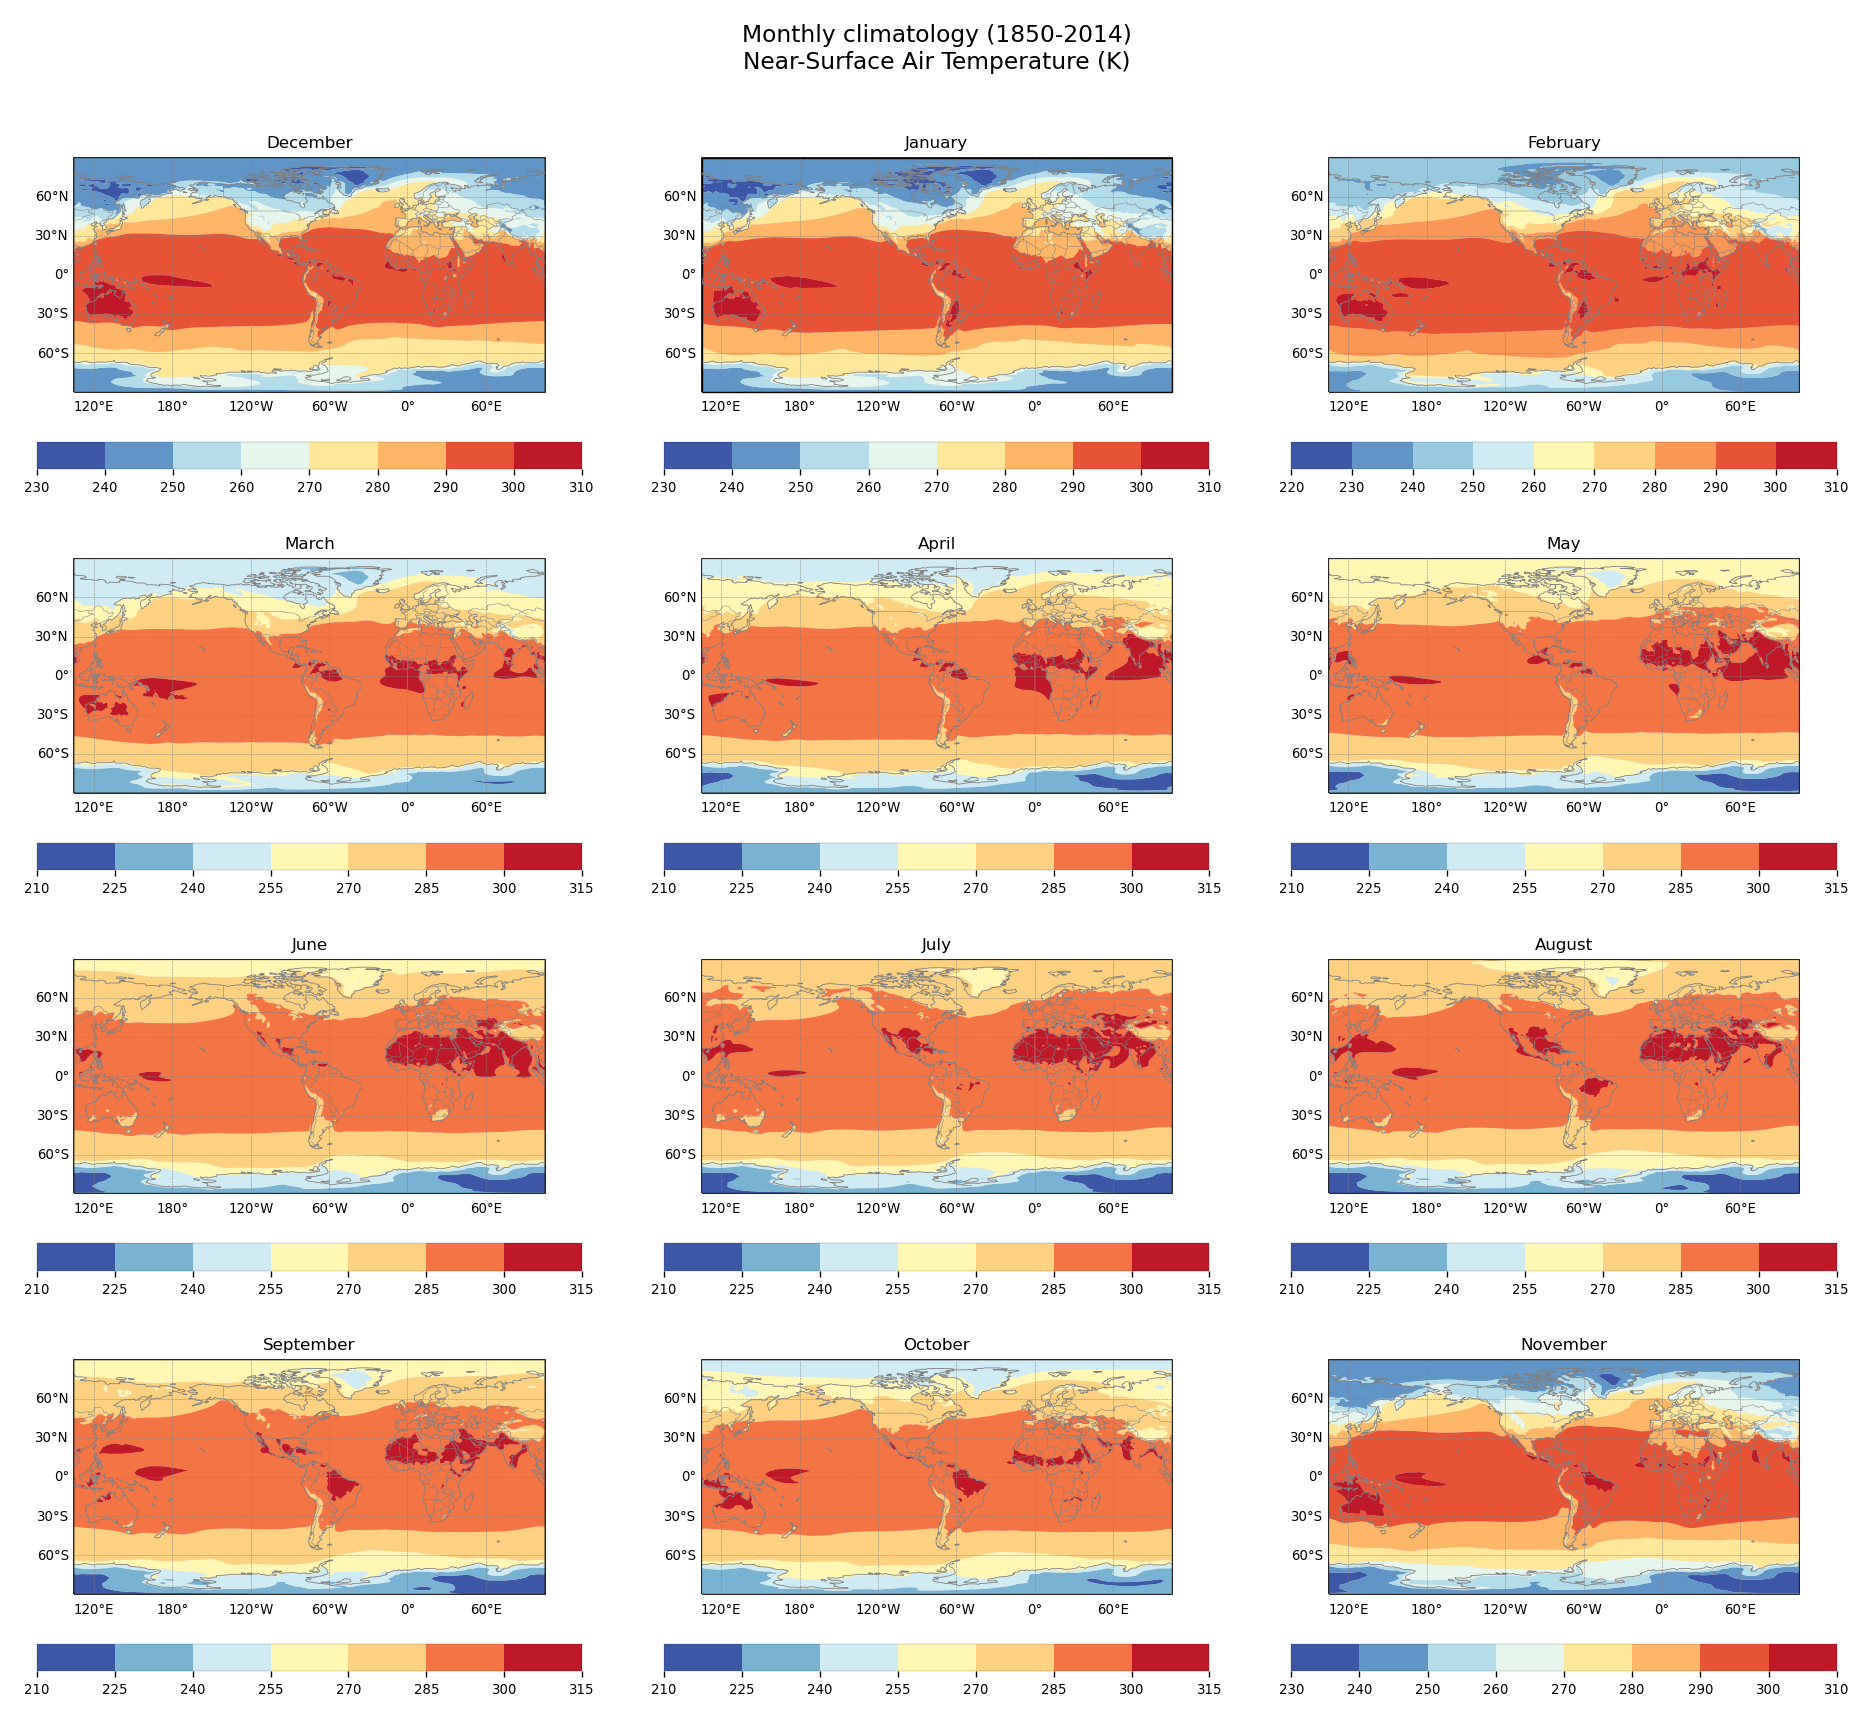
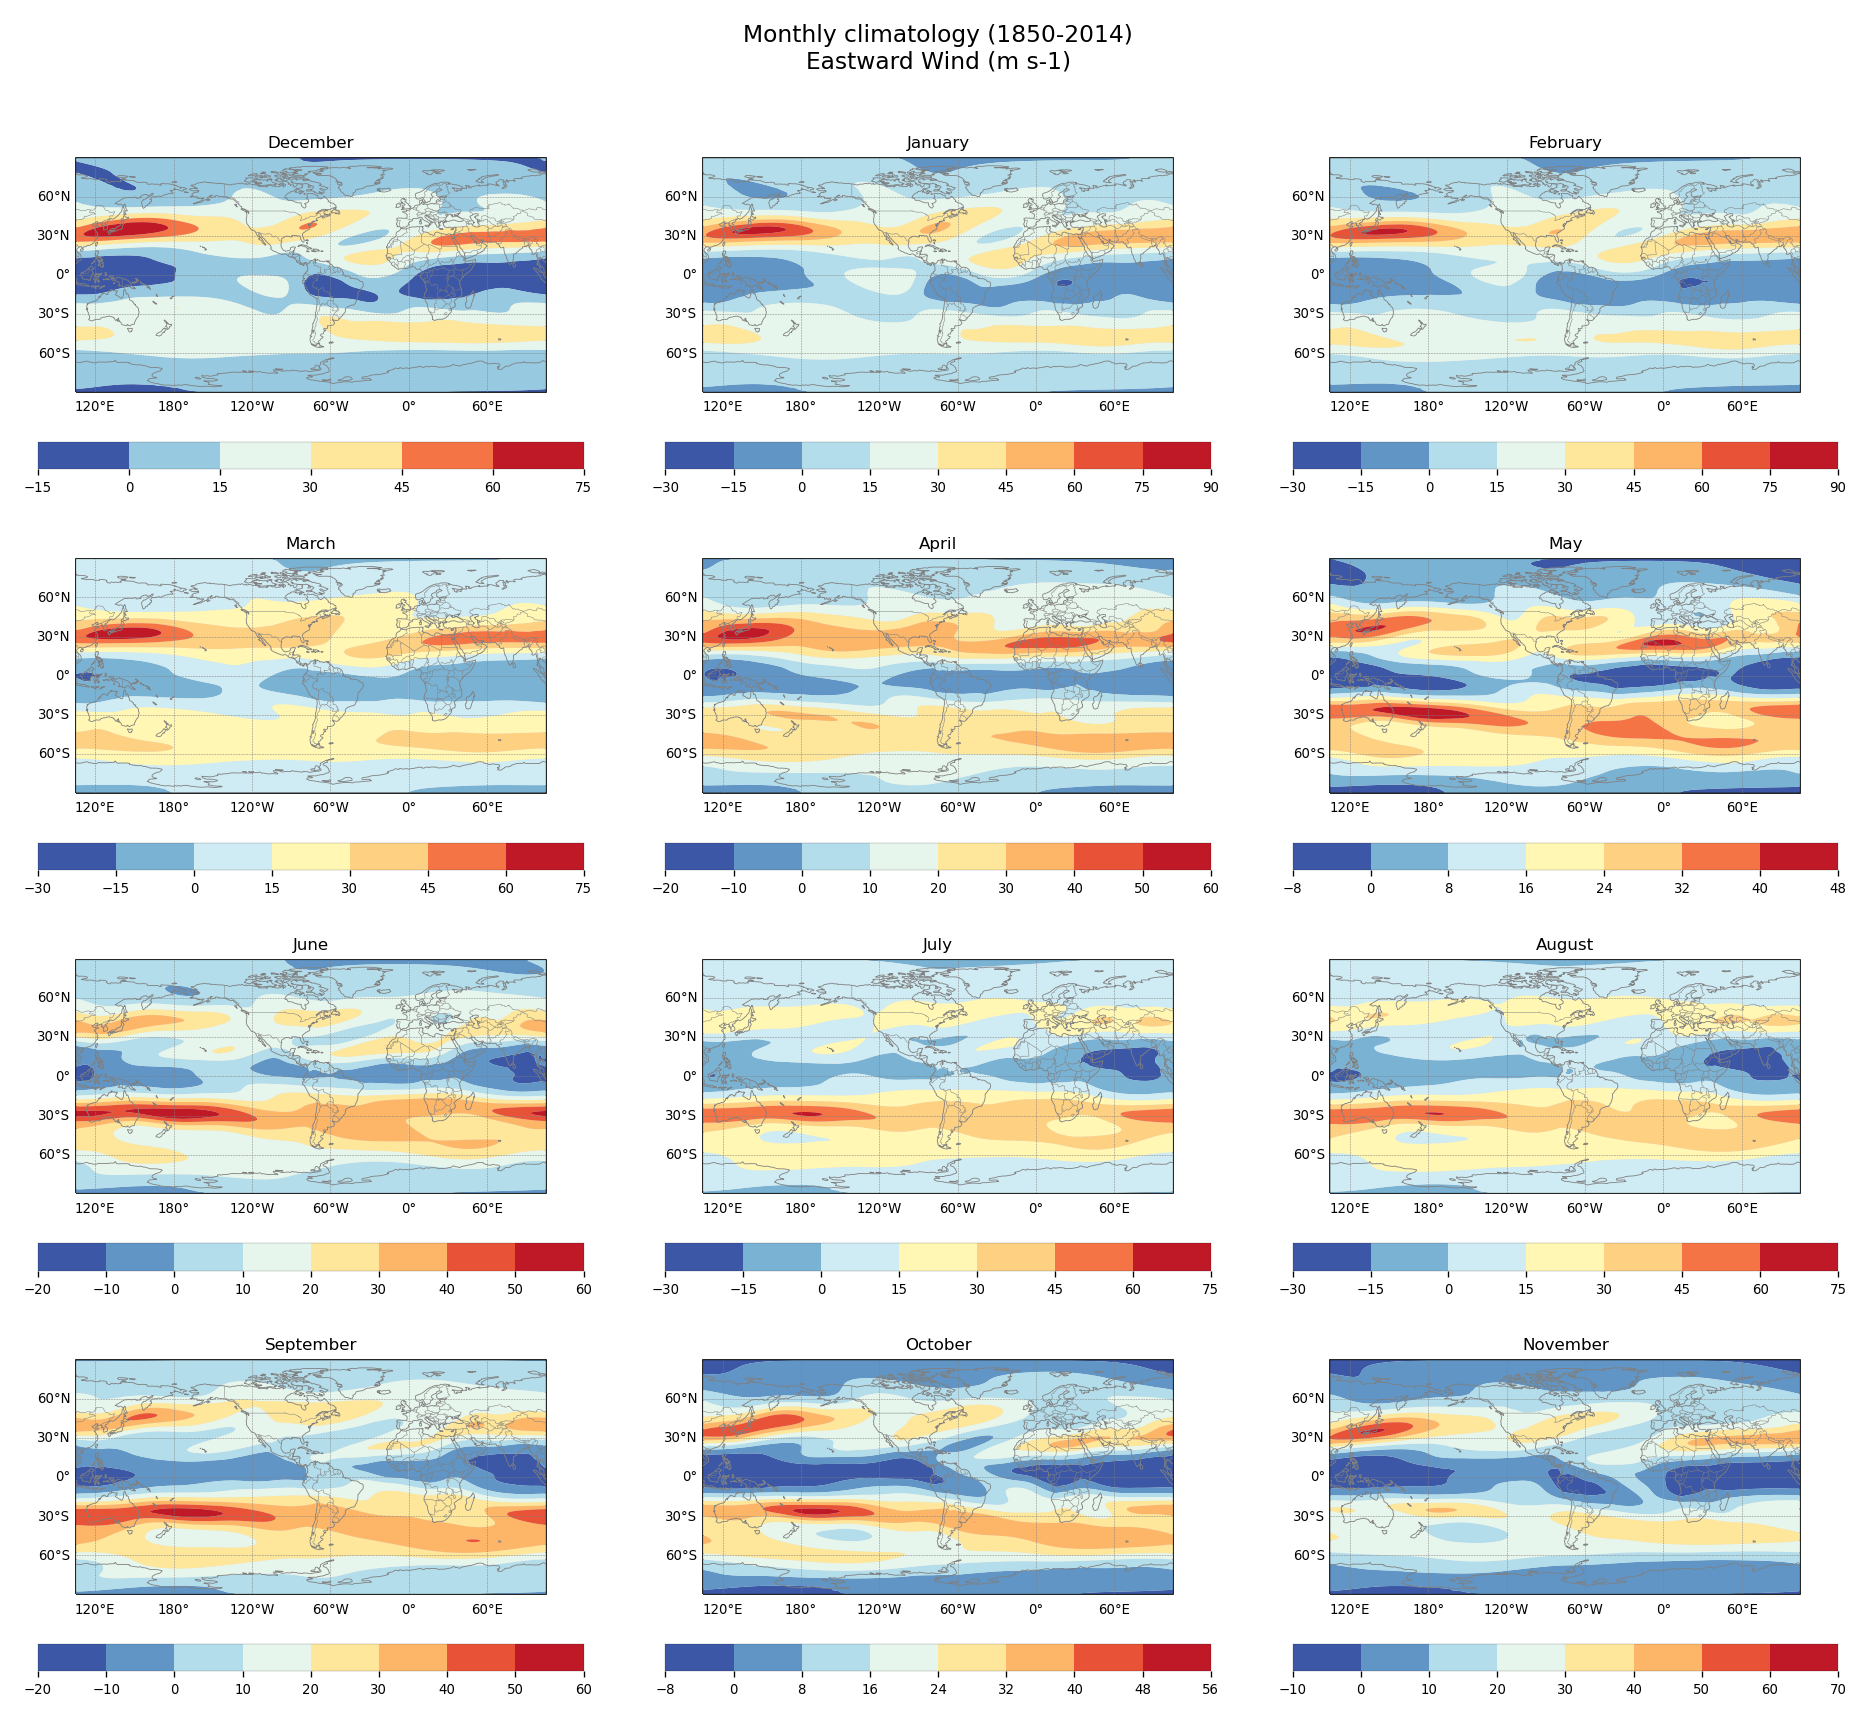
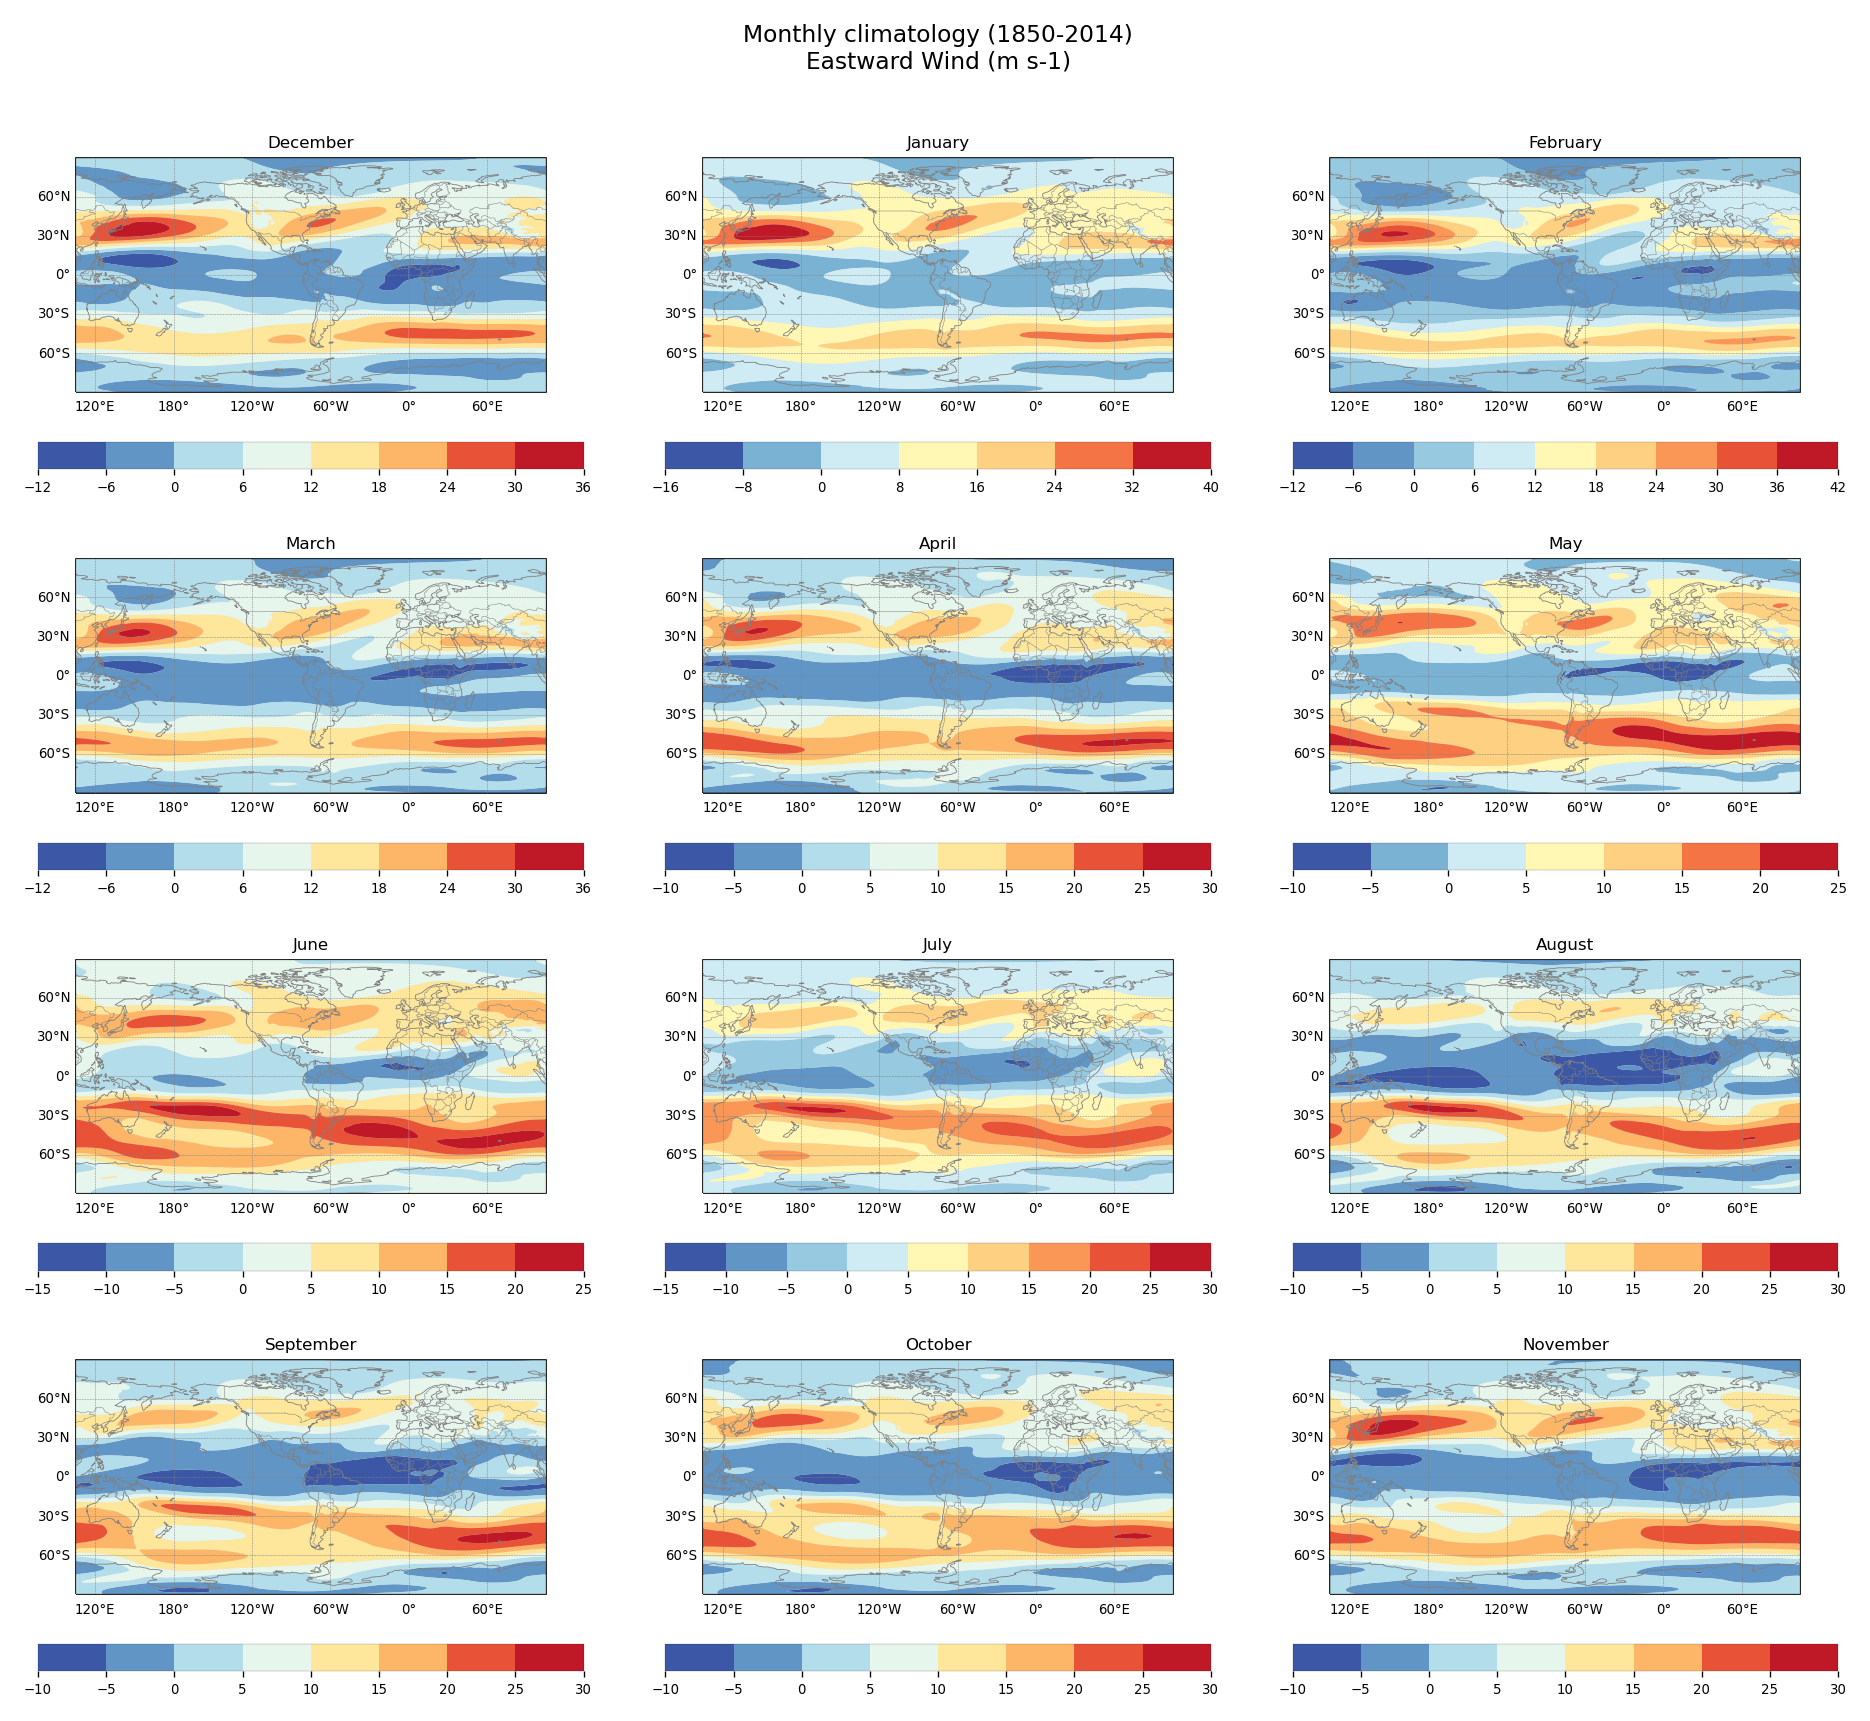
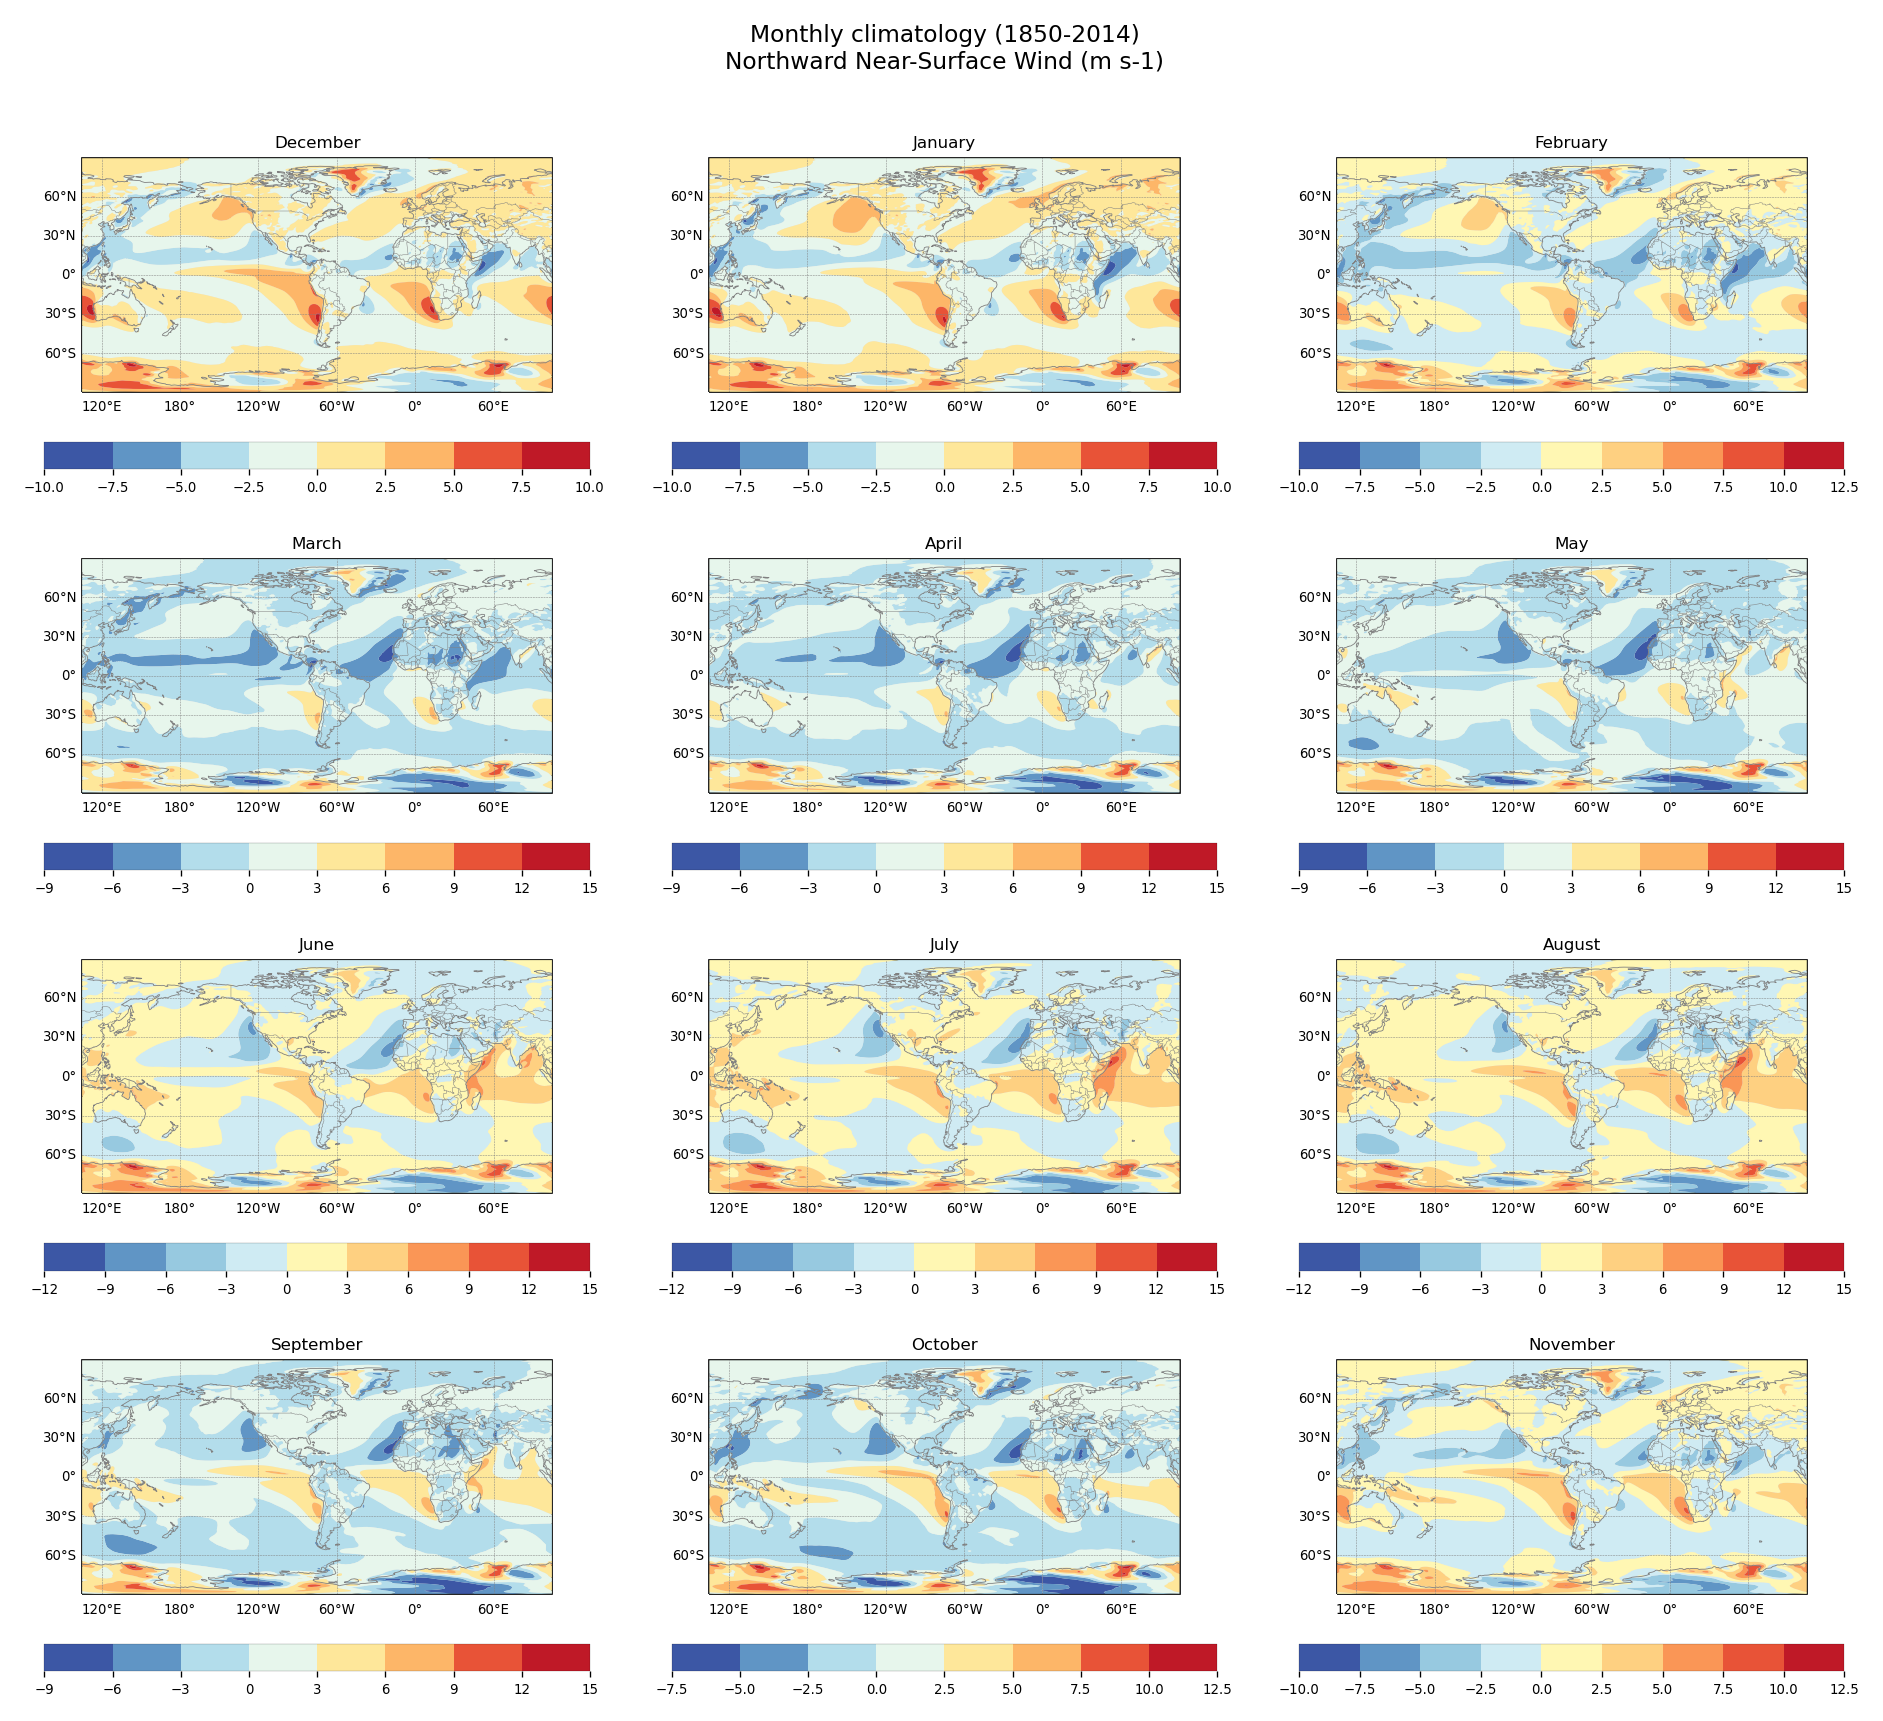
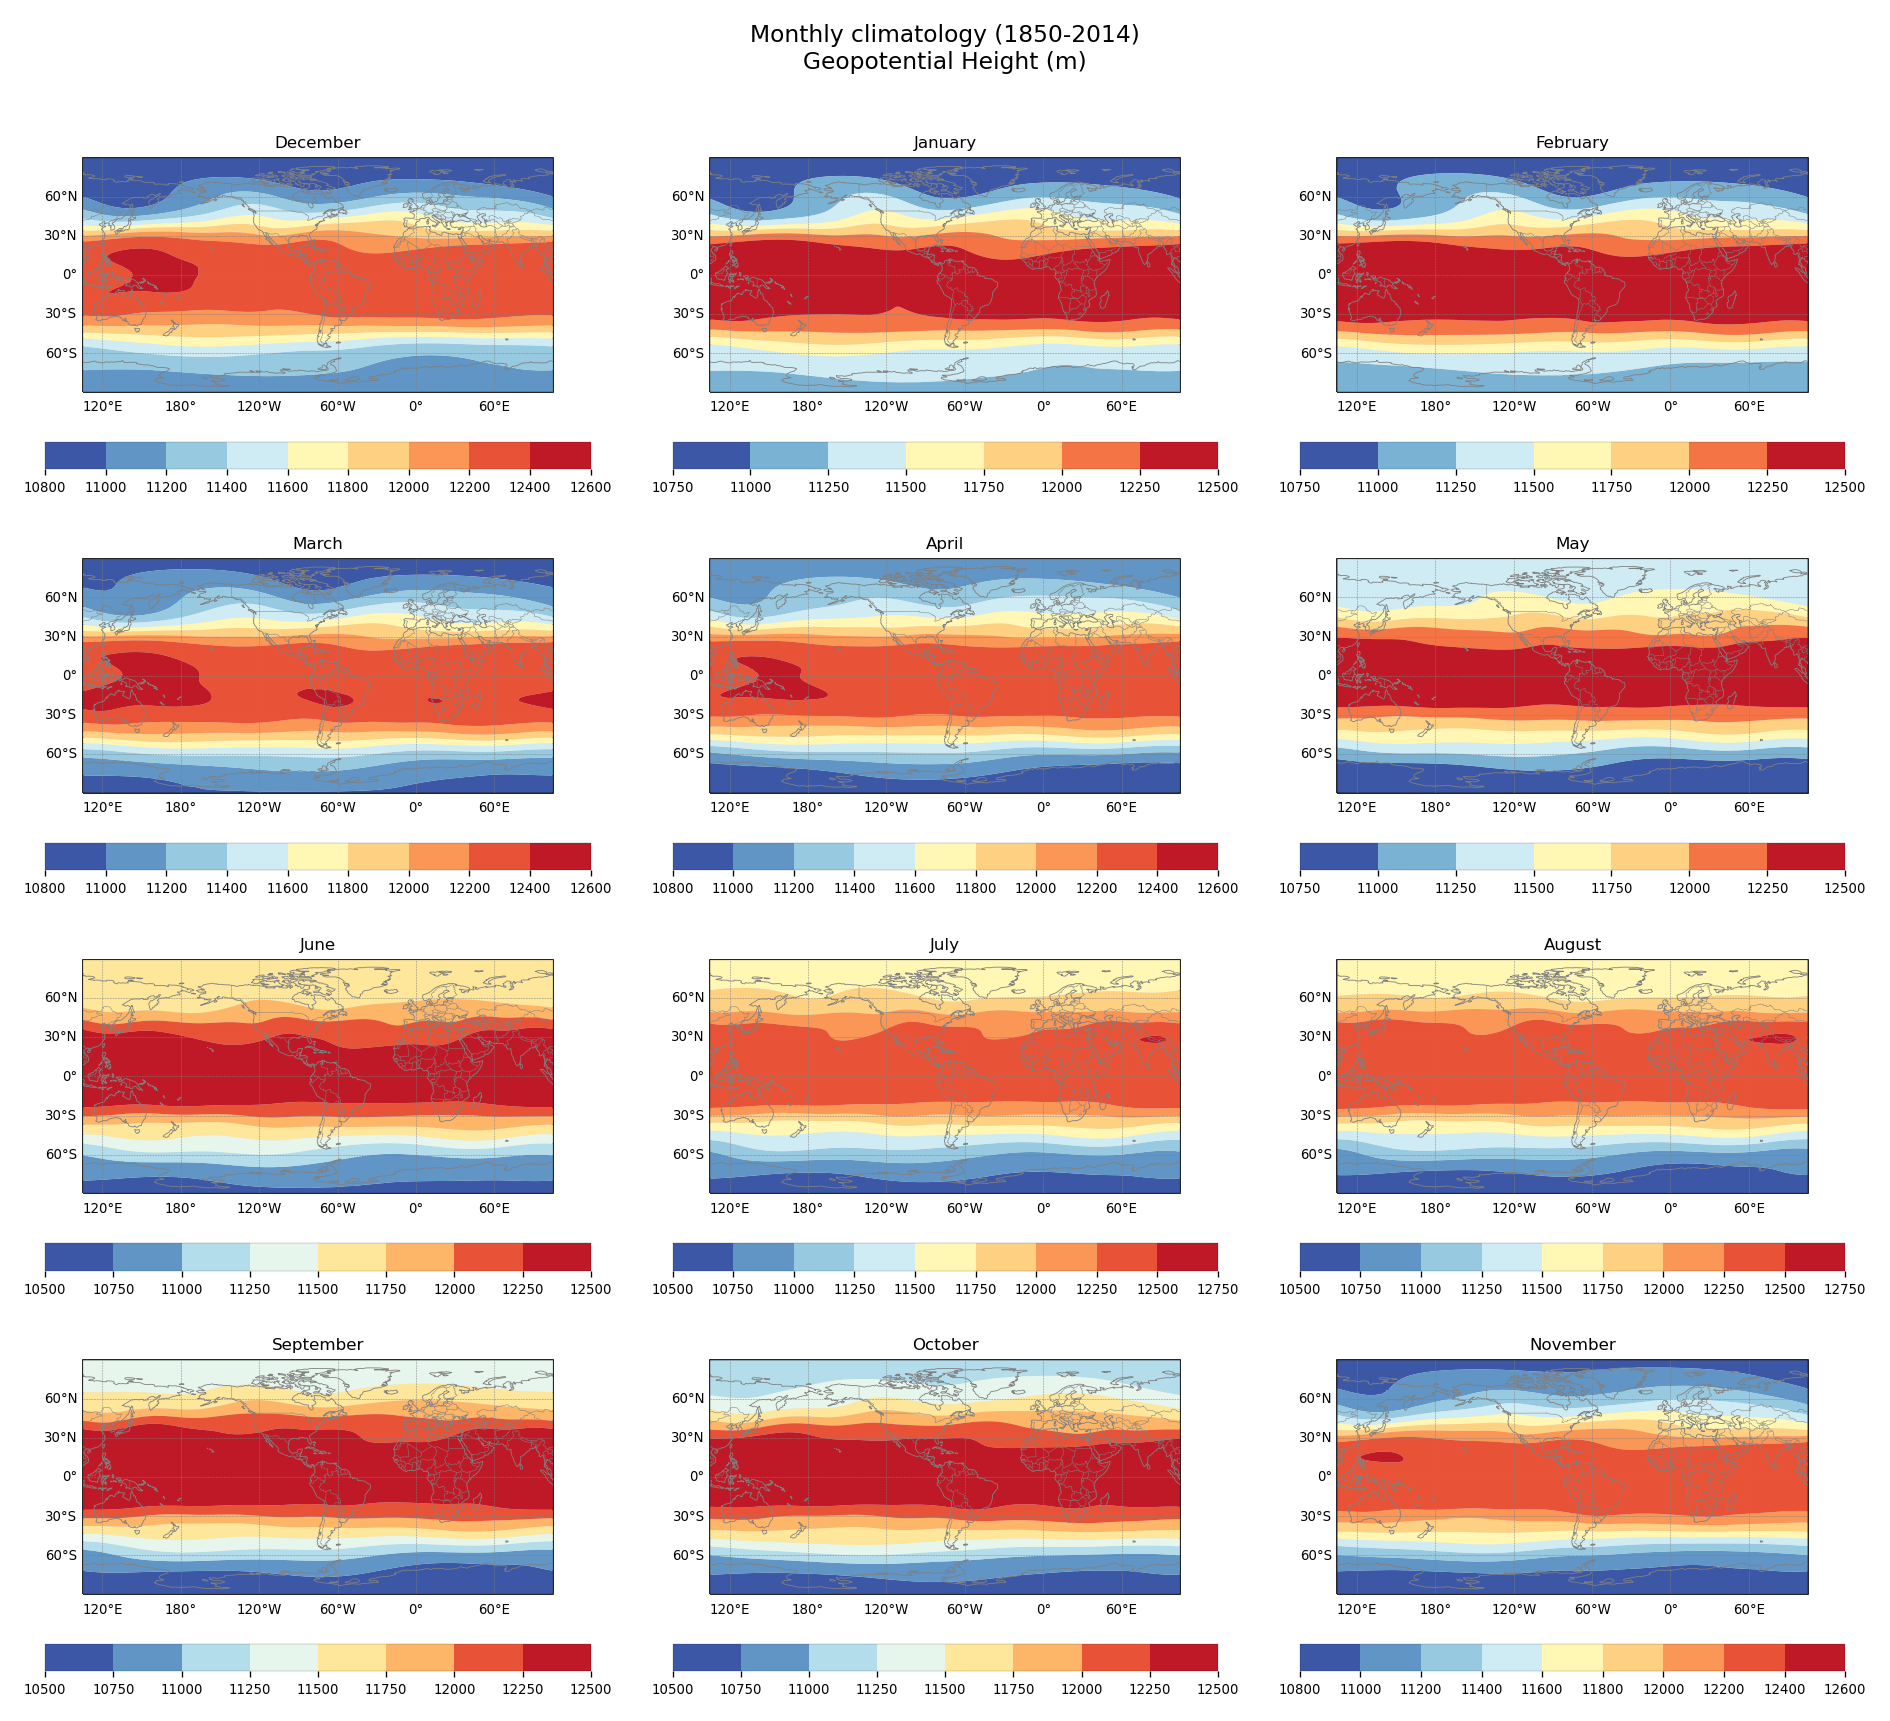
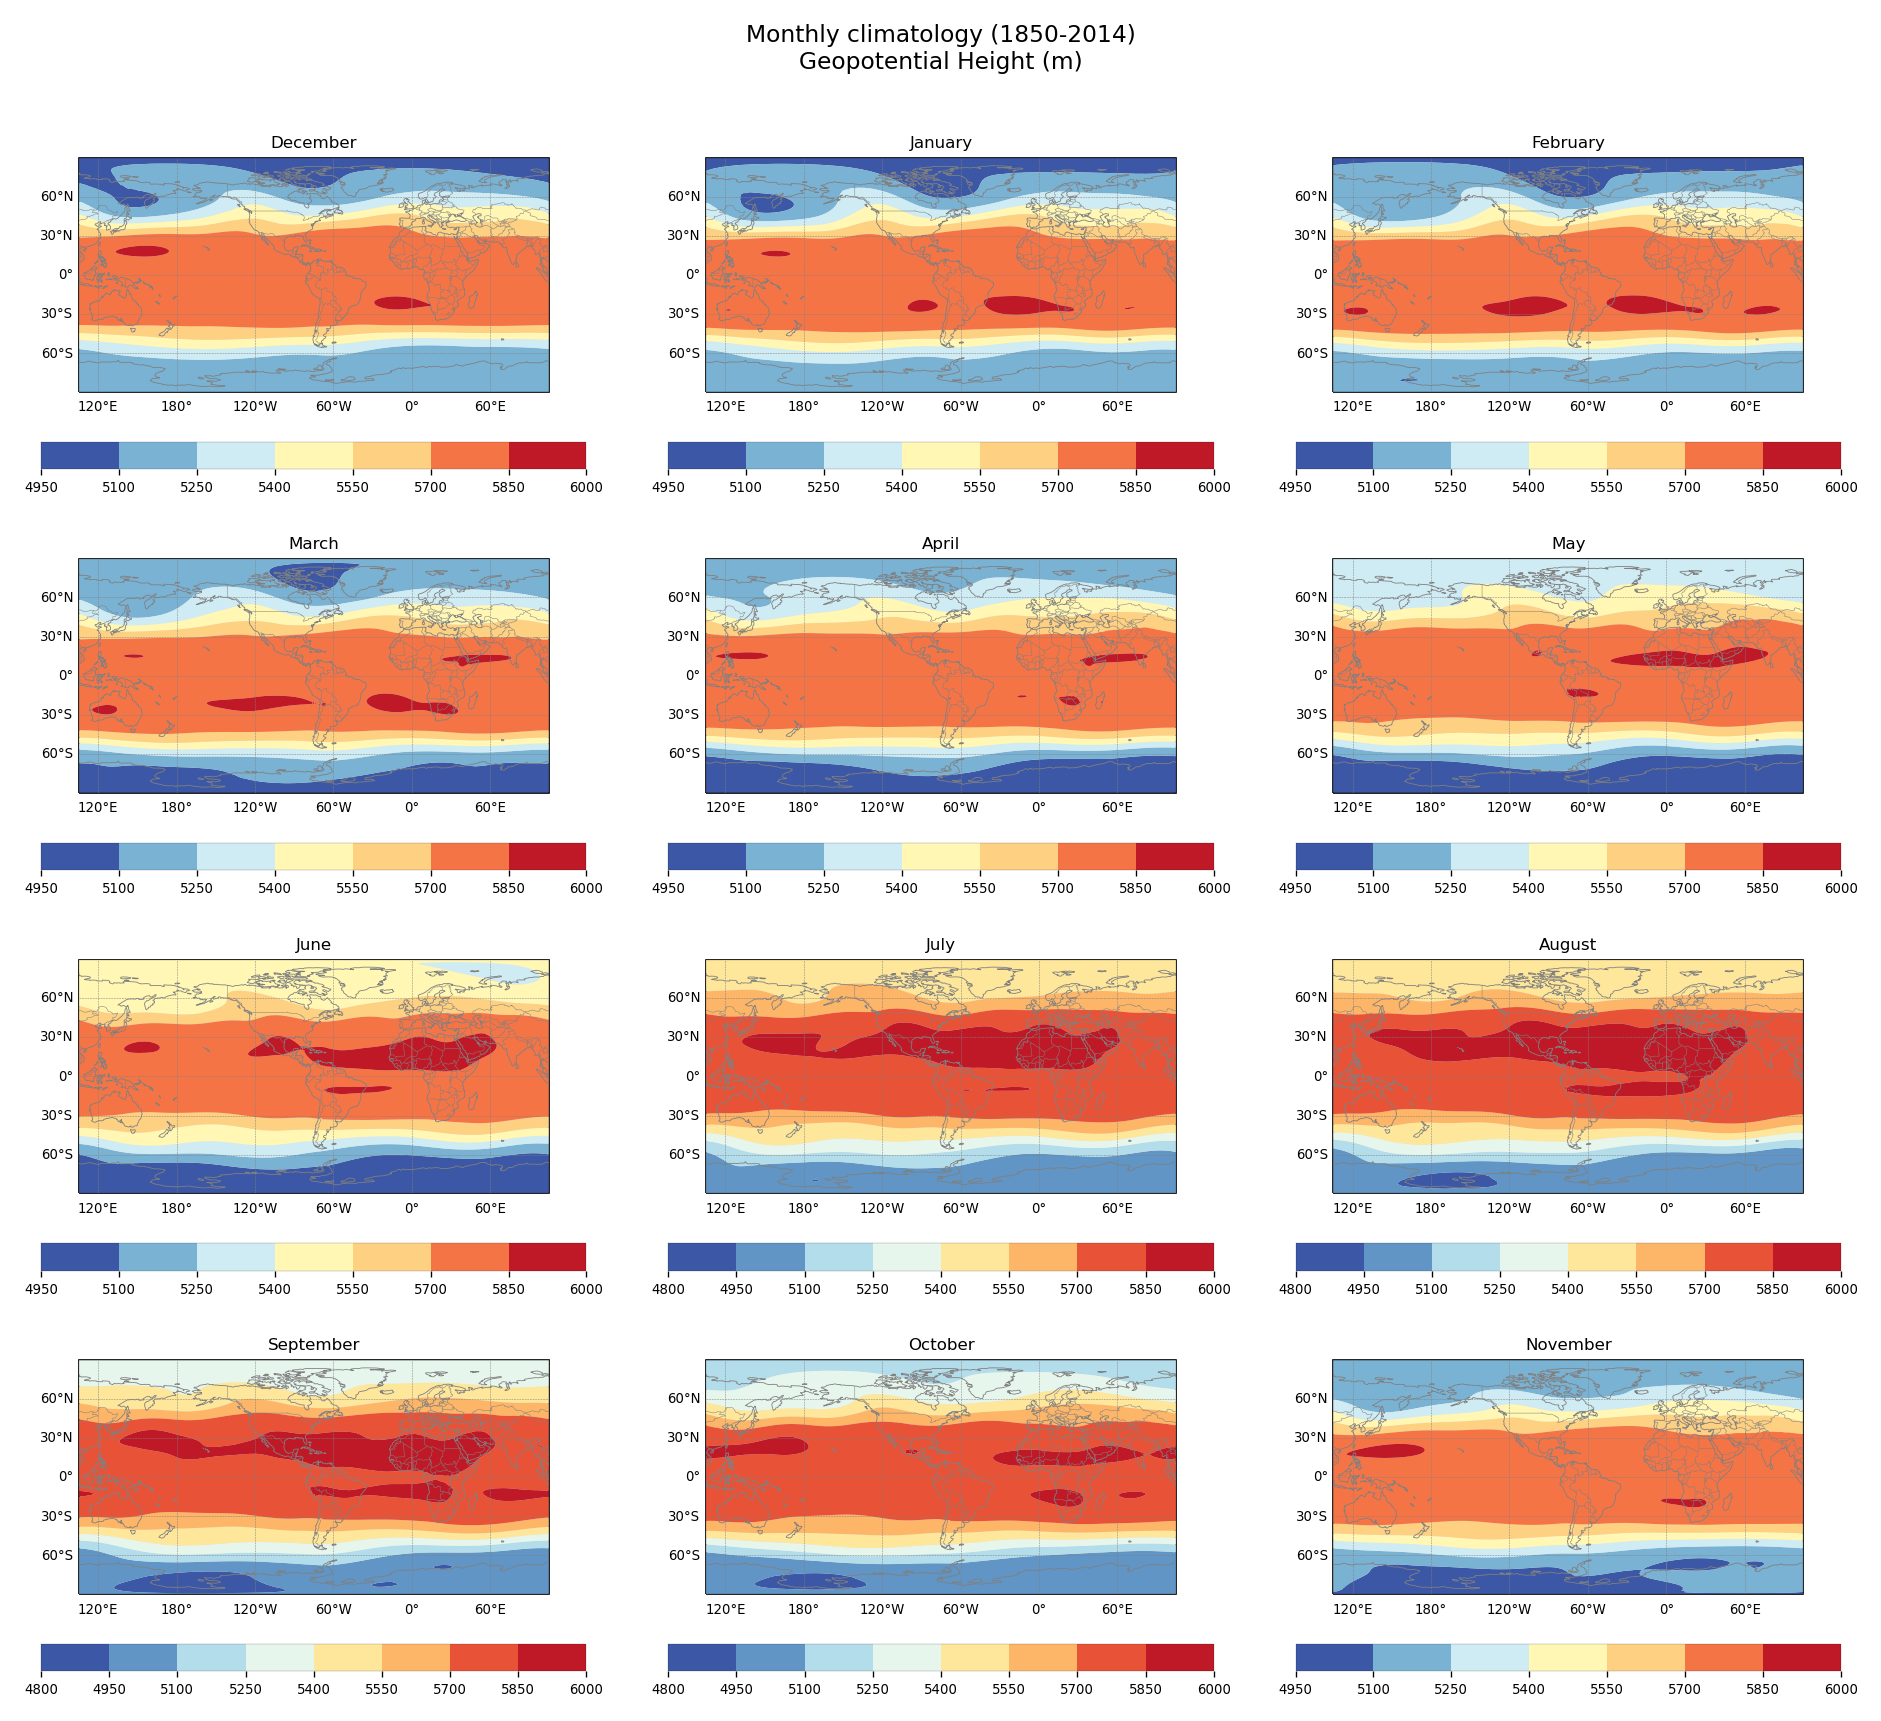
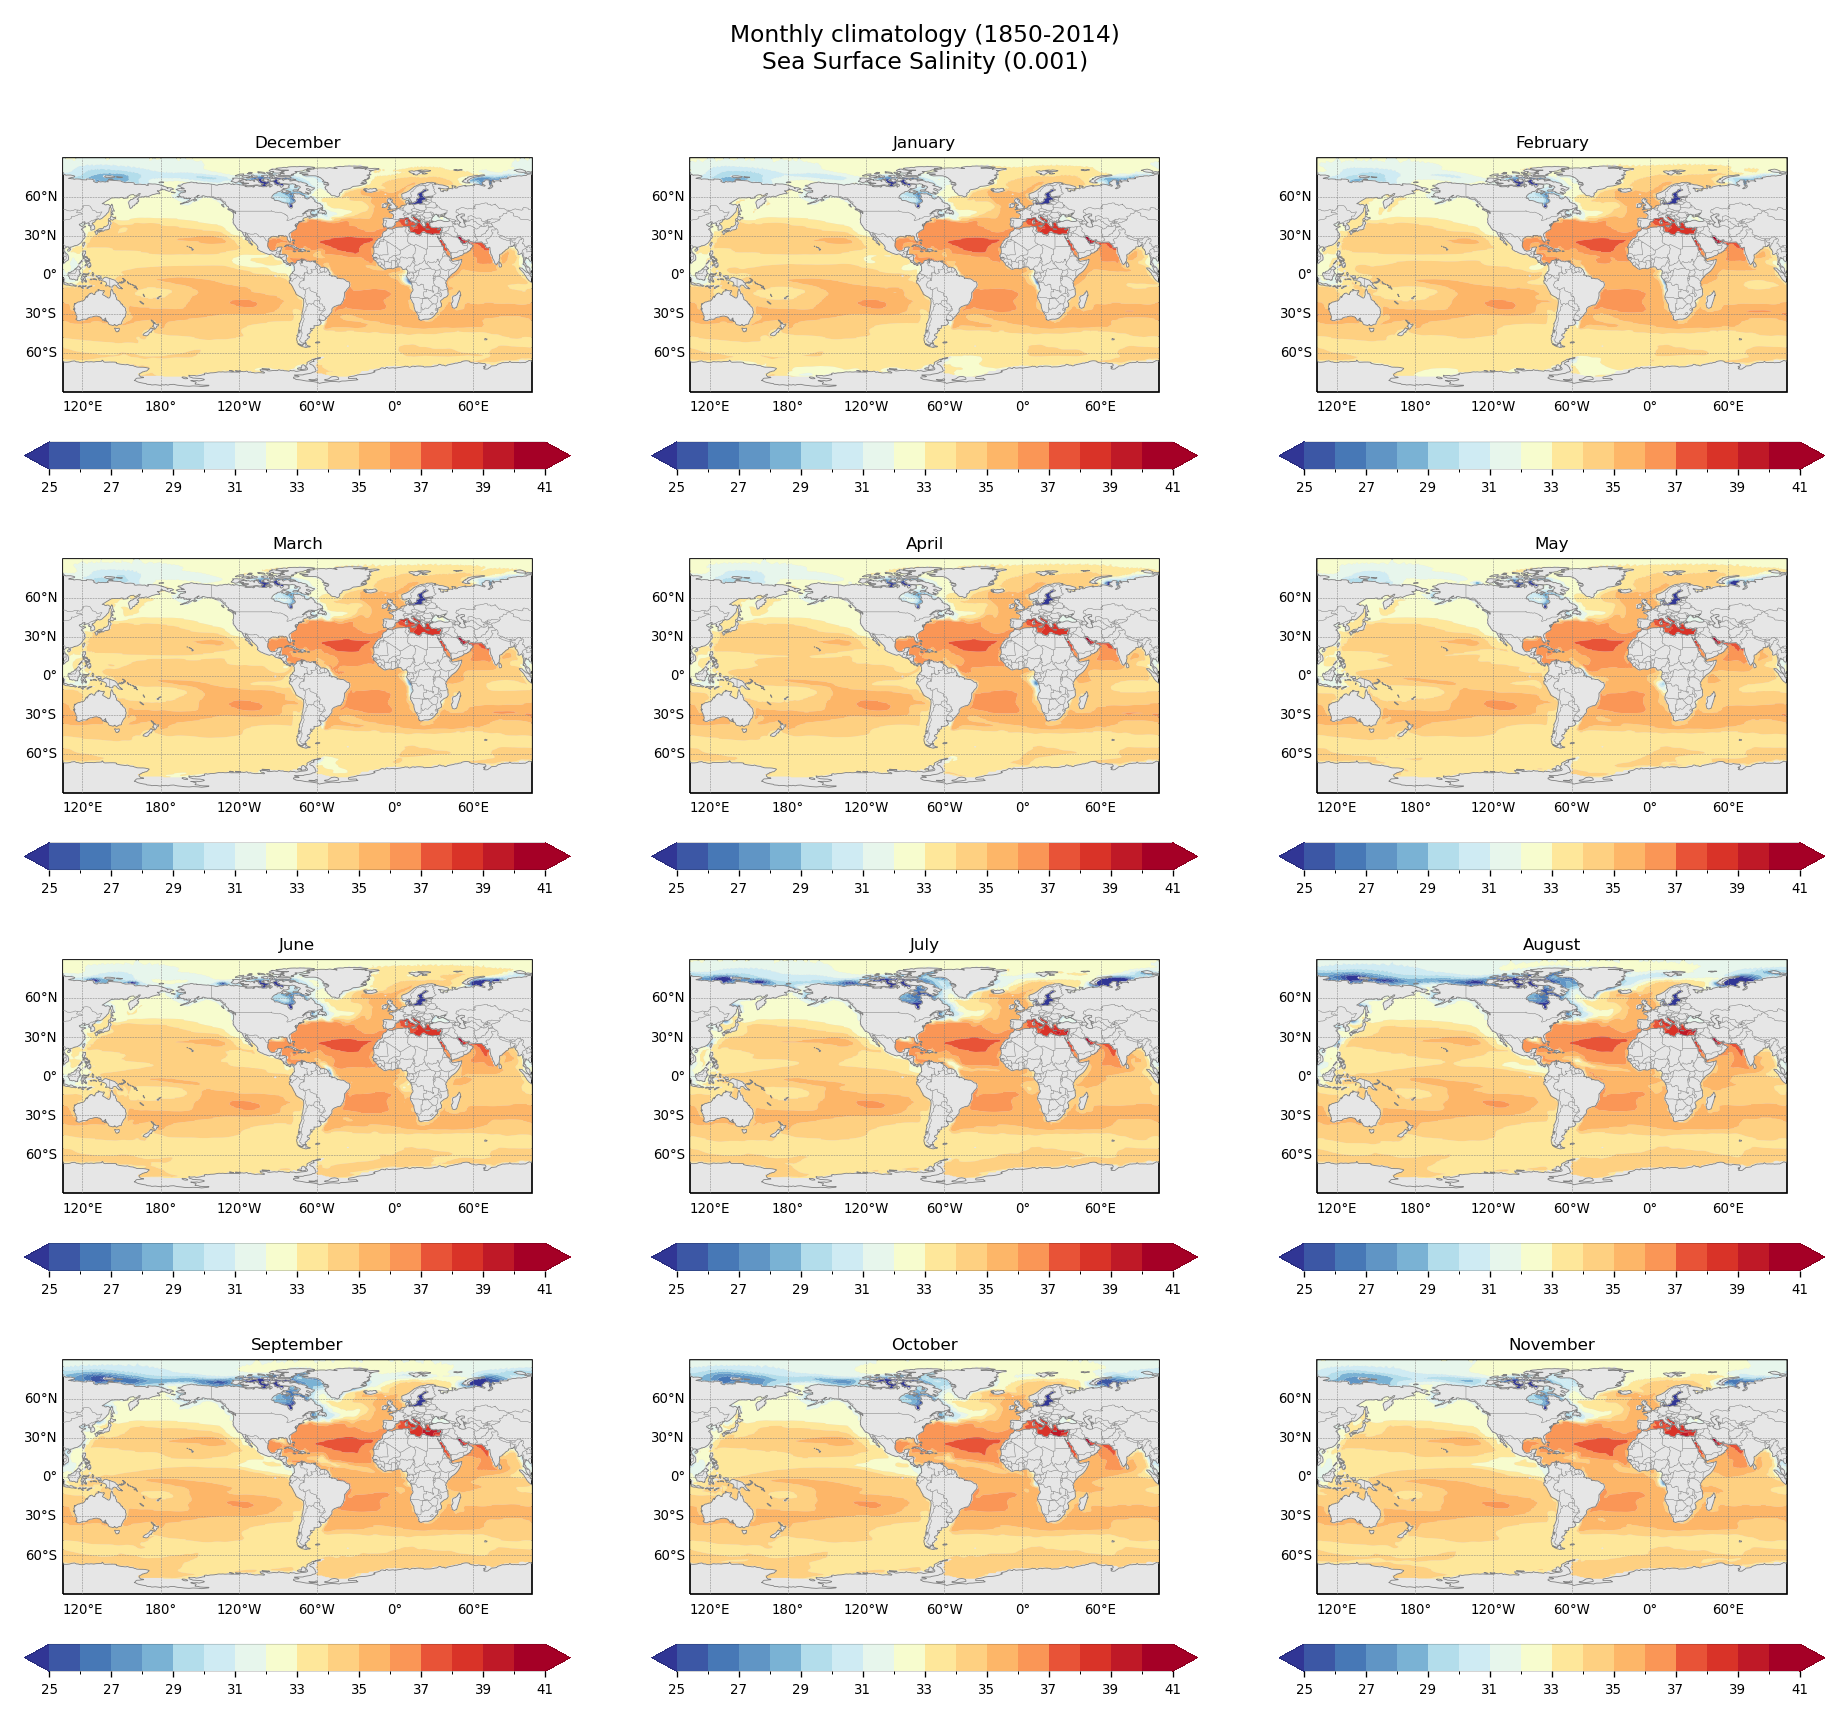
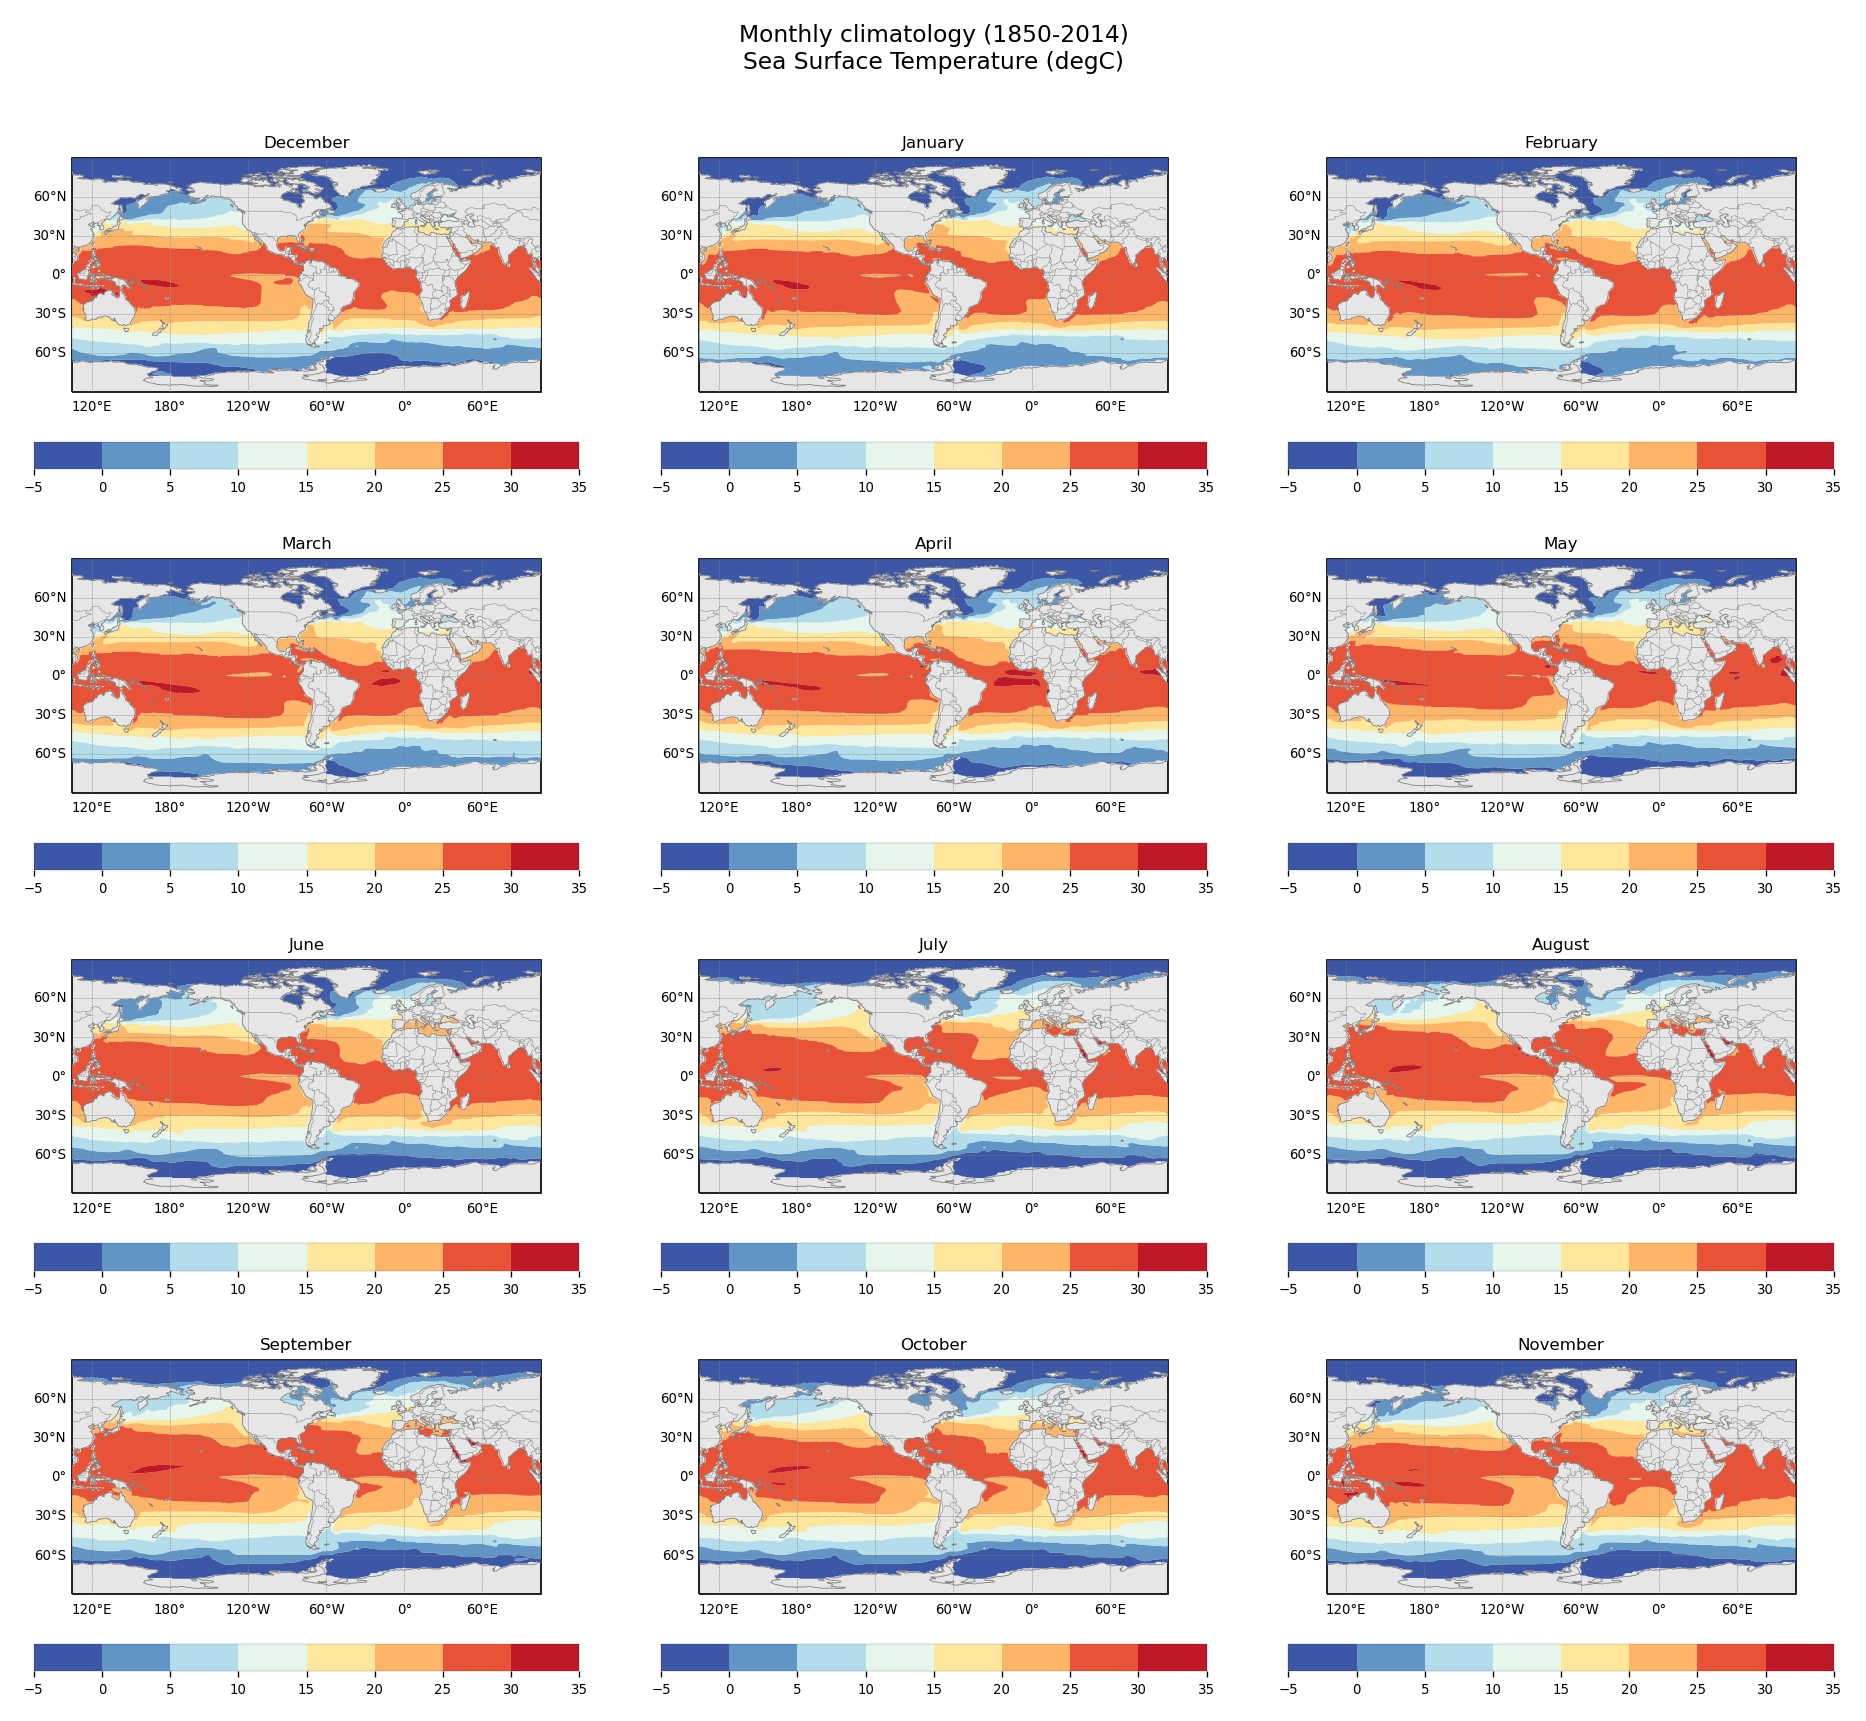
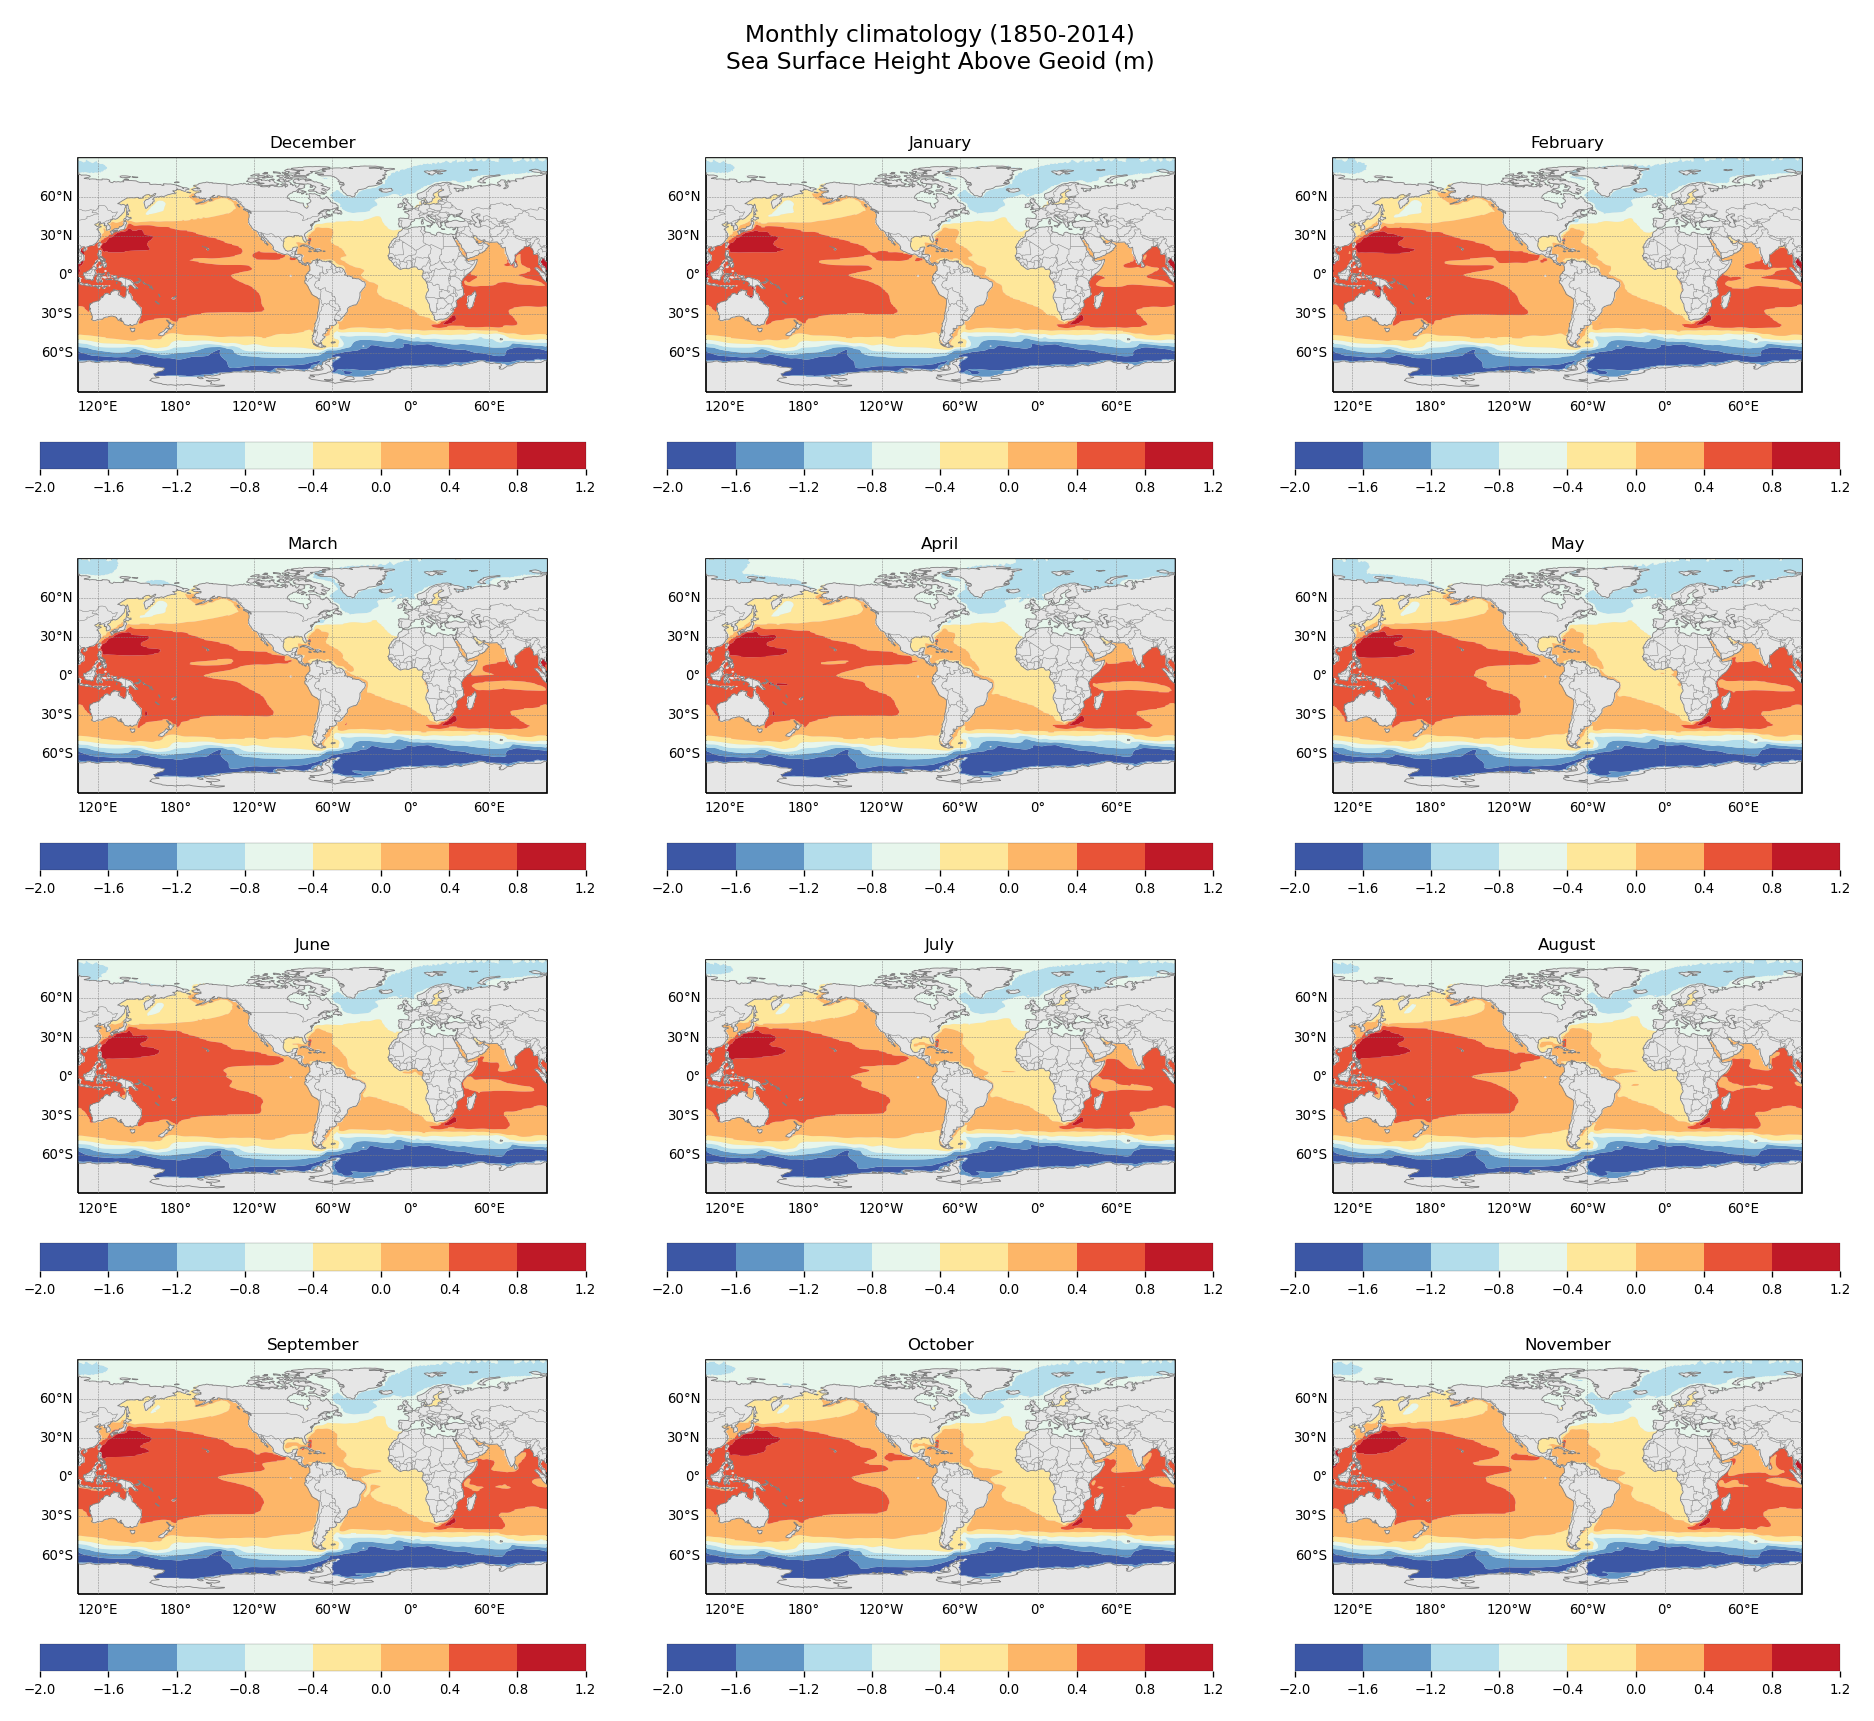
Plot monthly climatologies on both poles
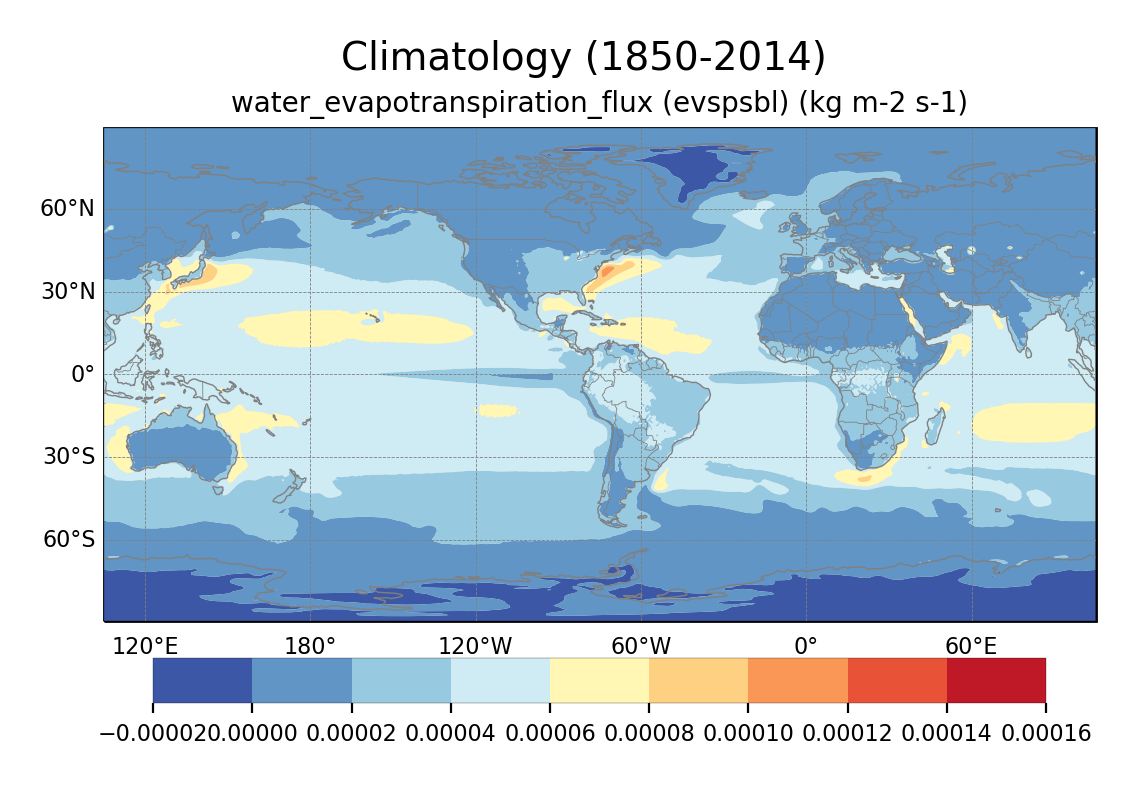
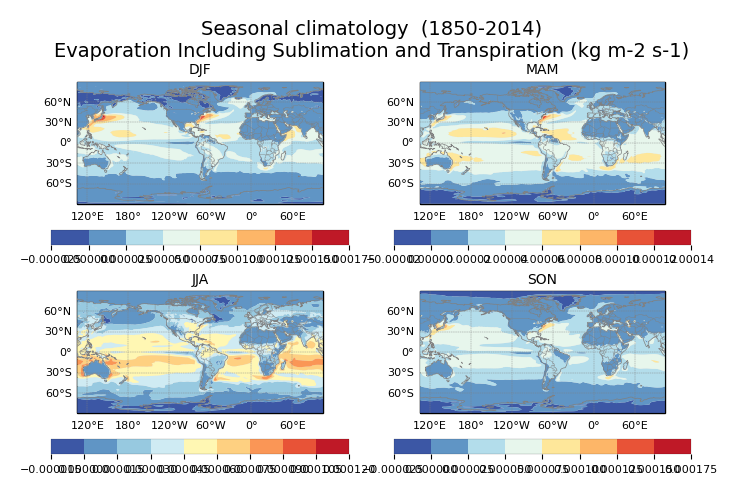
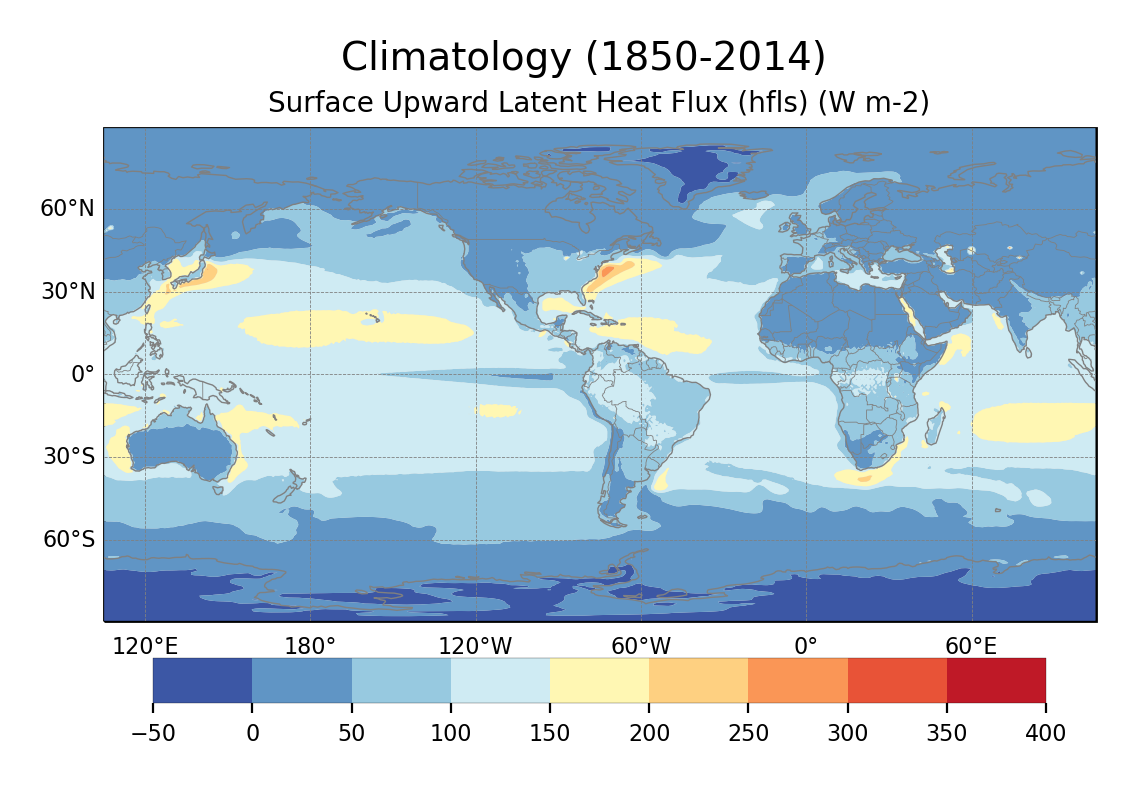
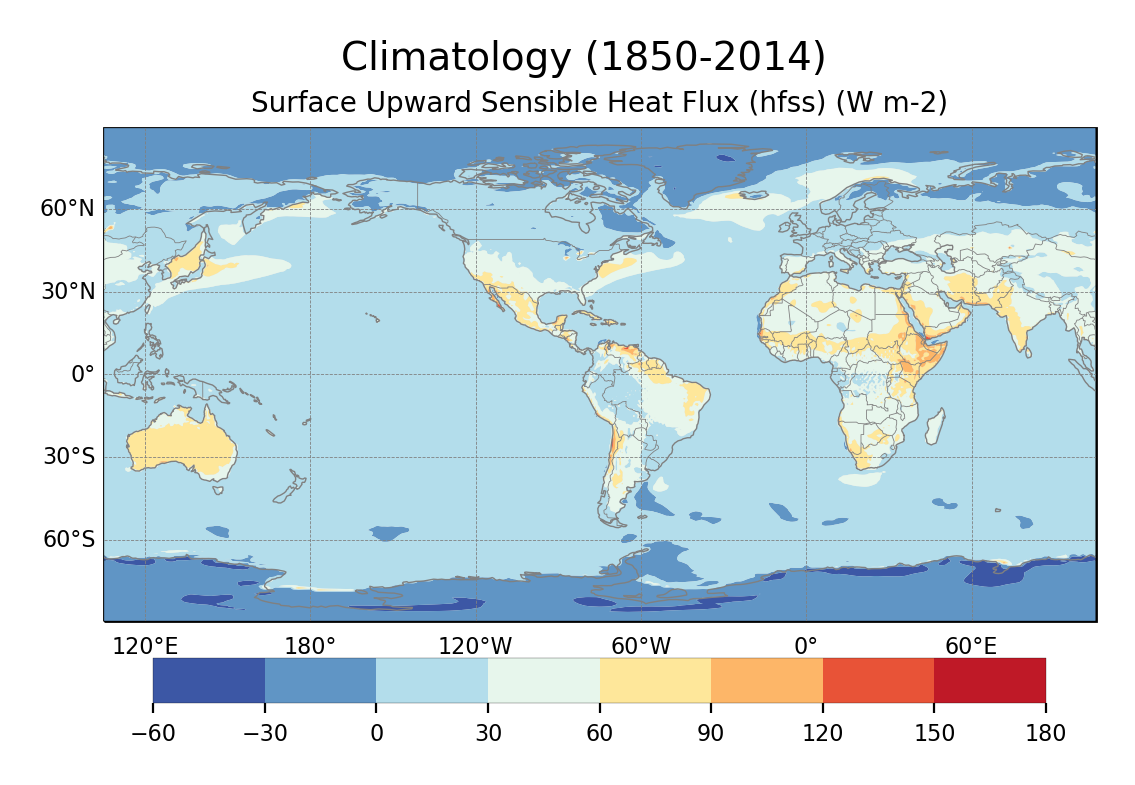
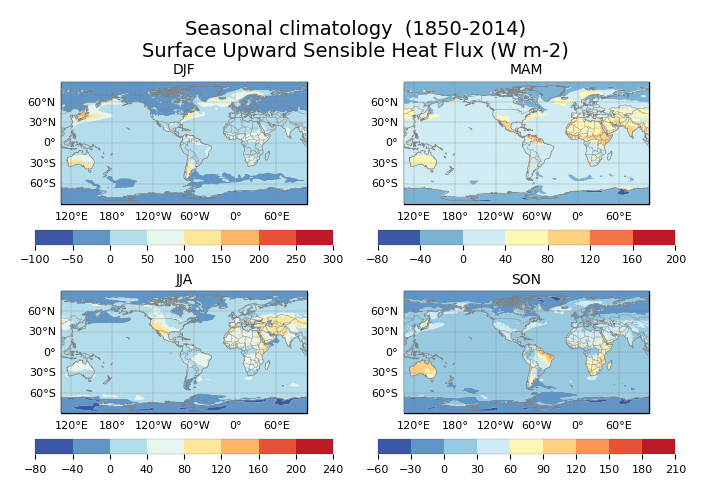
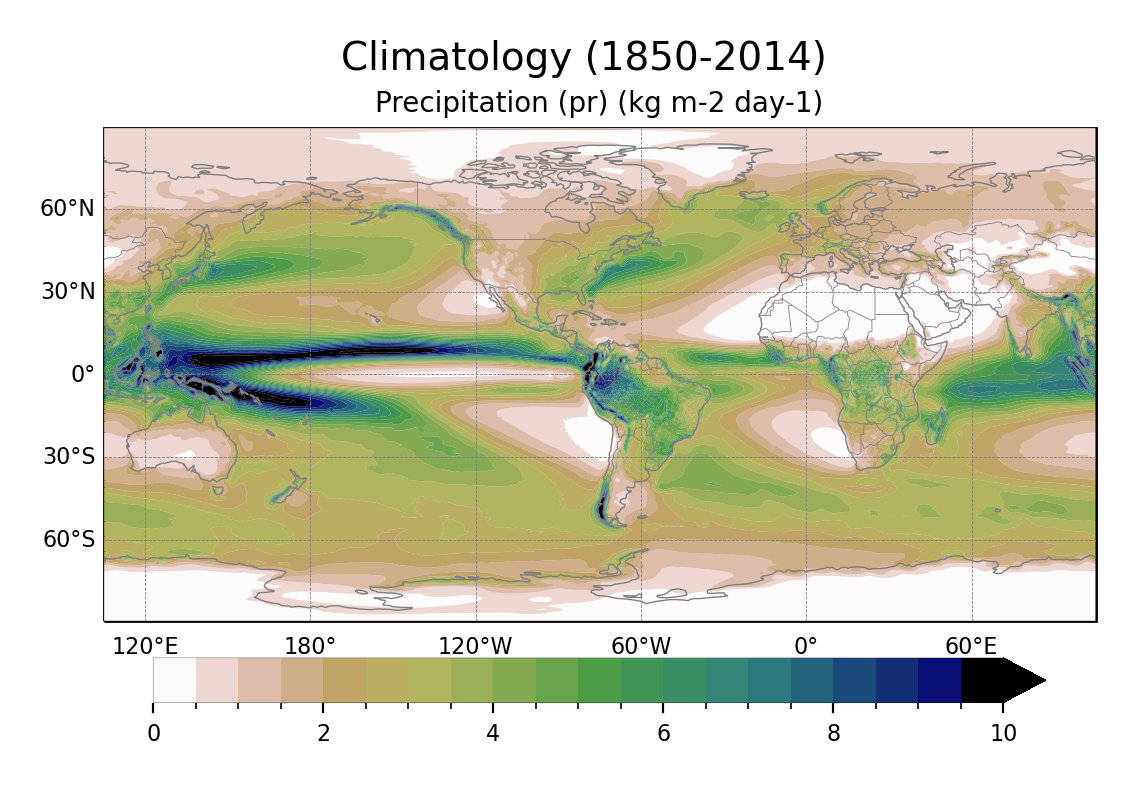
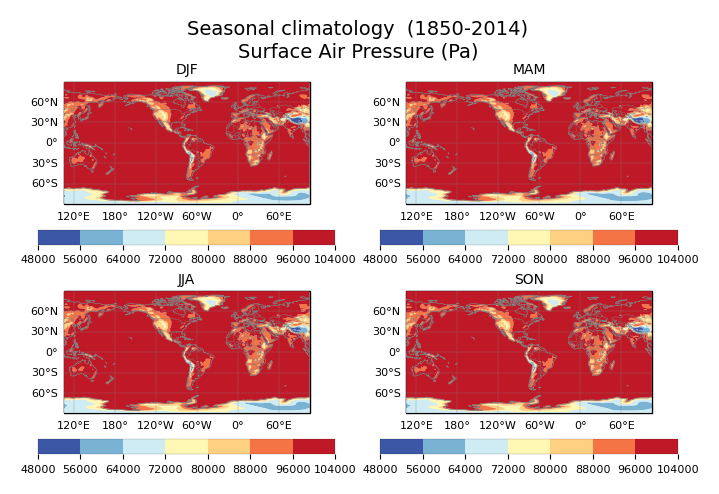
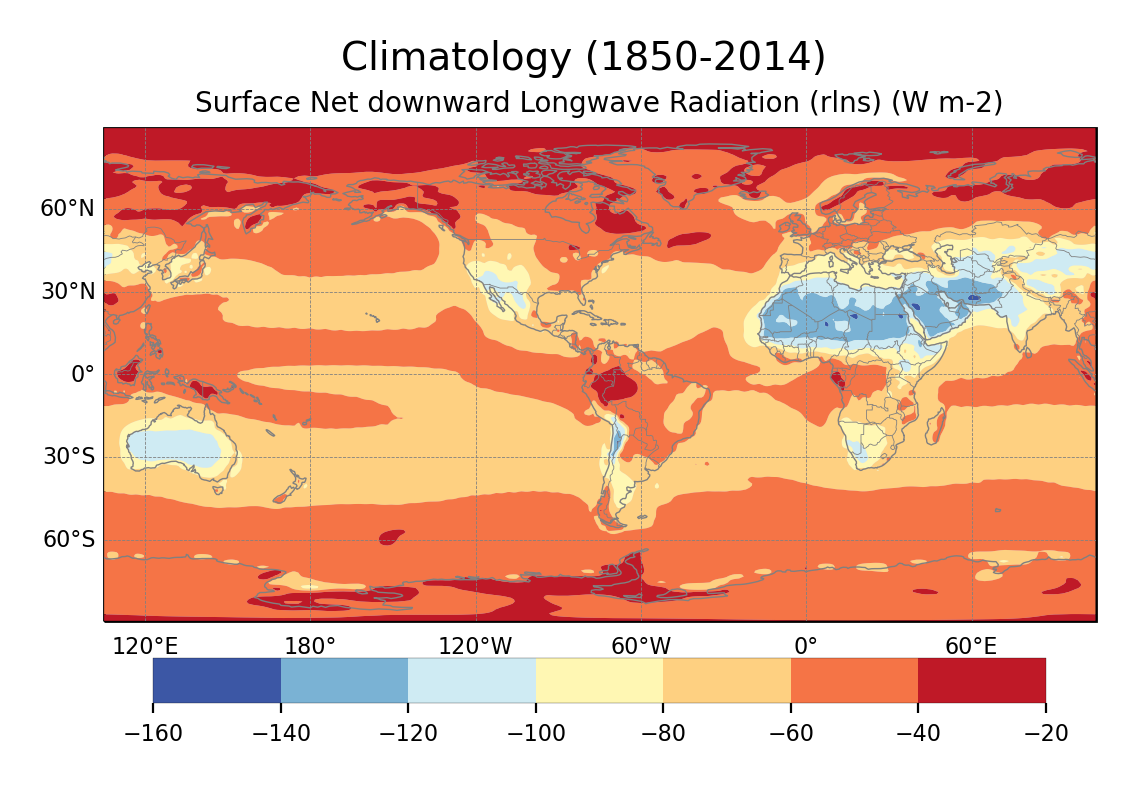
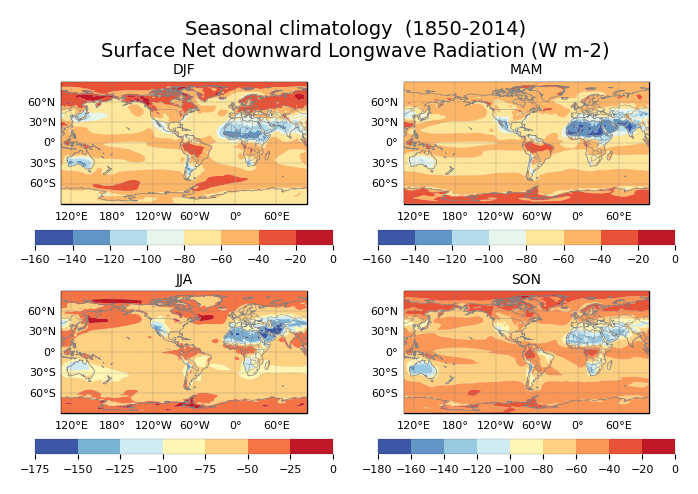
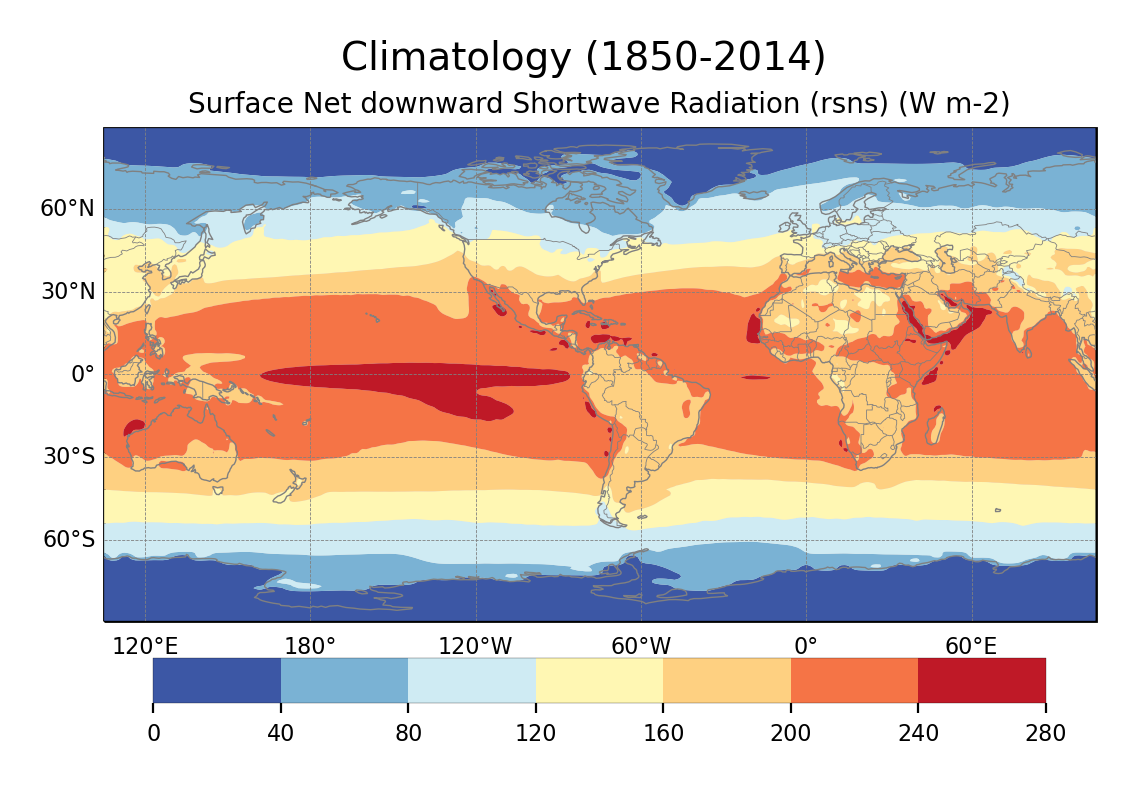
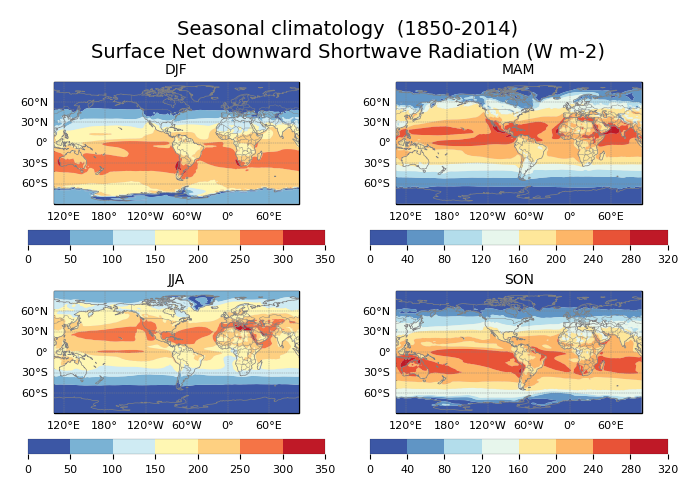
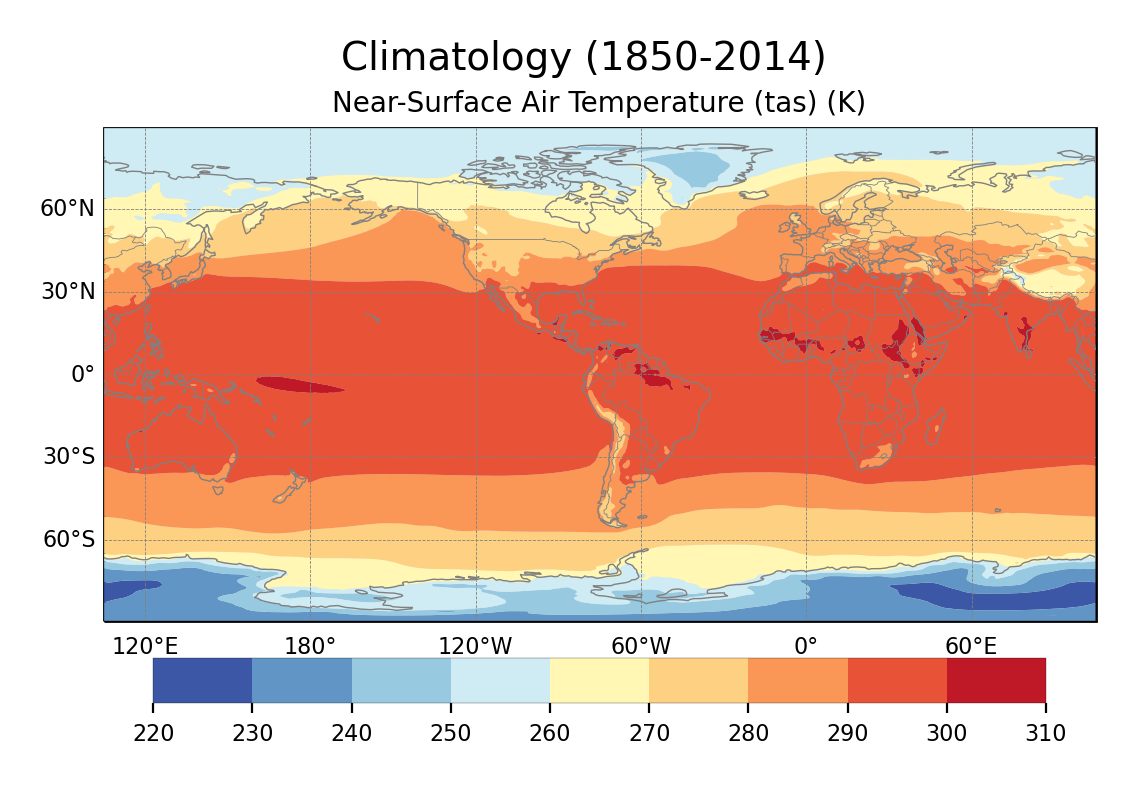
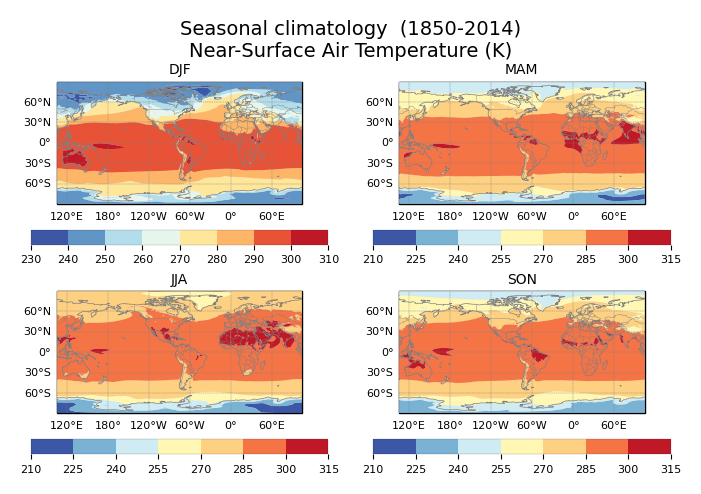
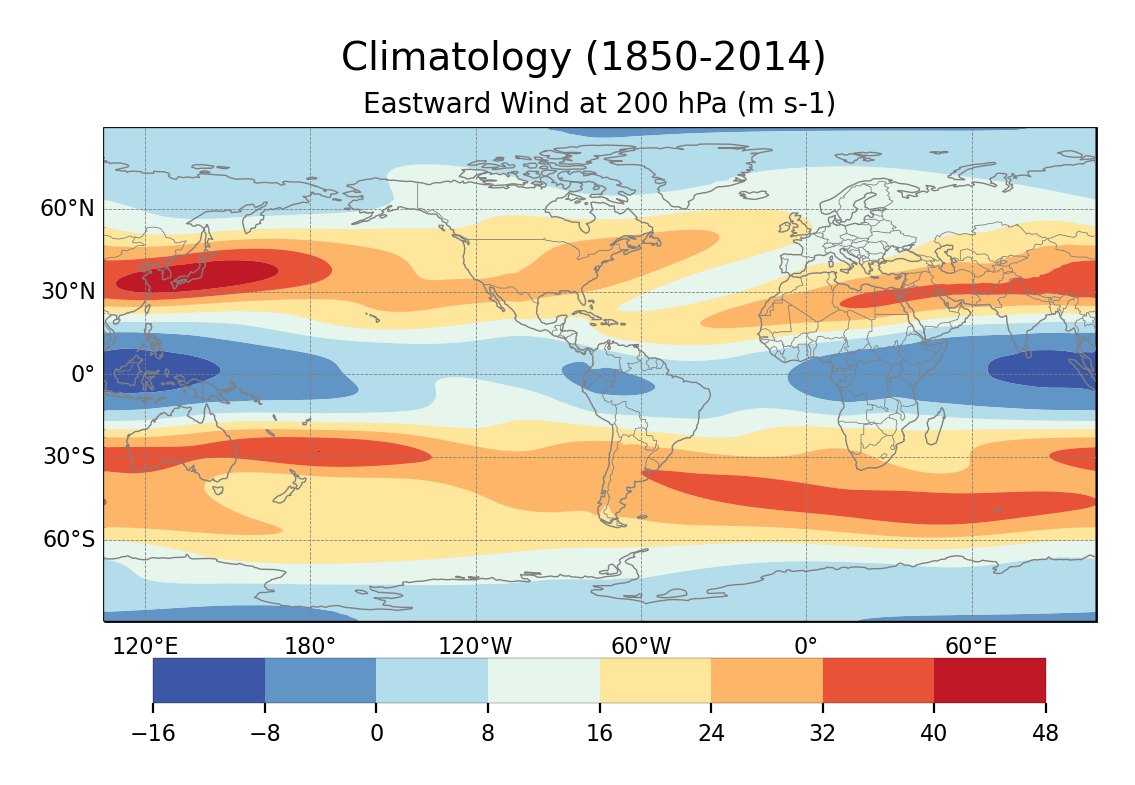
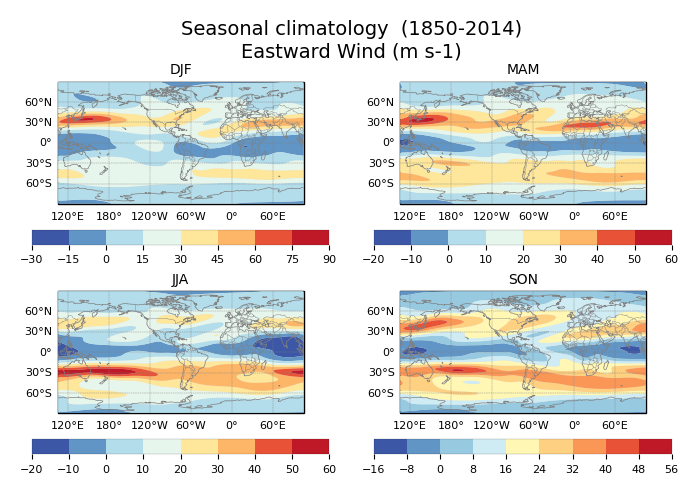
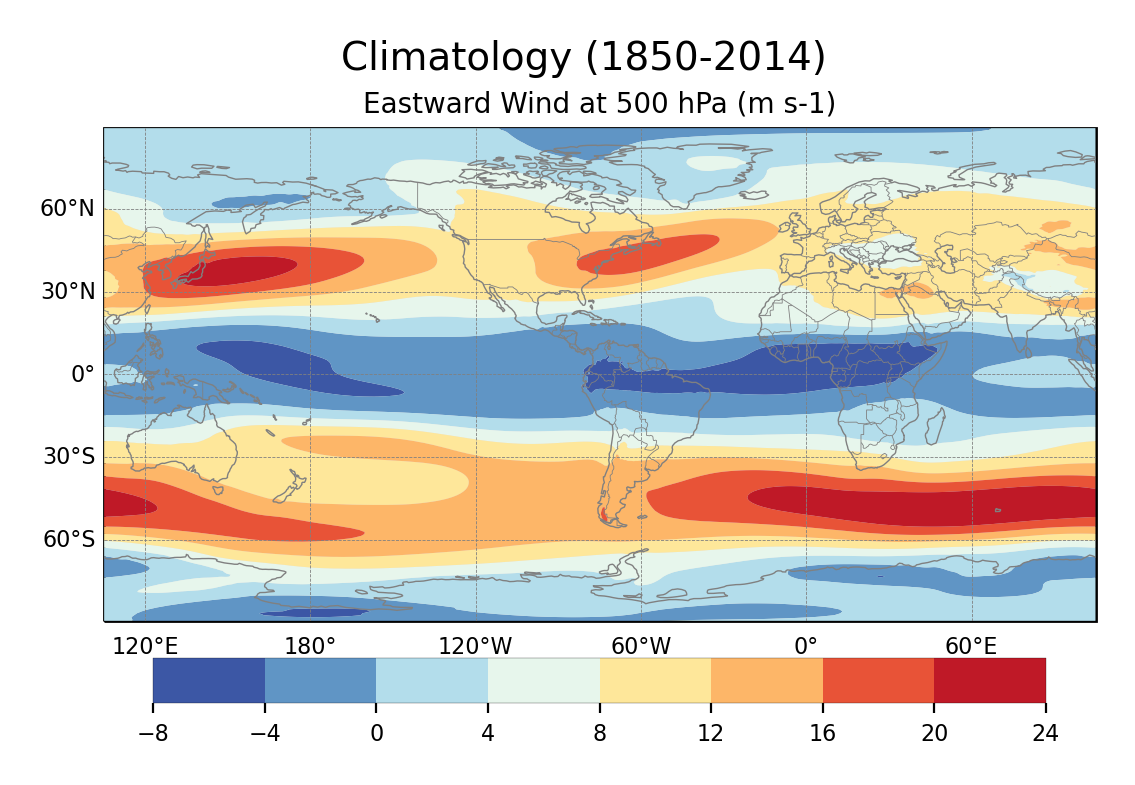
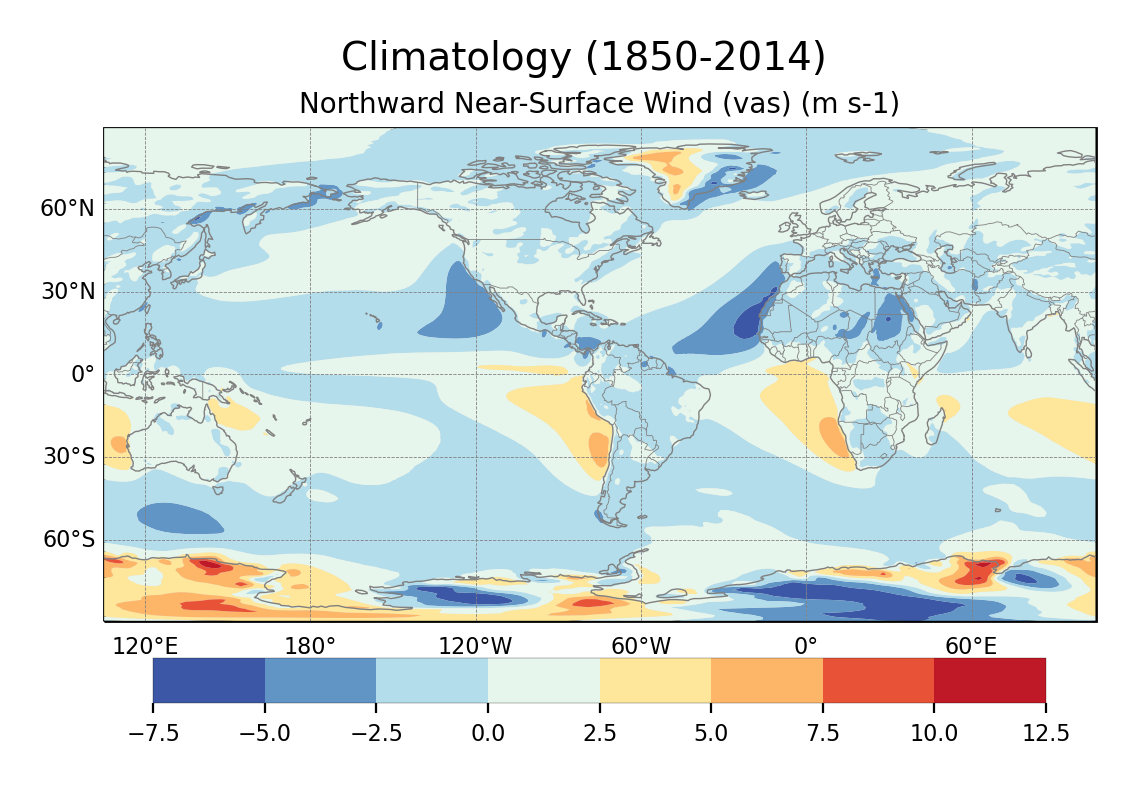
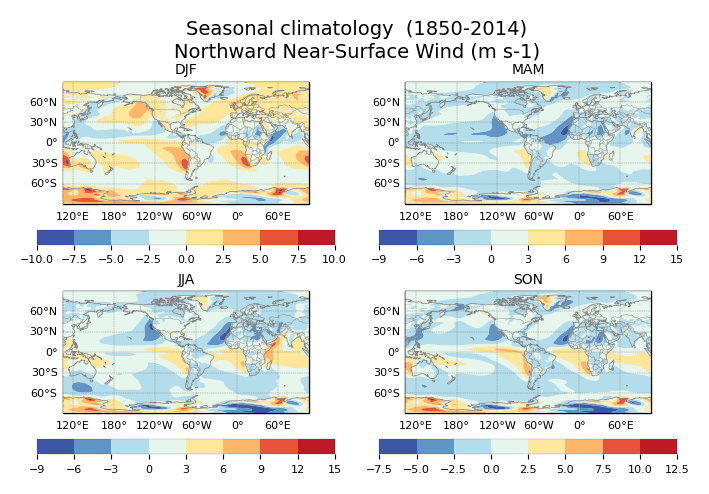
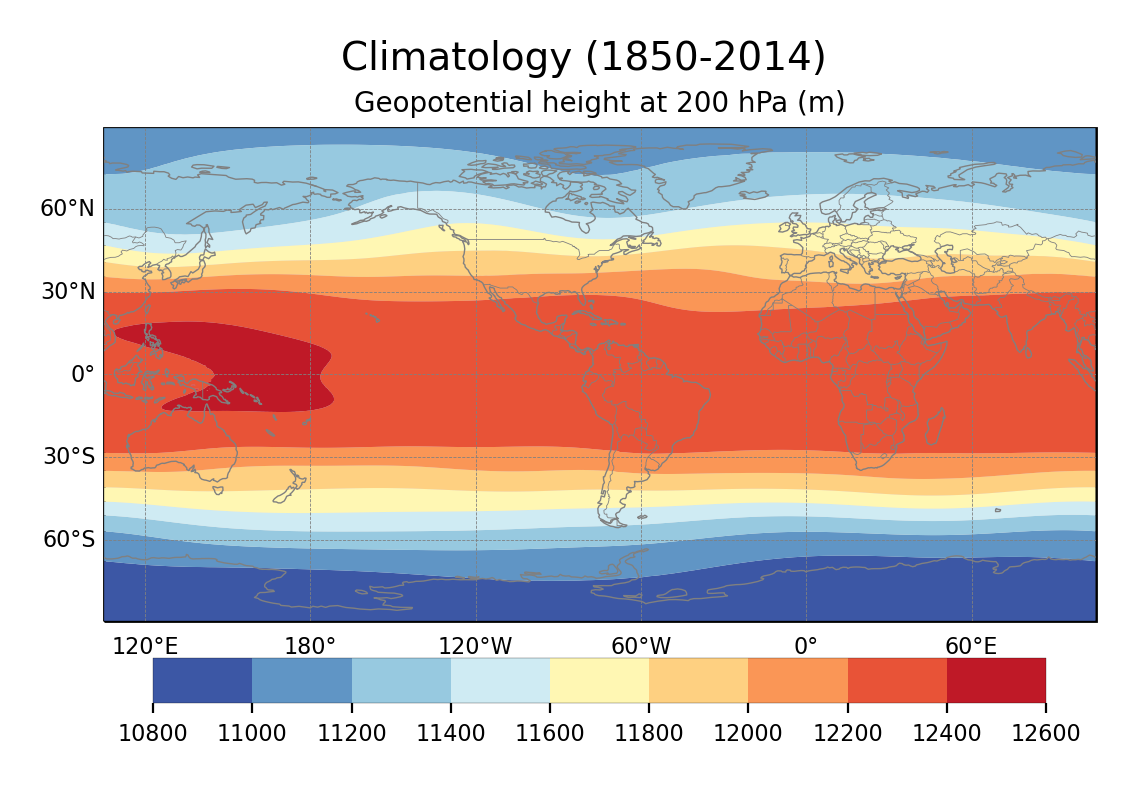
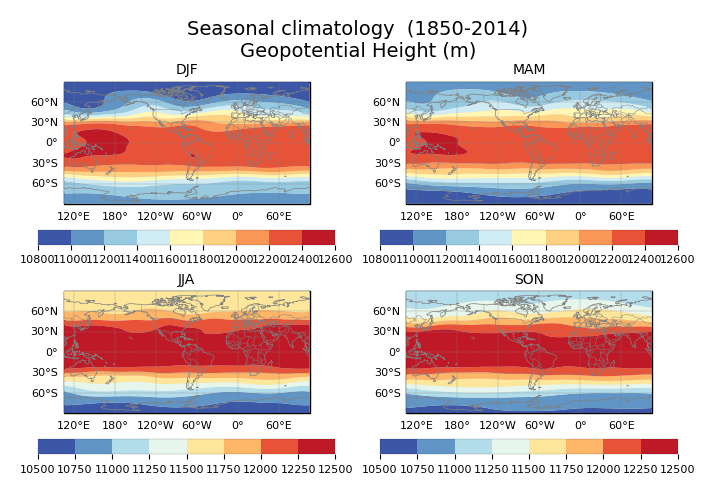
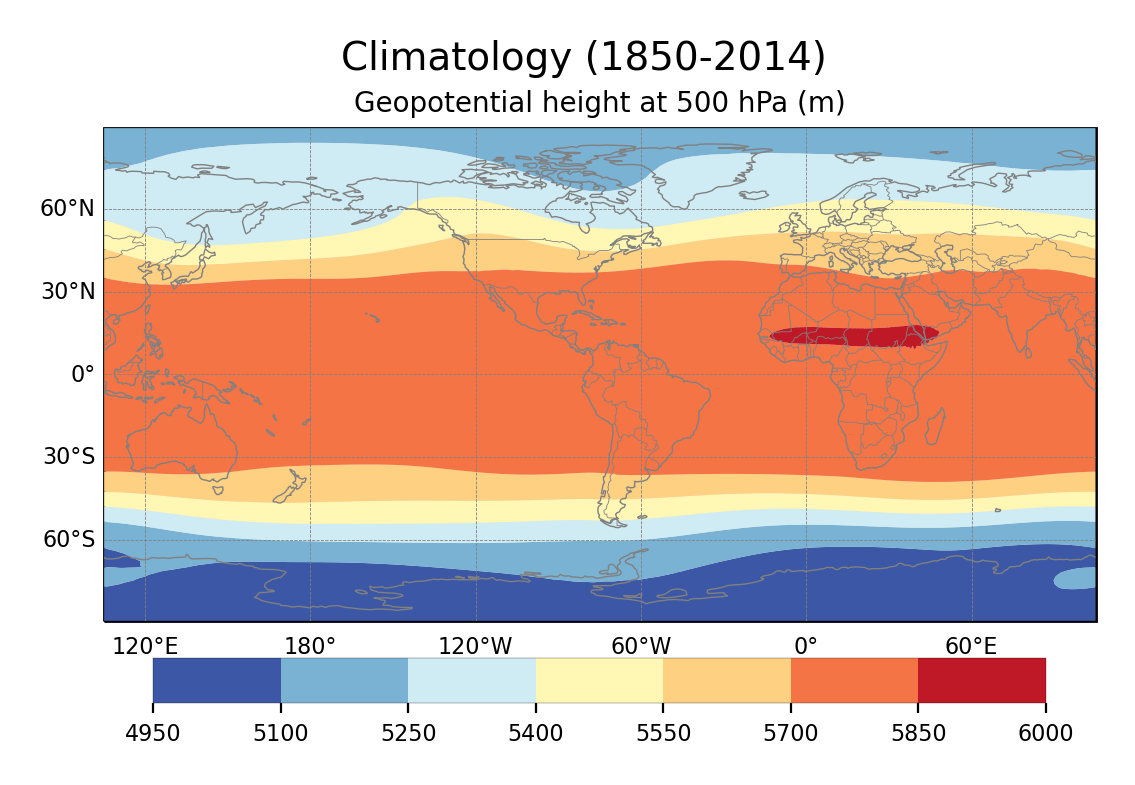
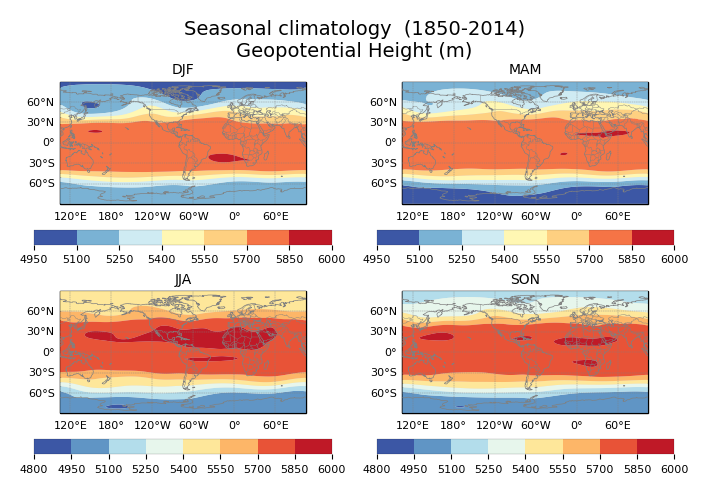
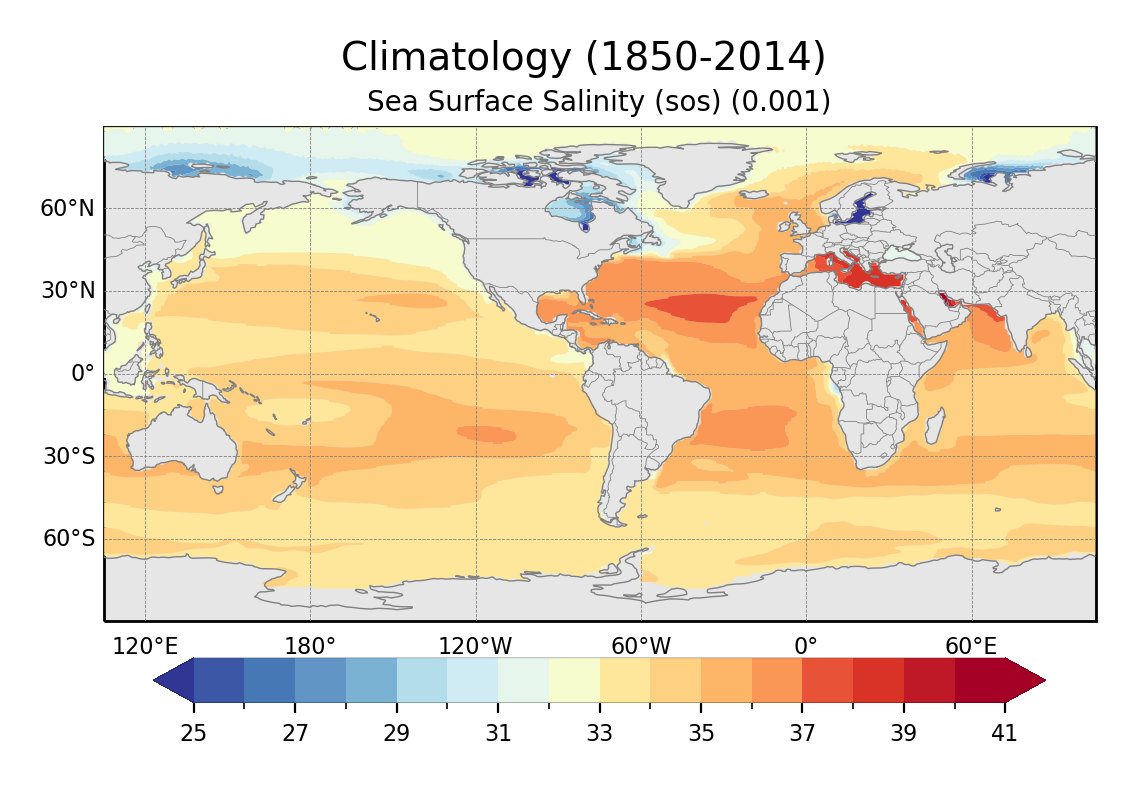
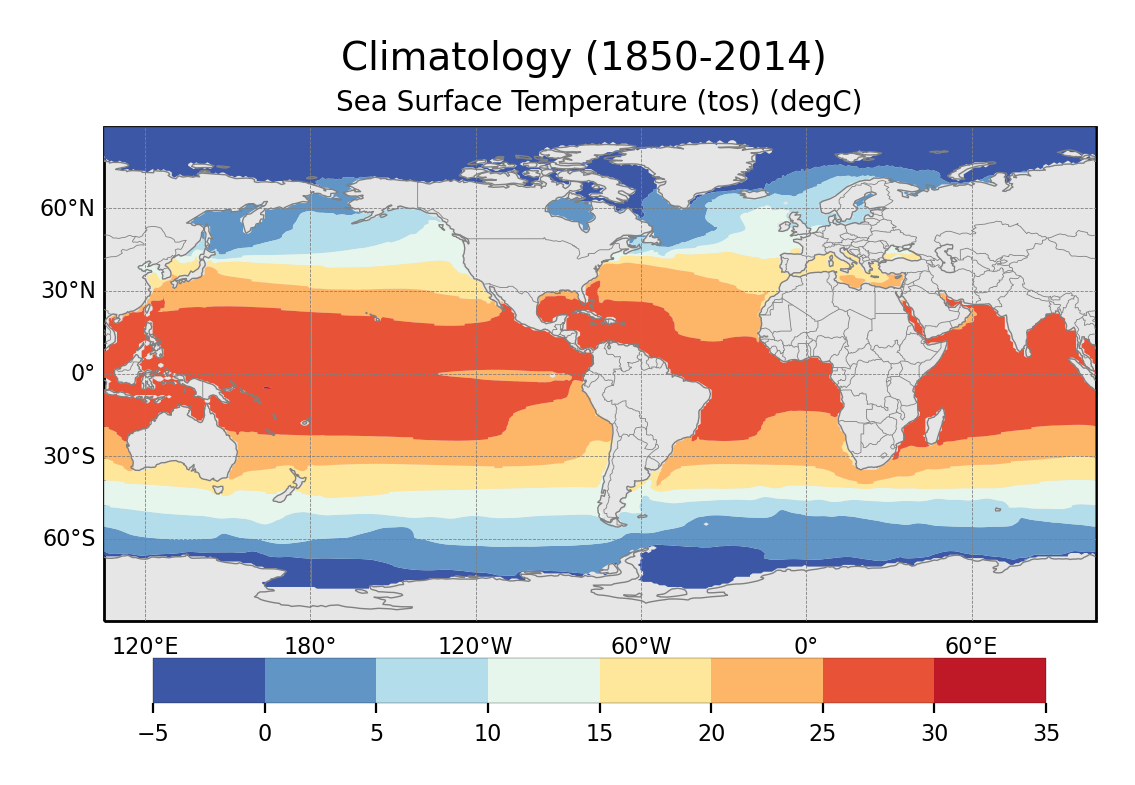
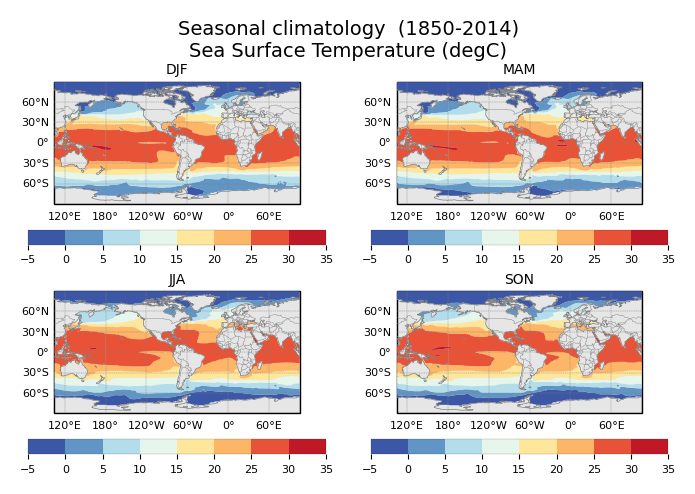
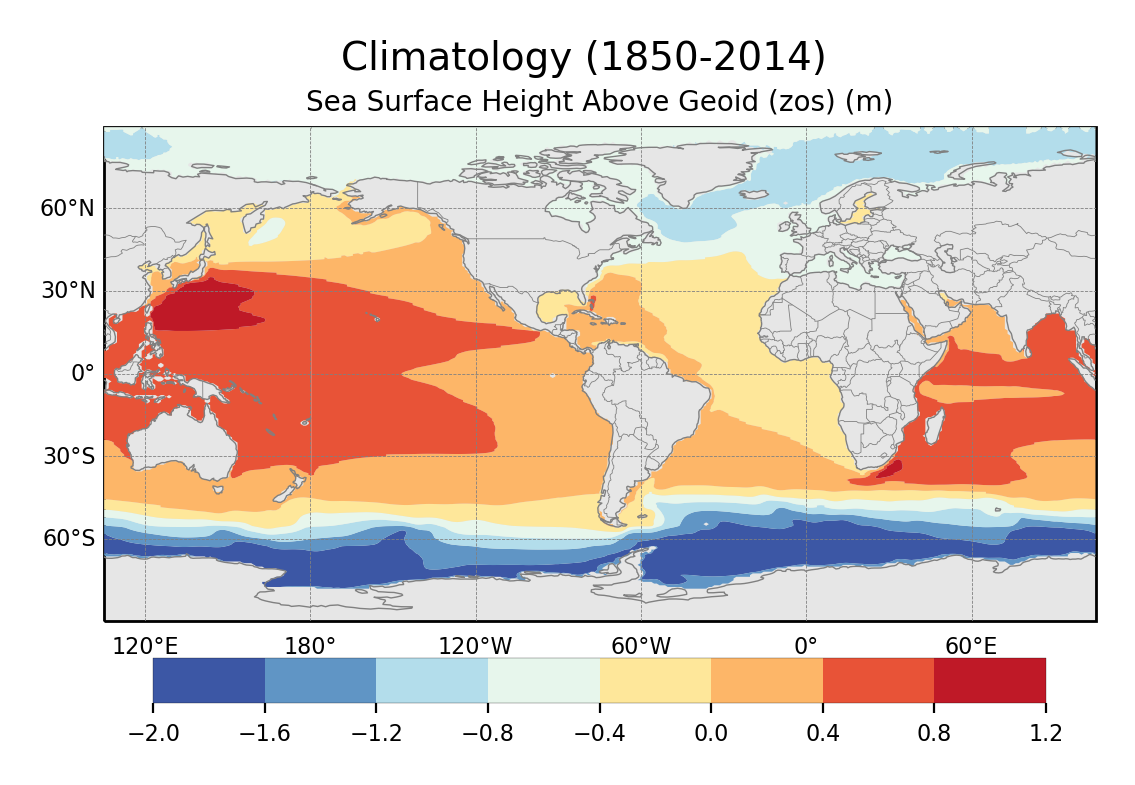
Plot climatologies
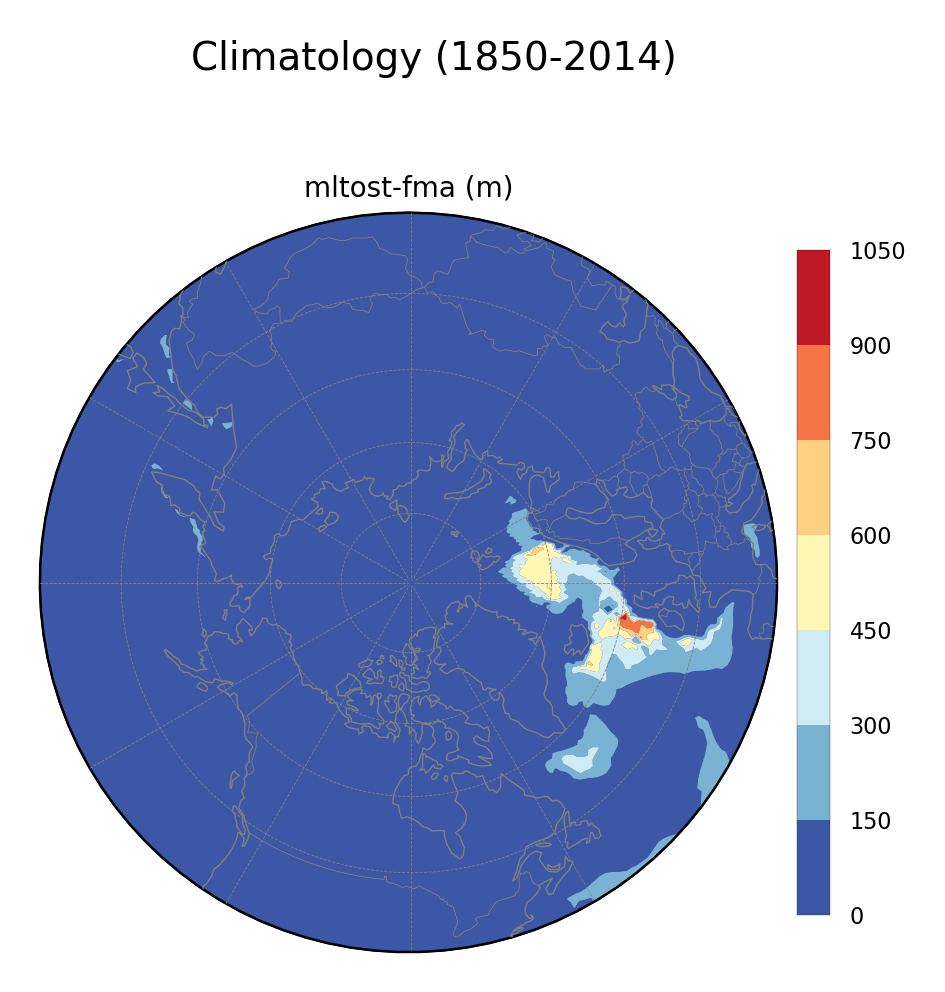
Plot climatologies
main_log.txt | main_log_debug.txt | recipe_monitor.yml | figures | data