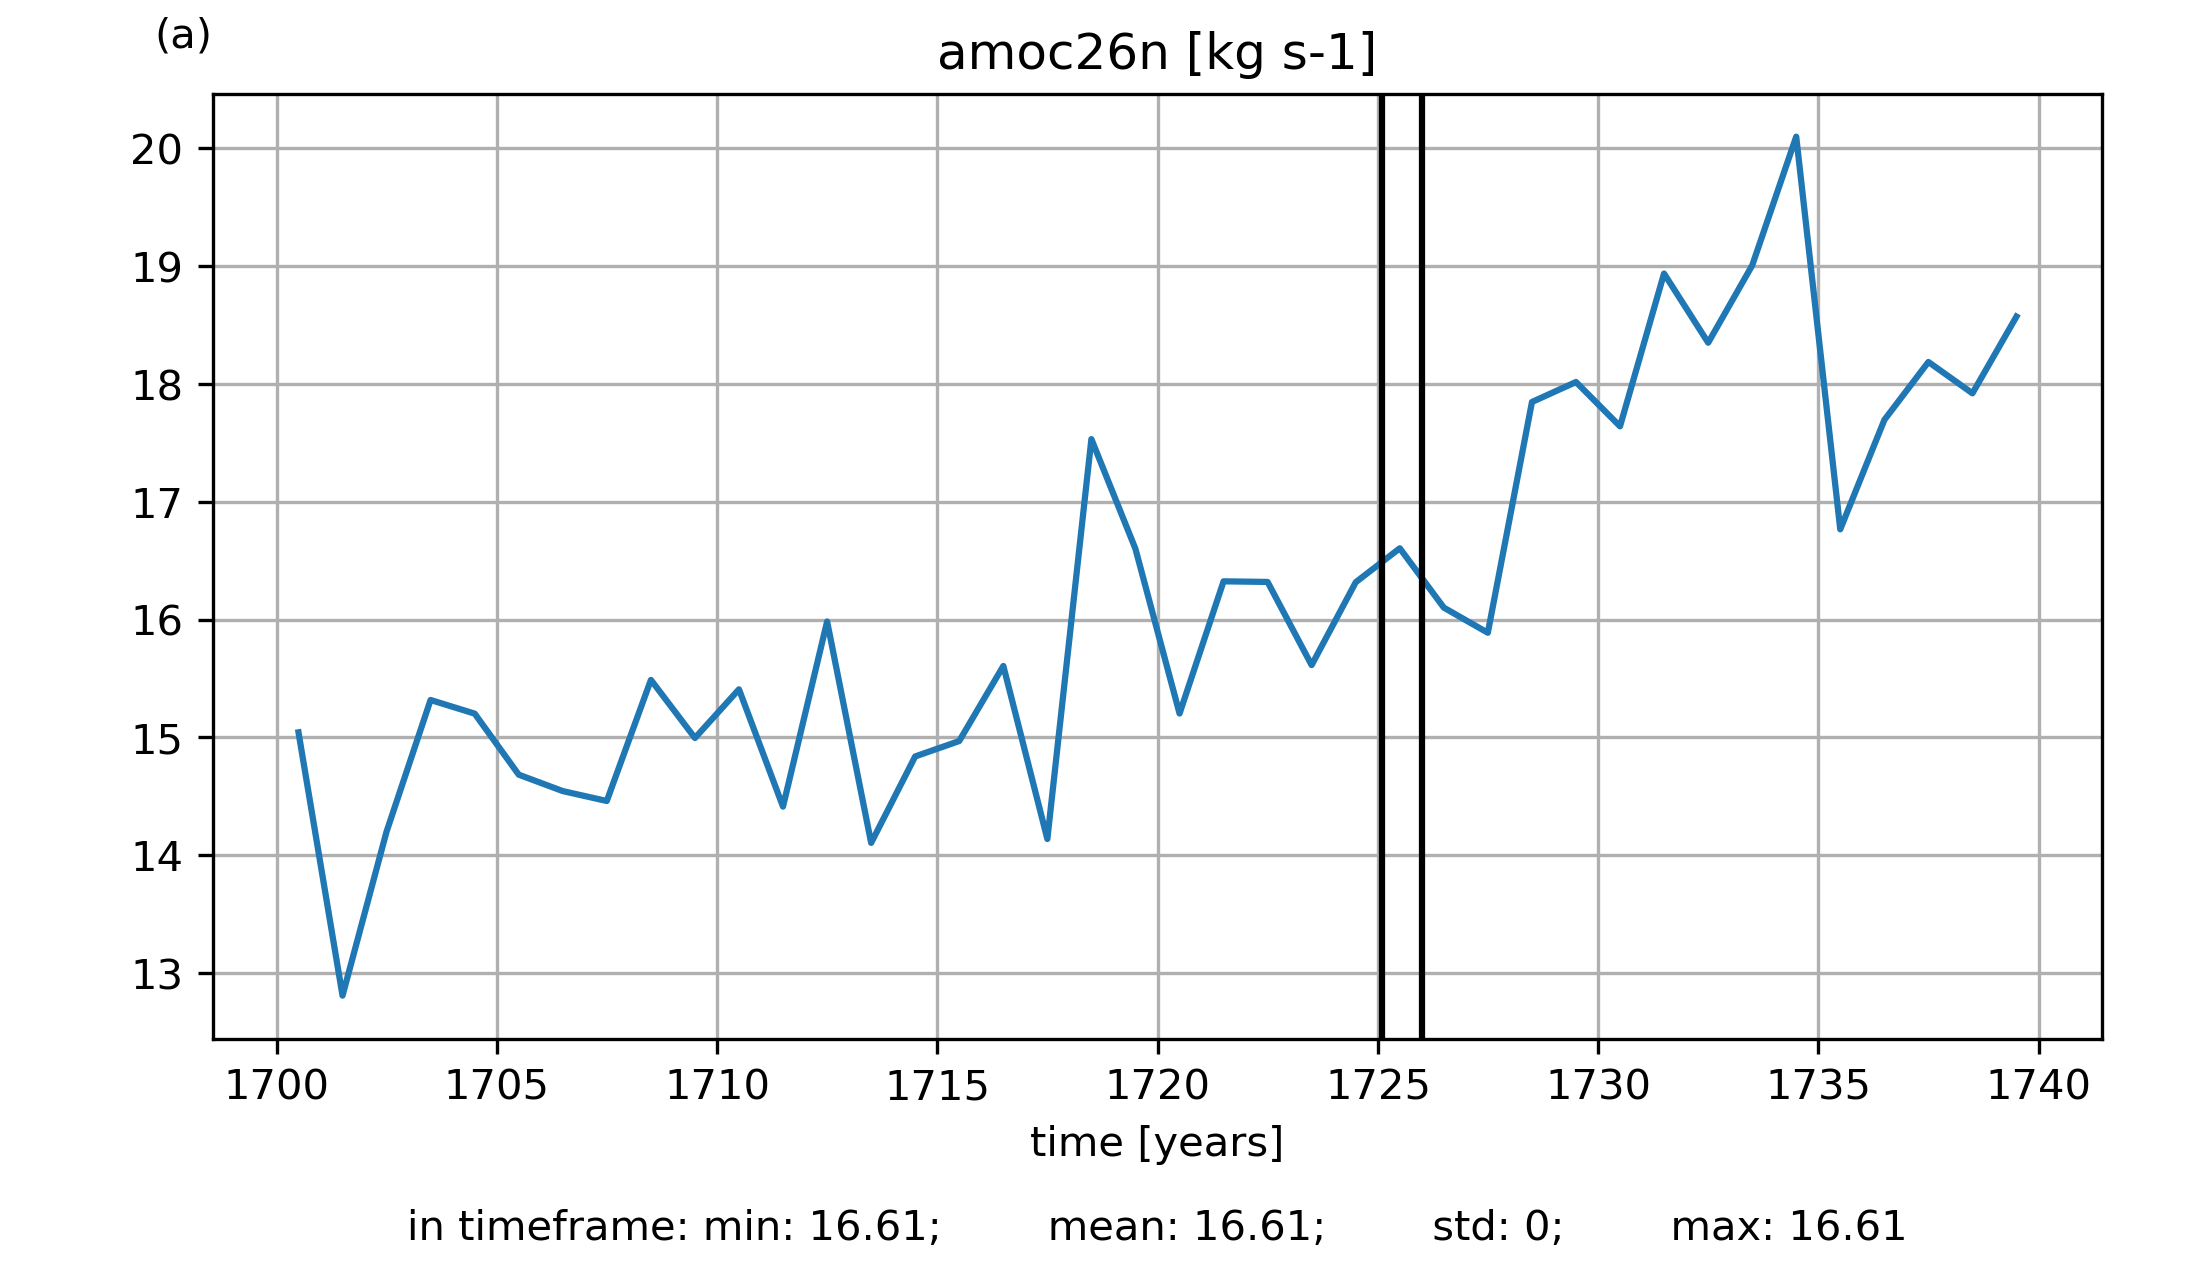
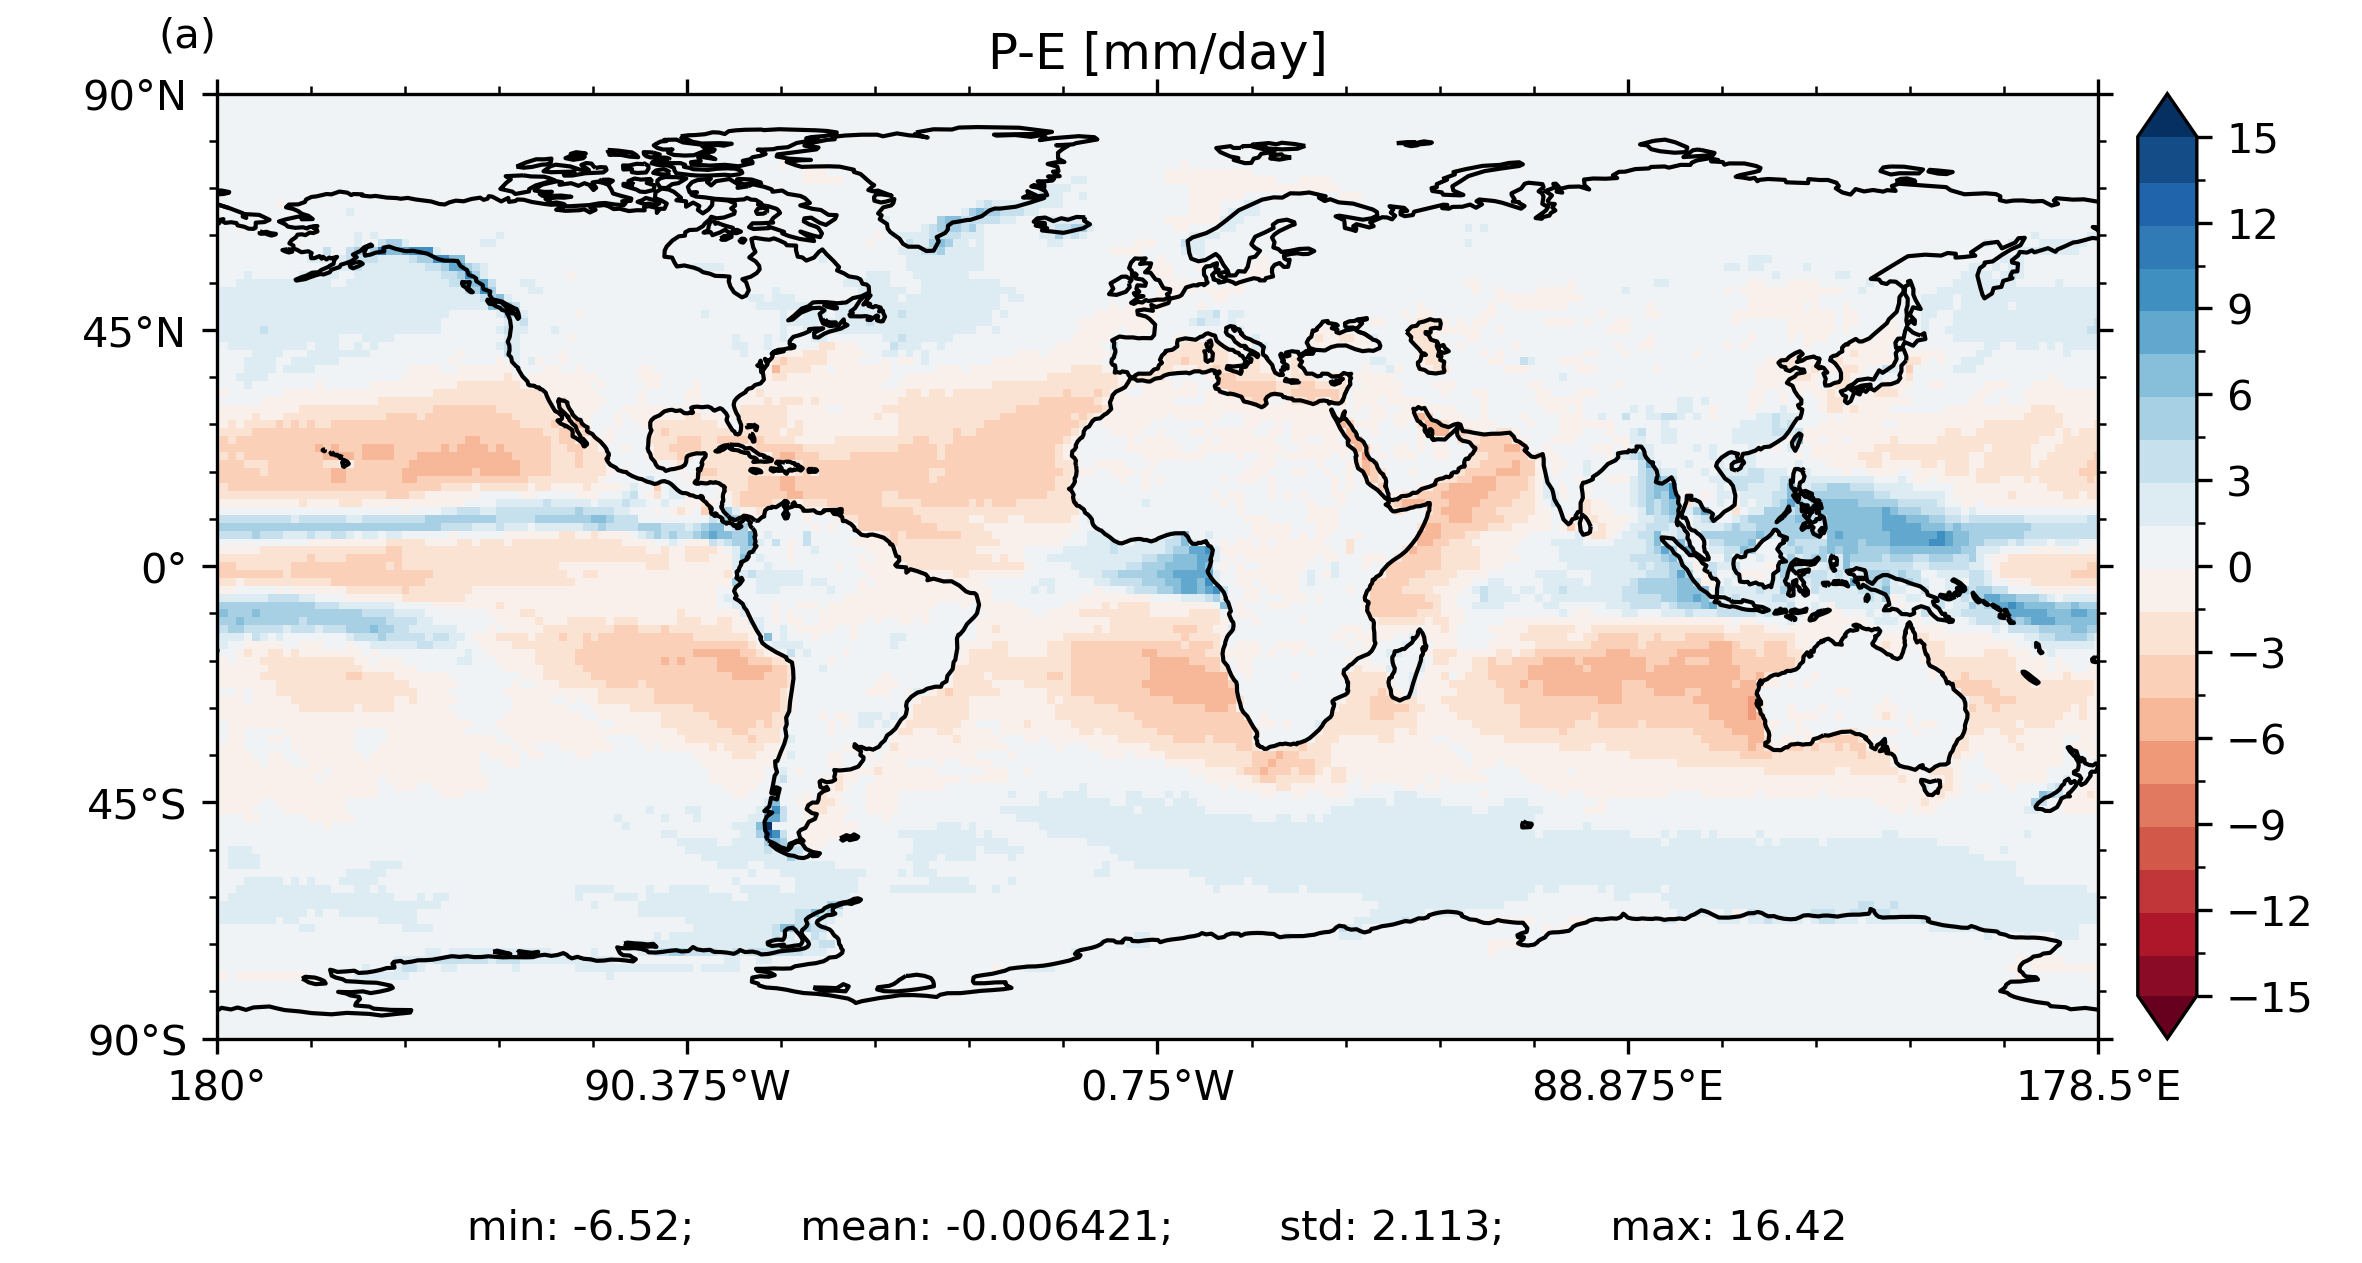
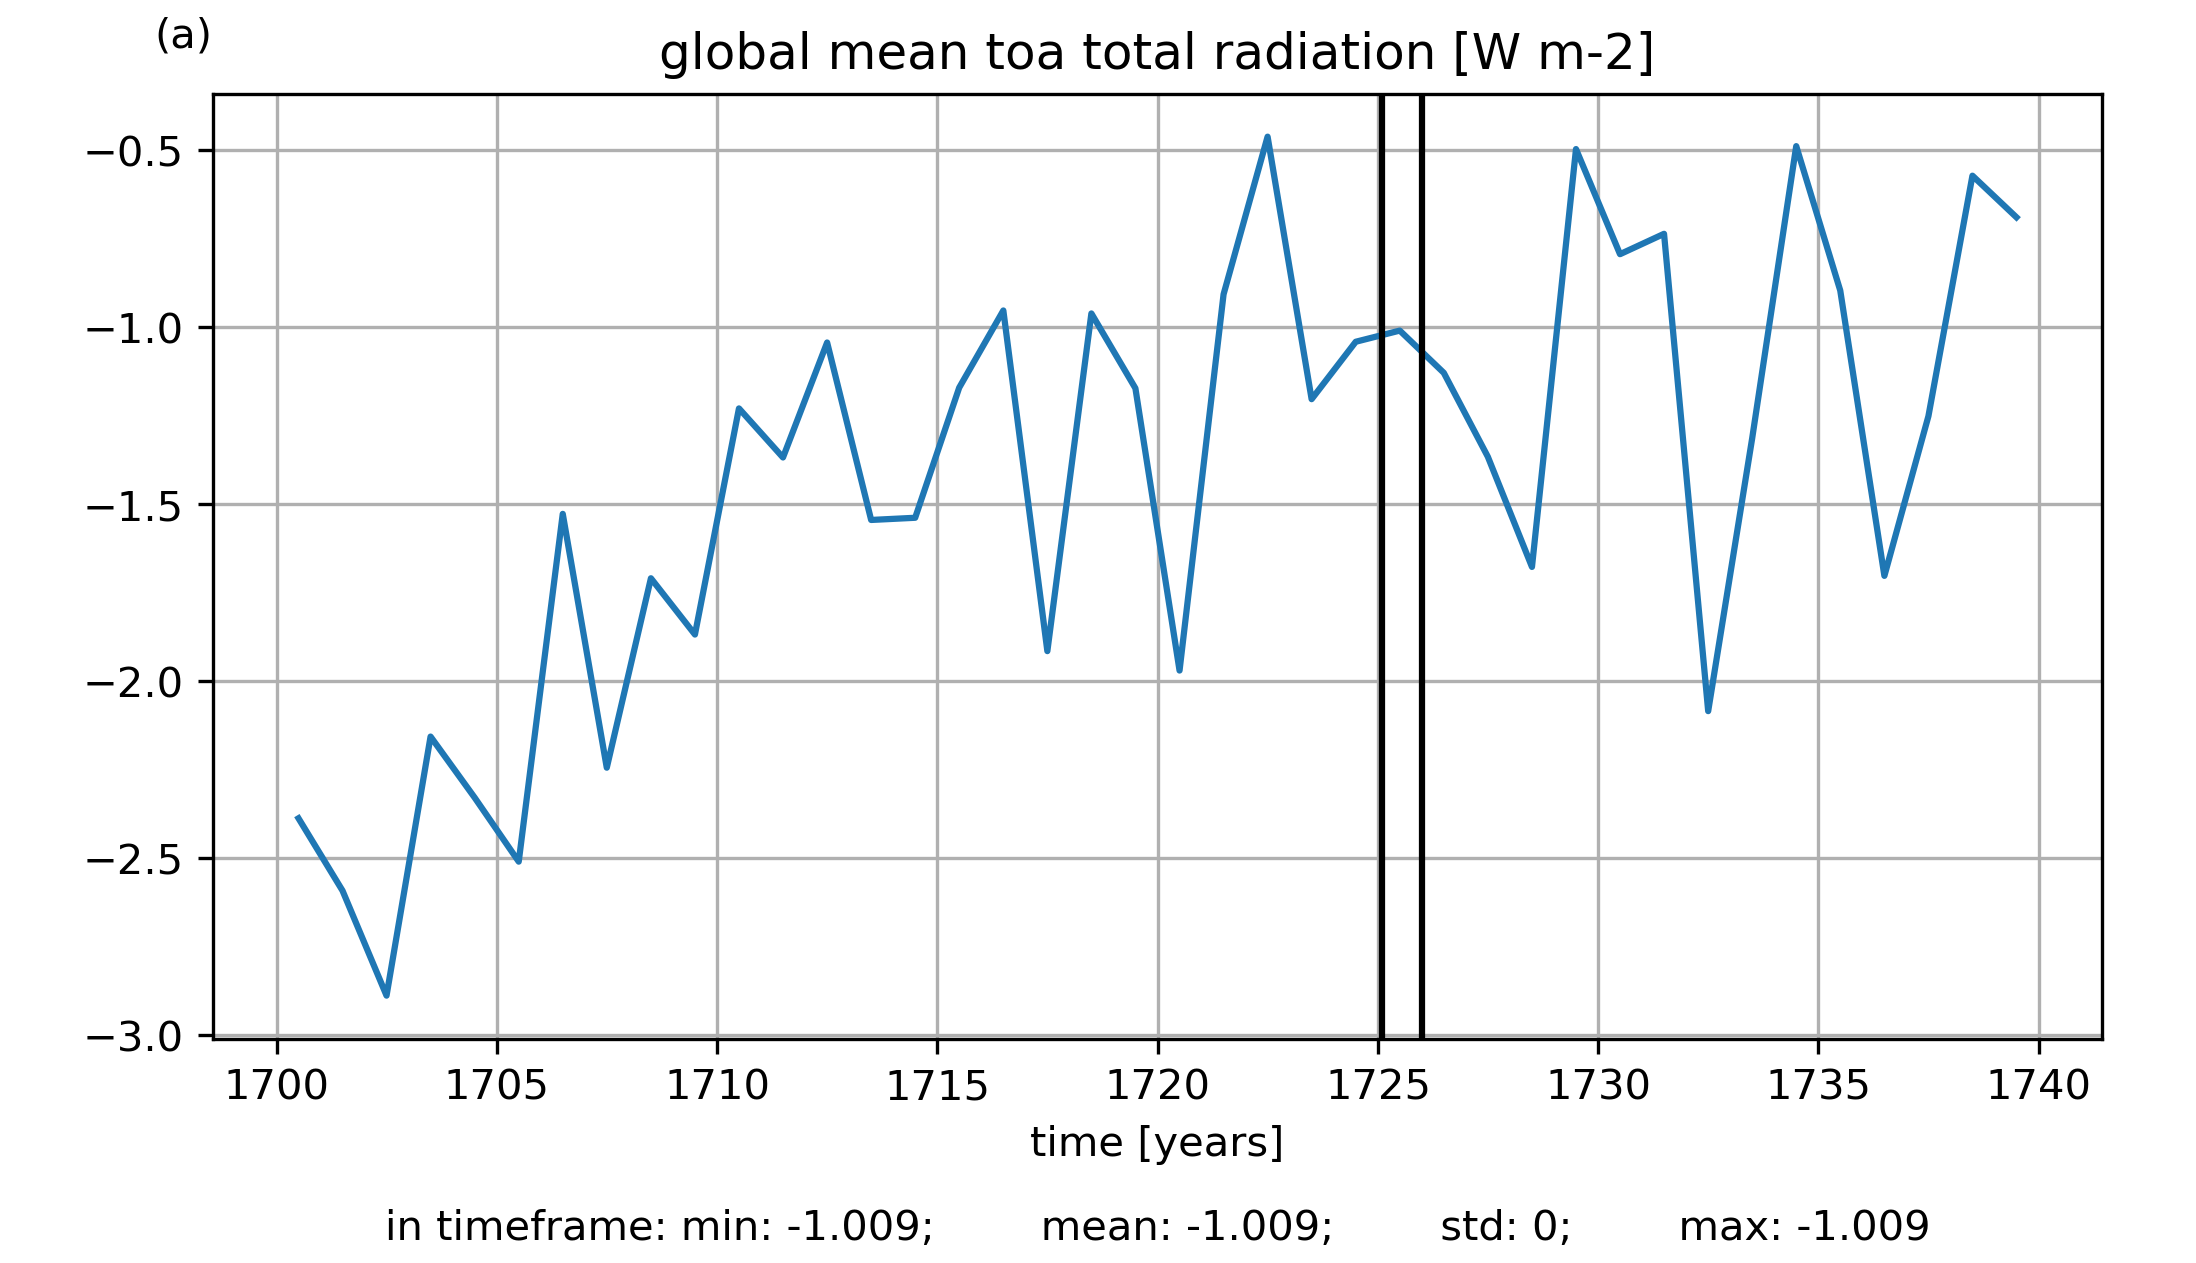
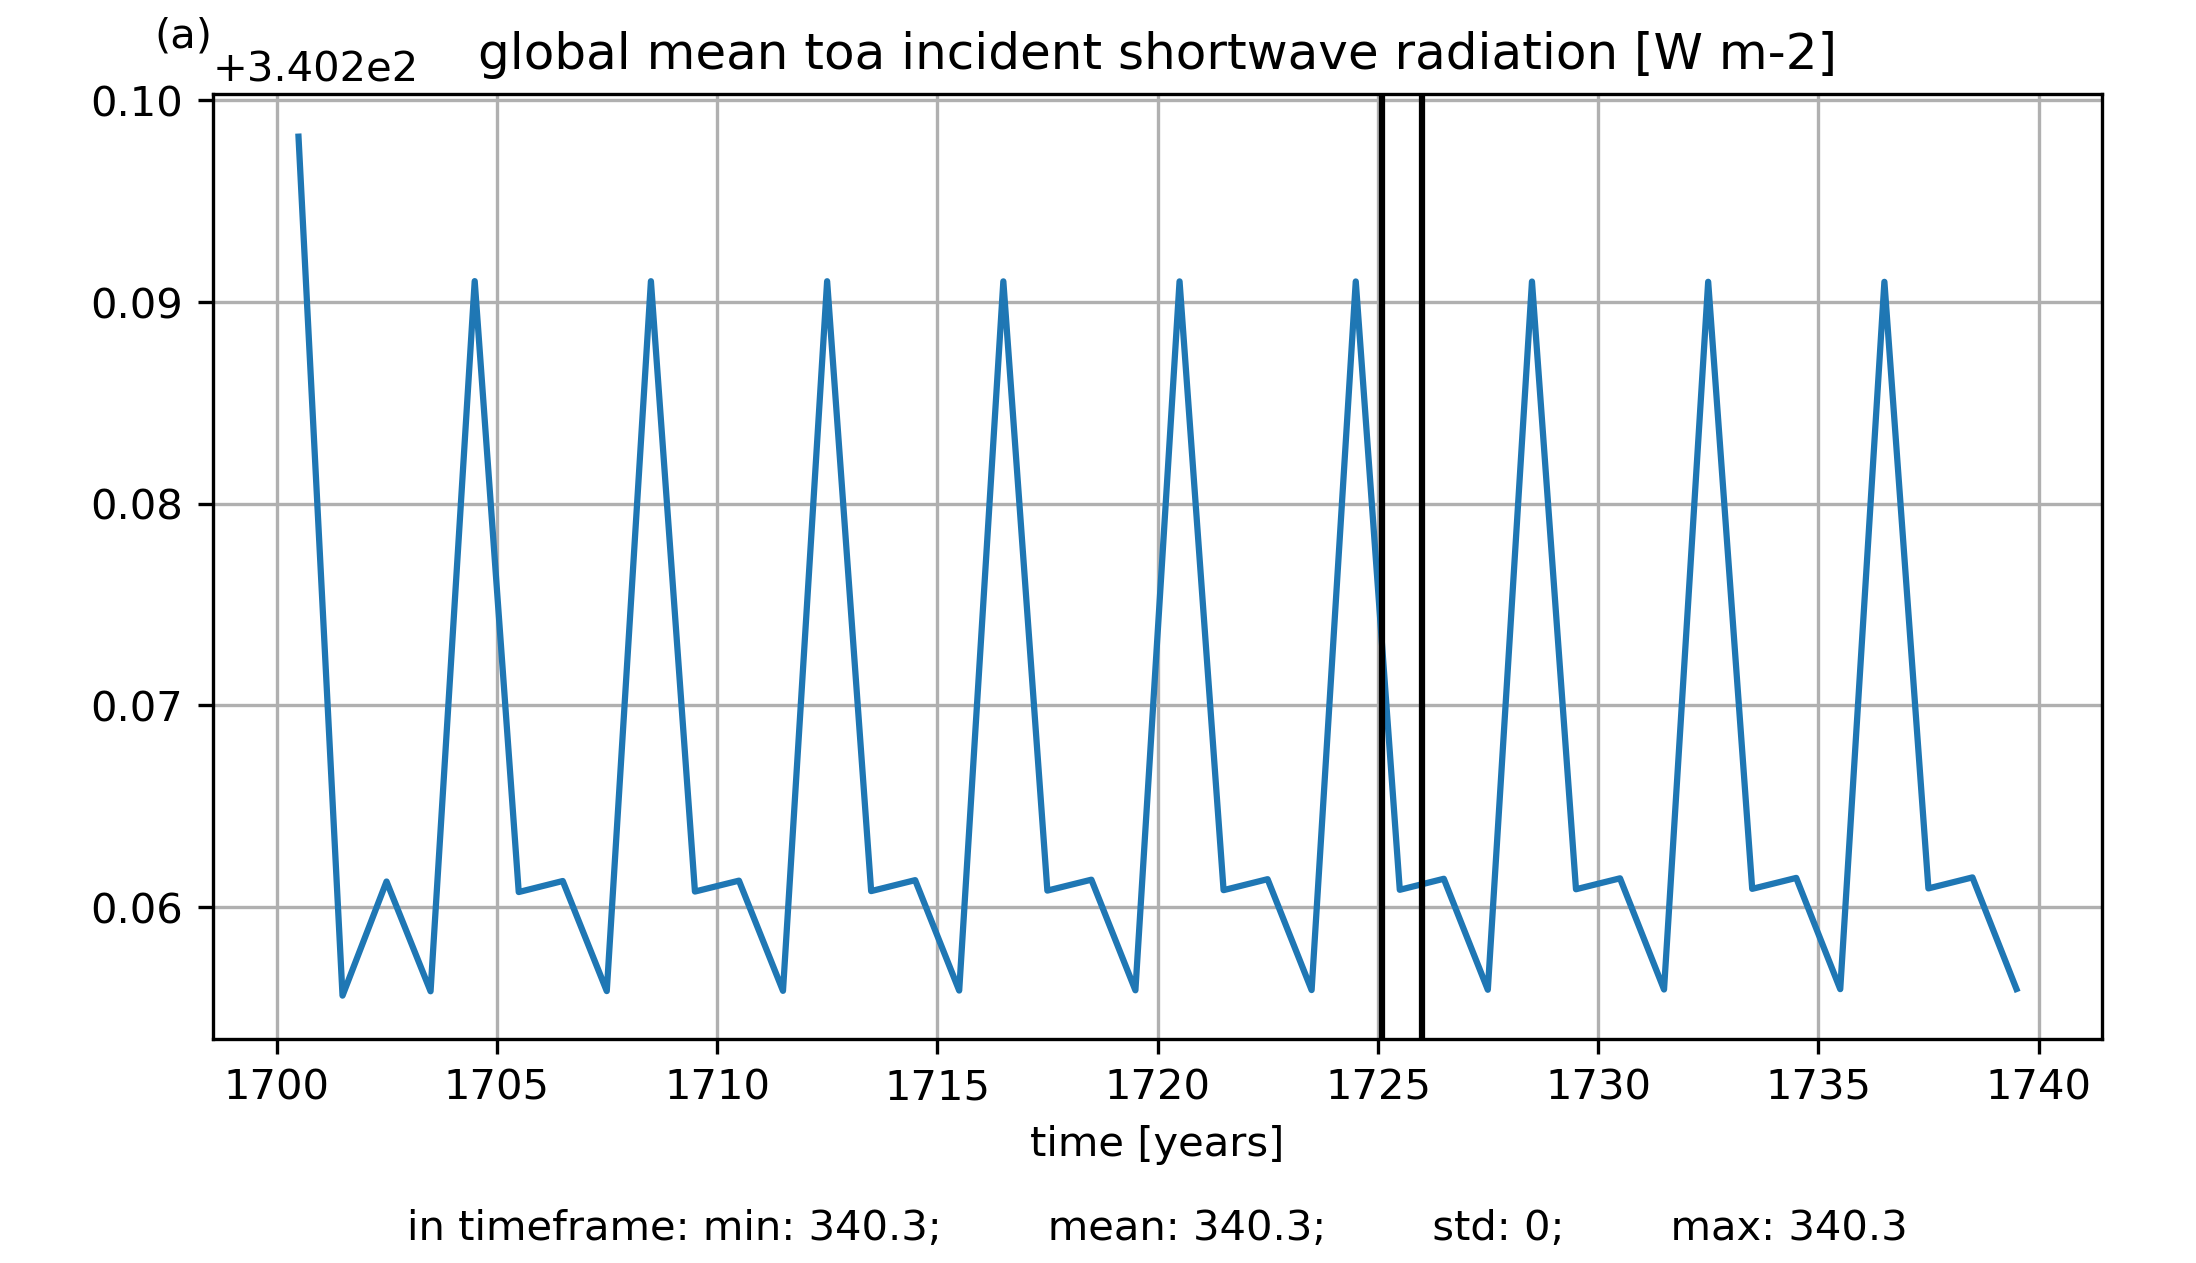
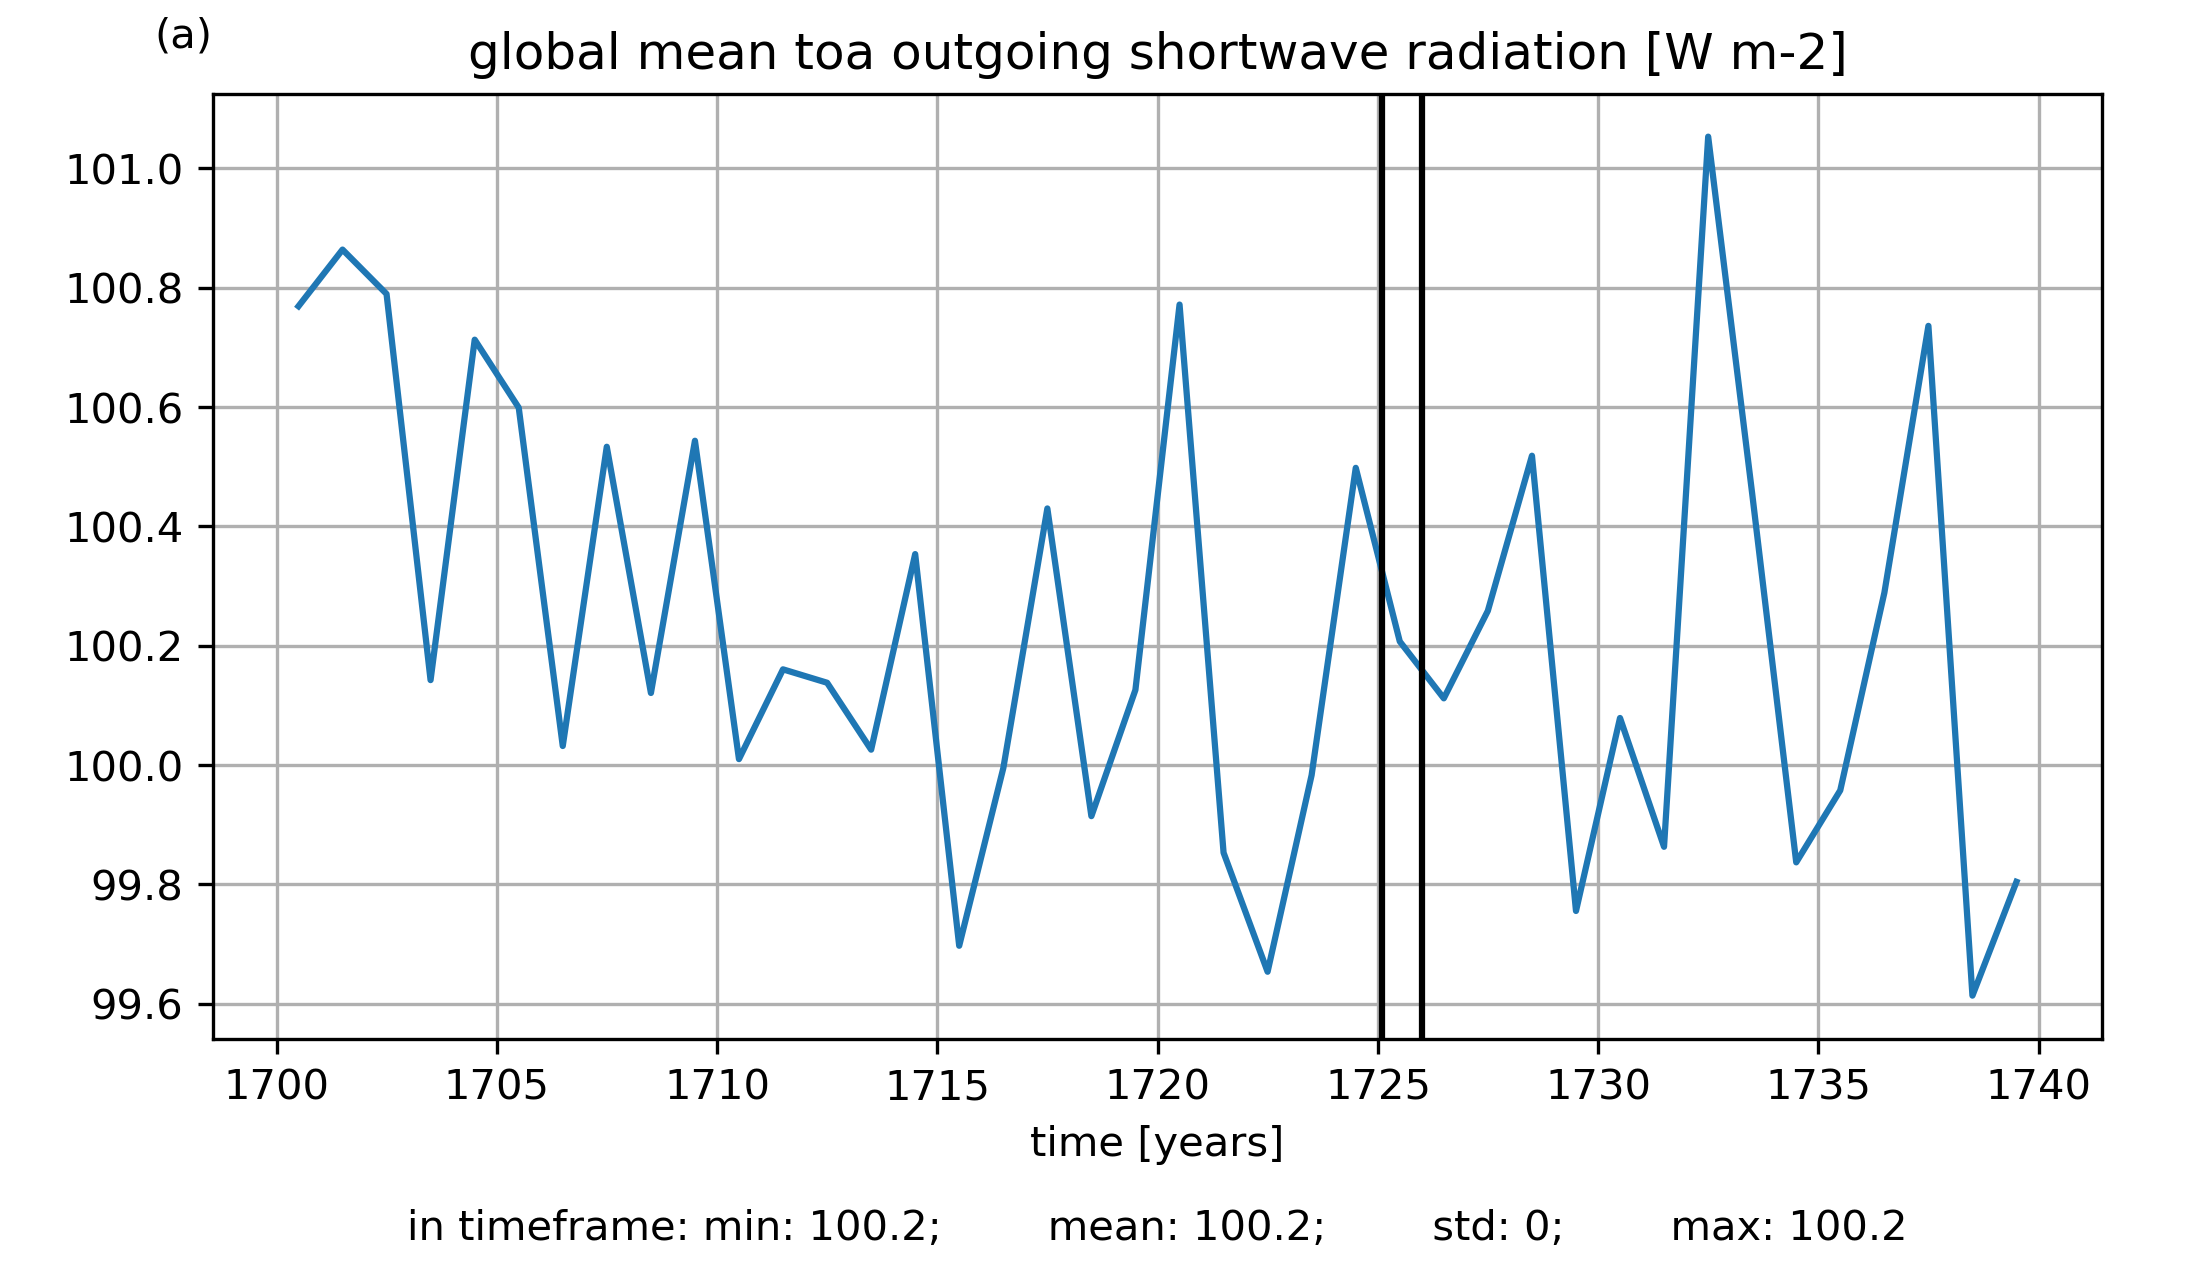
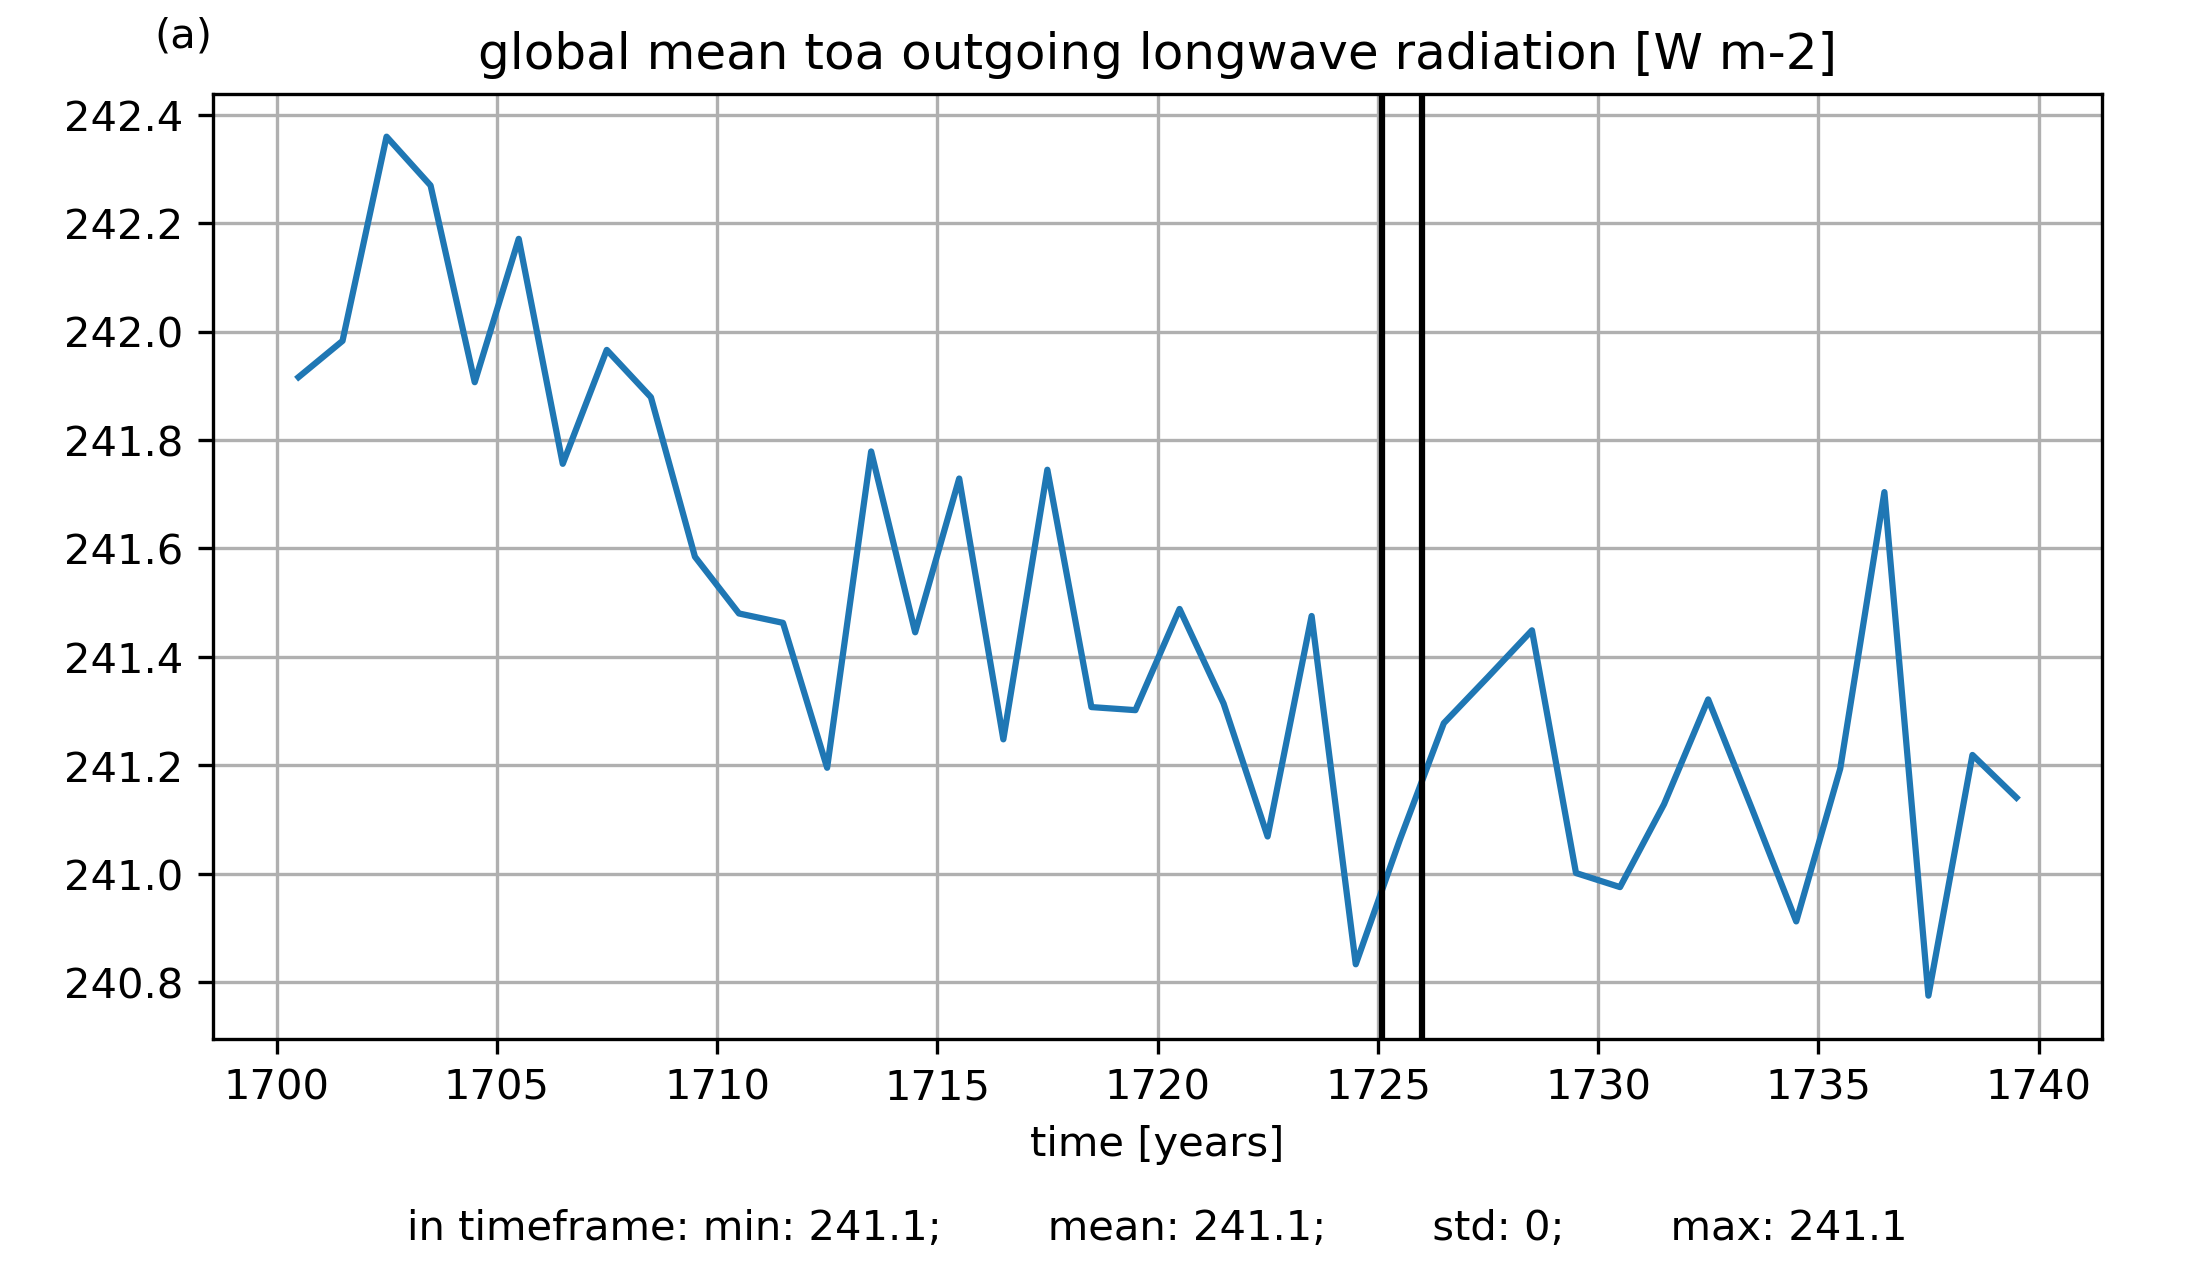
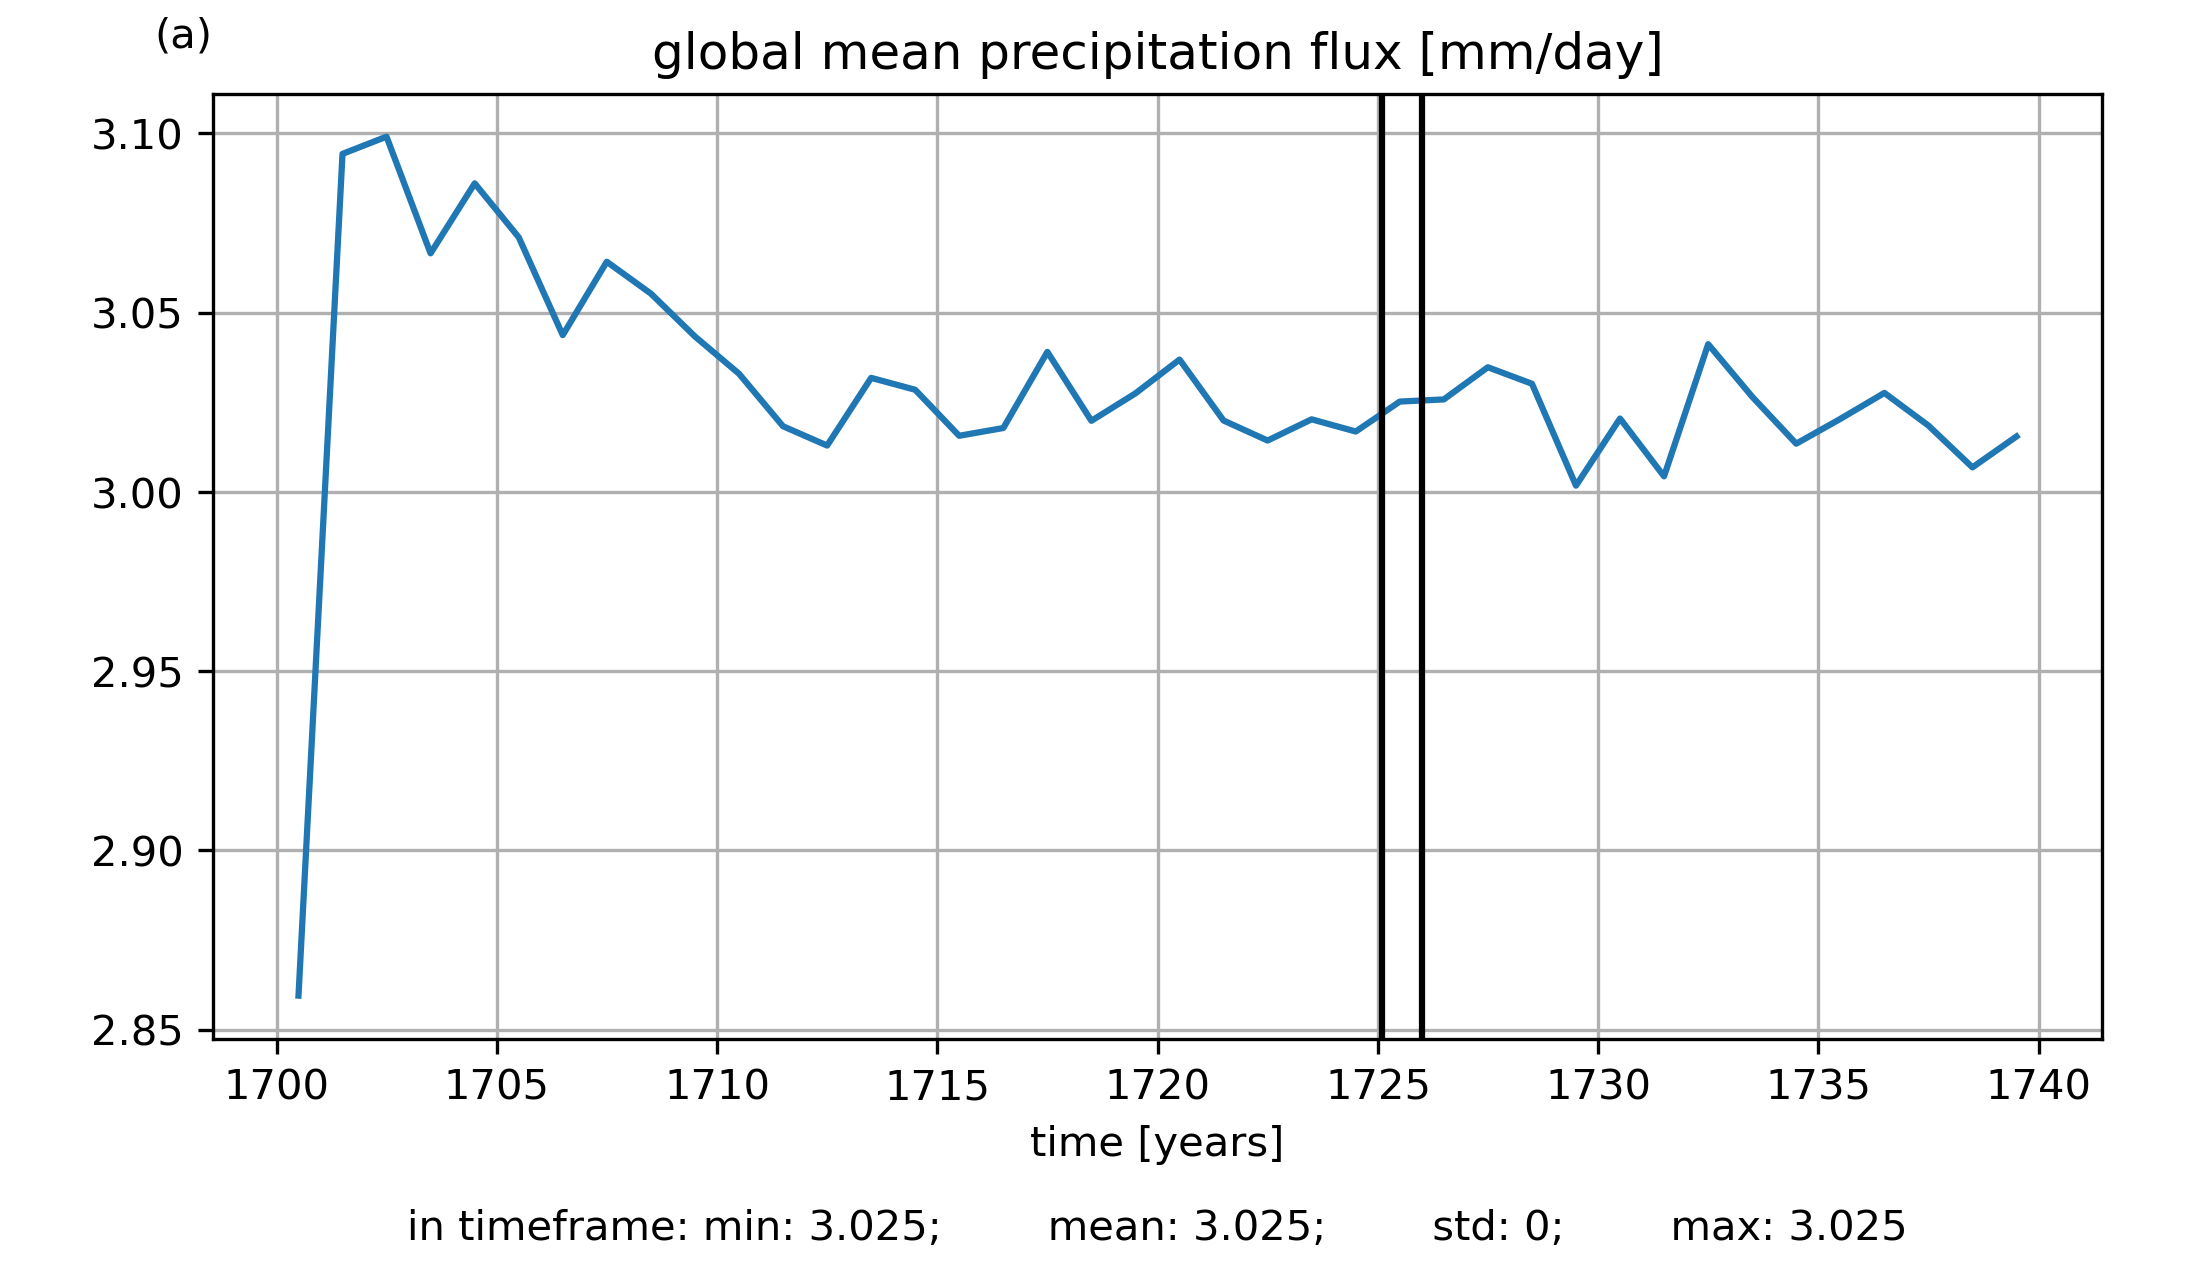
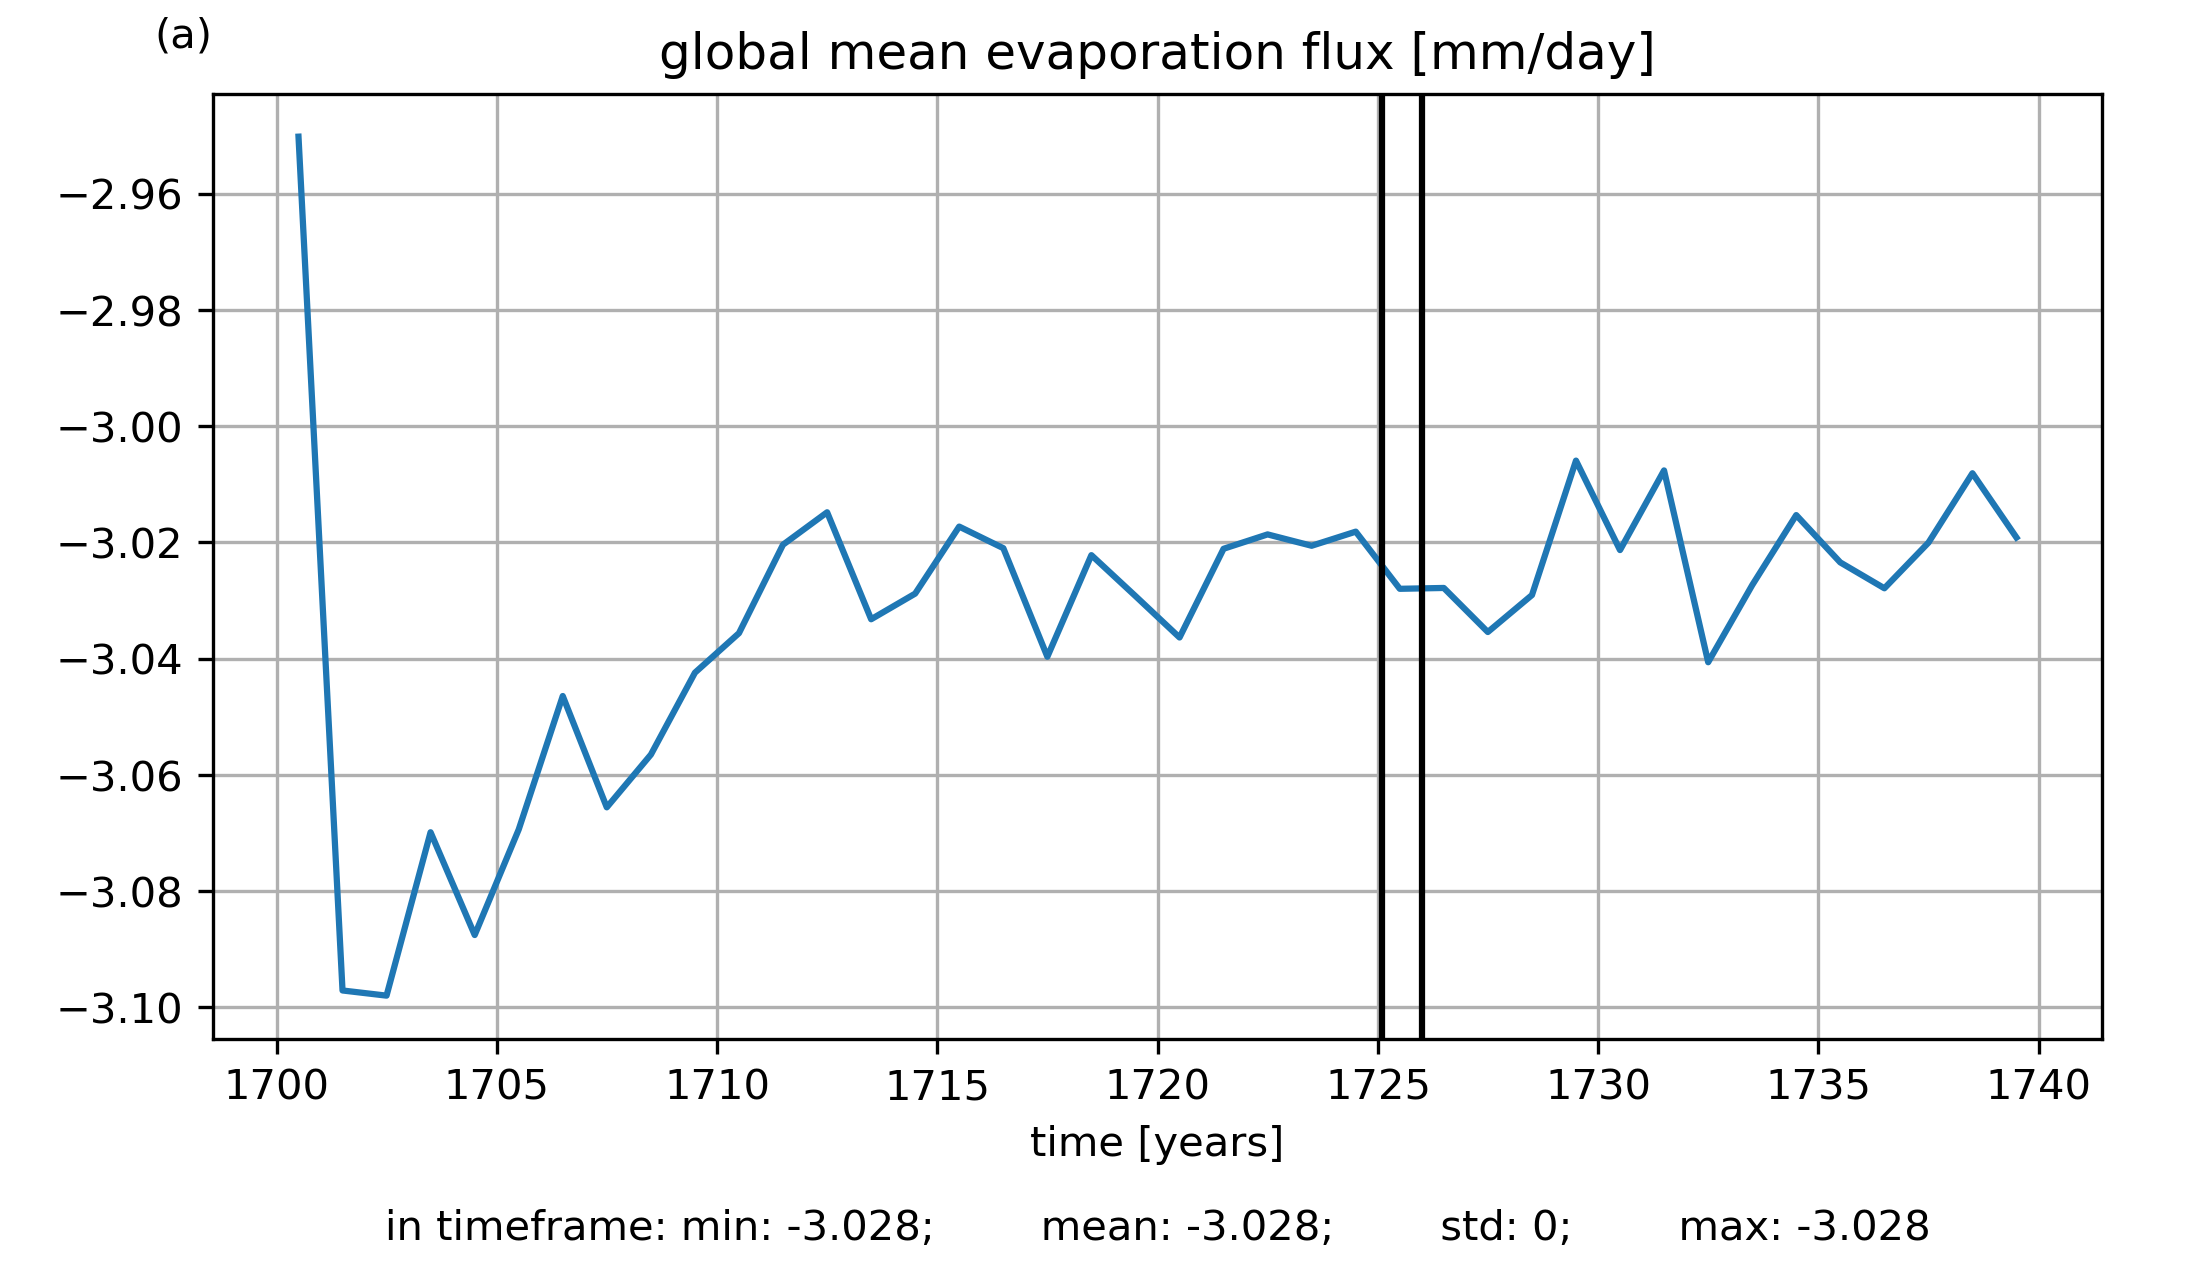
| amoc26n [kg s-1] | ice_volume_nh [km3] | ice_volume_sh [km3] | global mean temperature at 2m [$^o$C] | global mean toa total radiation [W m-2] | global mean toa incident shortwave radiation [W m-2] | global mean toa outgoing shortwave radiation [W m-2] | global mean toa outgoing longwave radiation [W m-2] | global mean precipitation flux [kg m-2 s-1] | global mean evaporation flux [kg m-2 s-1] | global mean P-E [kg m-2 s-1] |
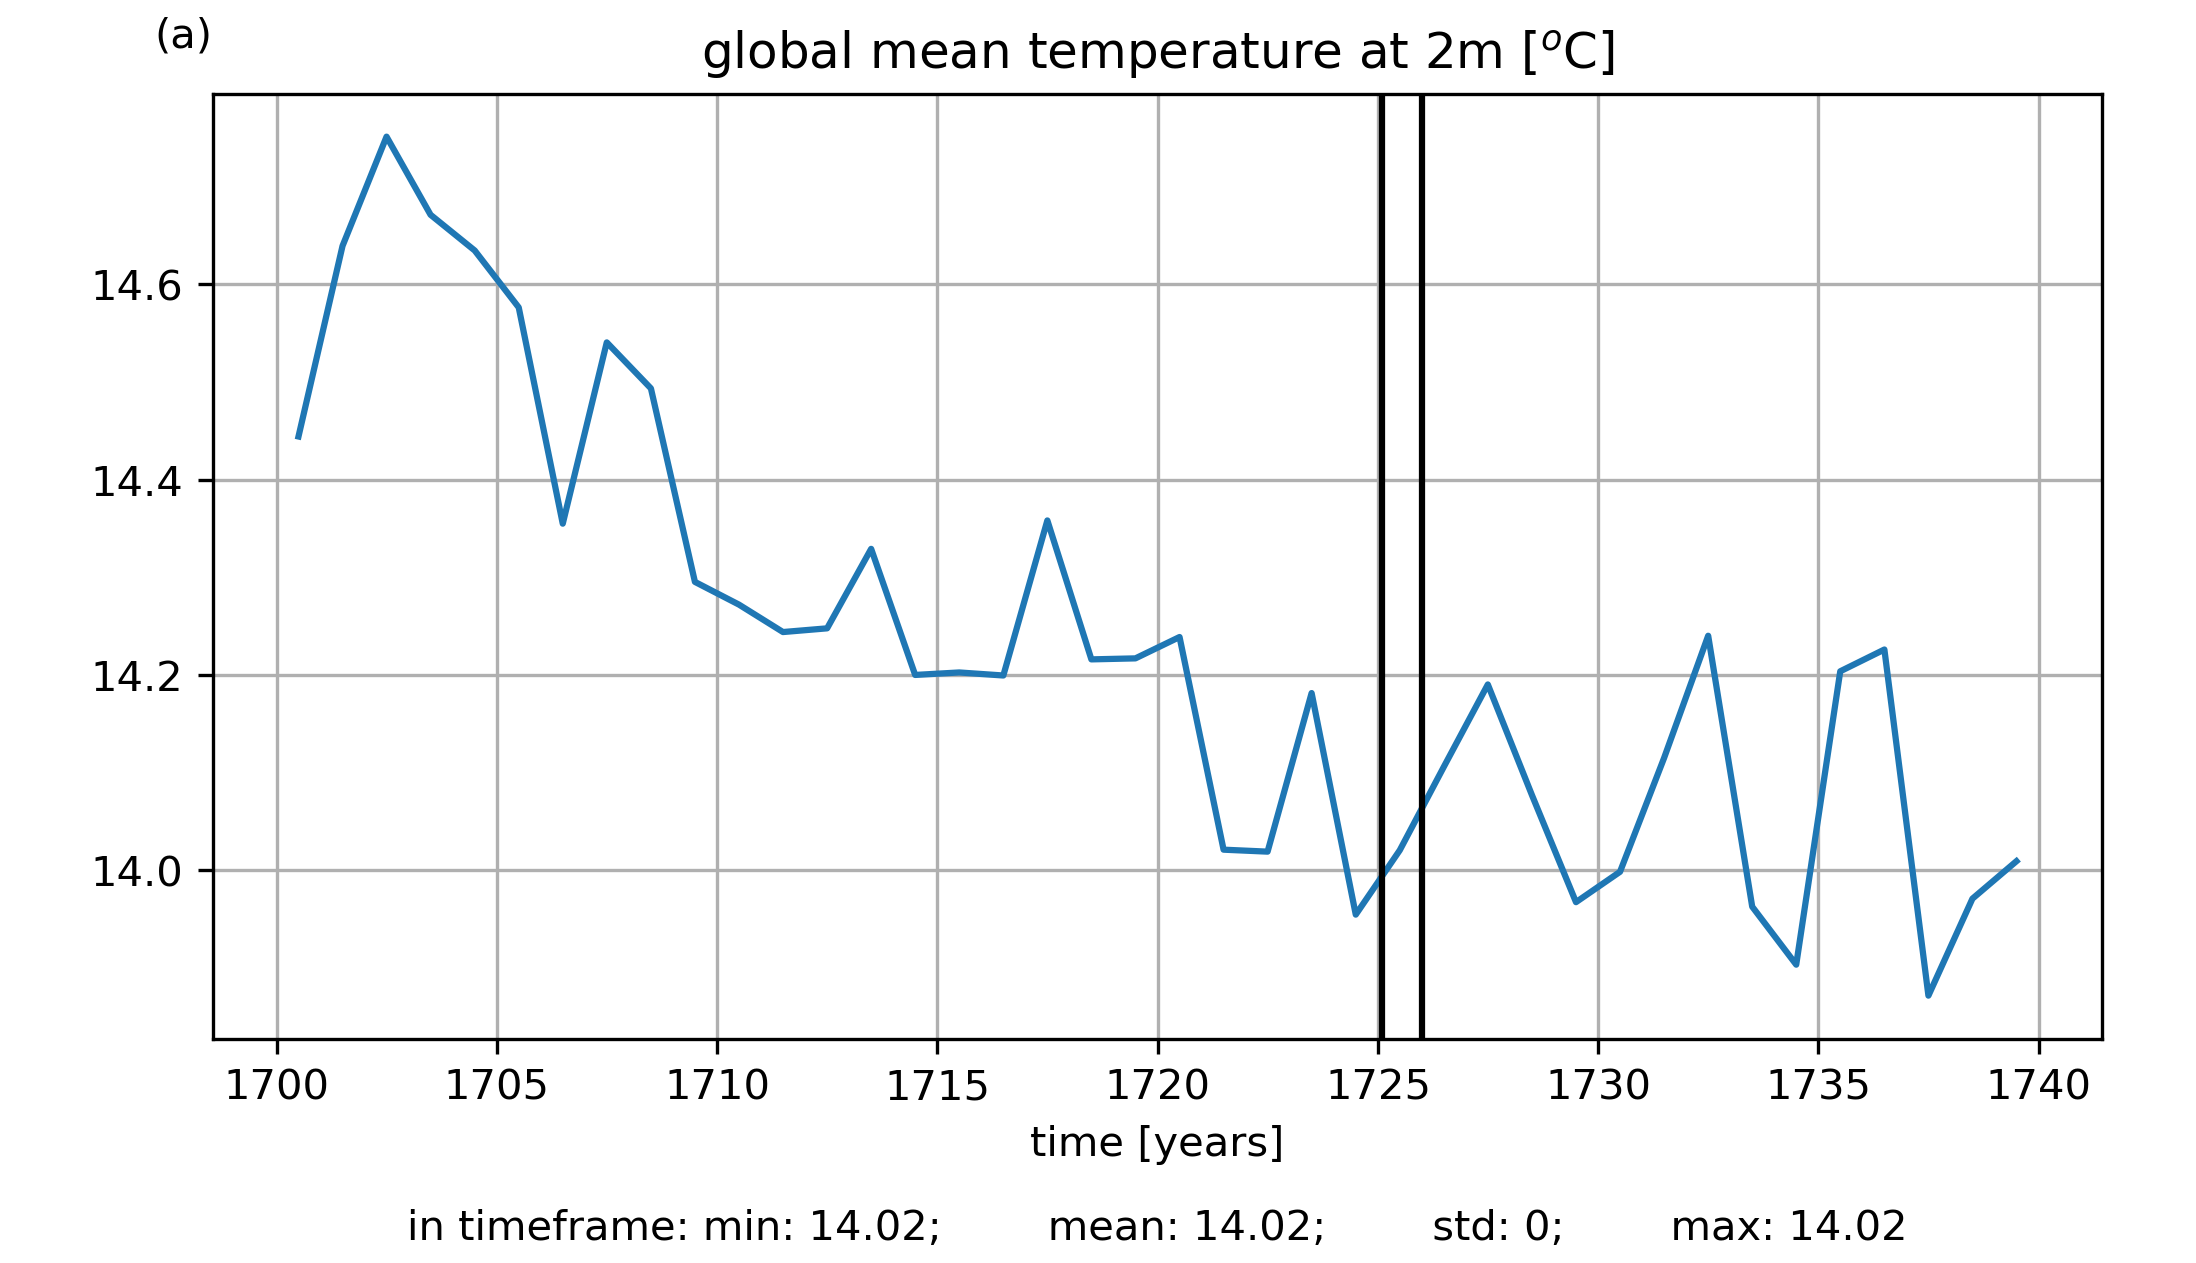
| nib3105 | 15.688 | 19954 | 5249.7 | 14.016 | -0.9914 | 340.26 | 100.23 | -241.01 | 3.5028e-05 | -3.506e-05 | -3.253e-08 |
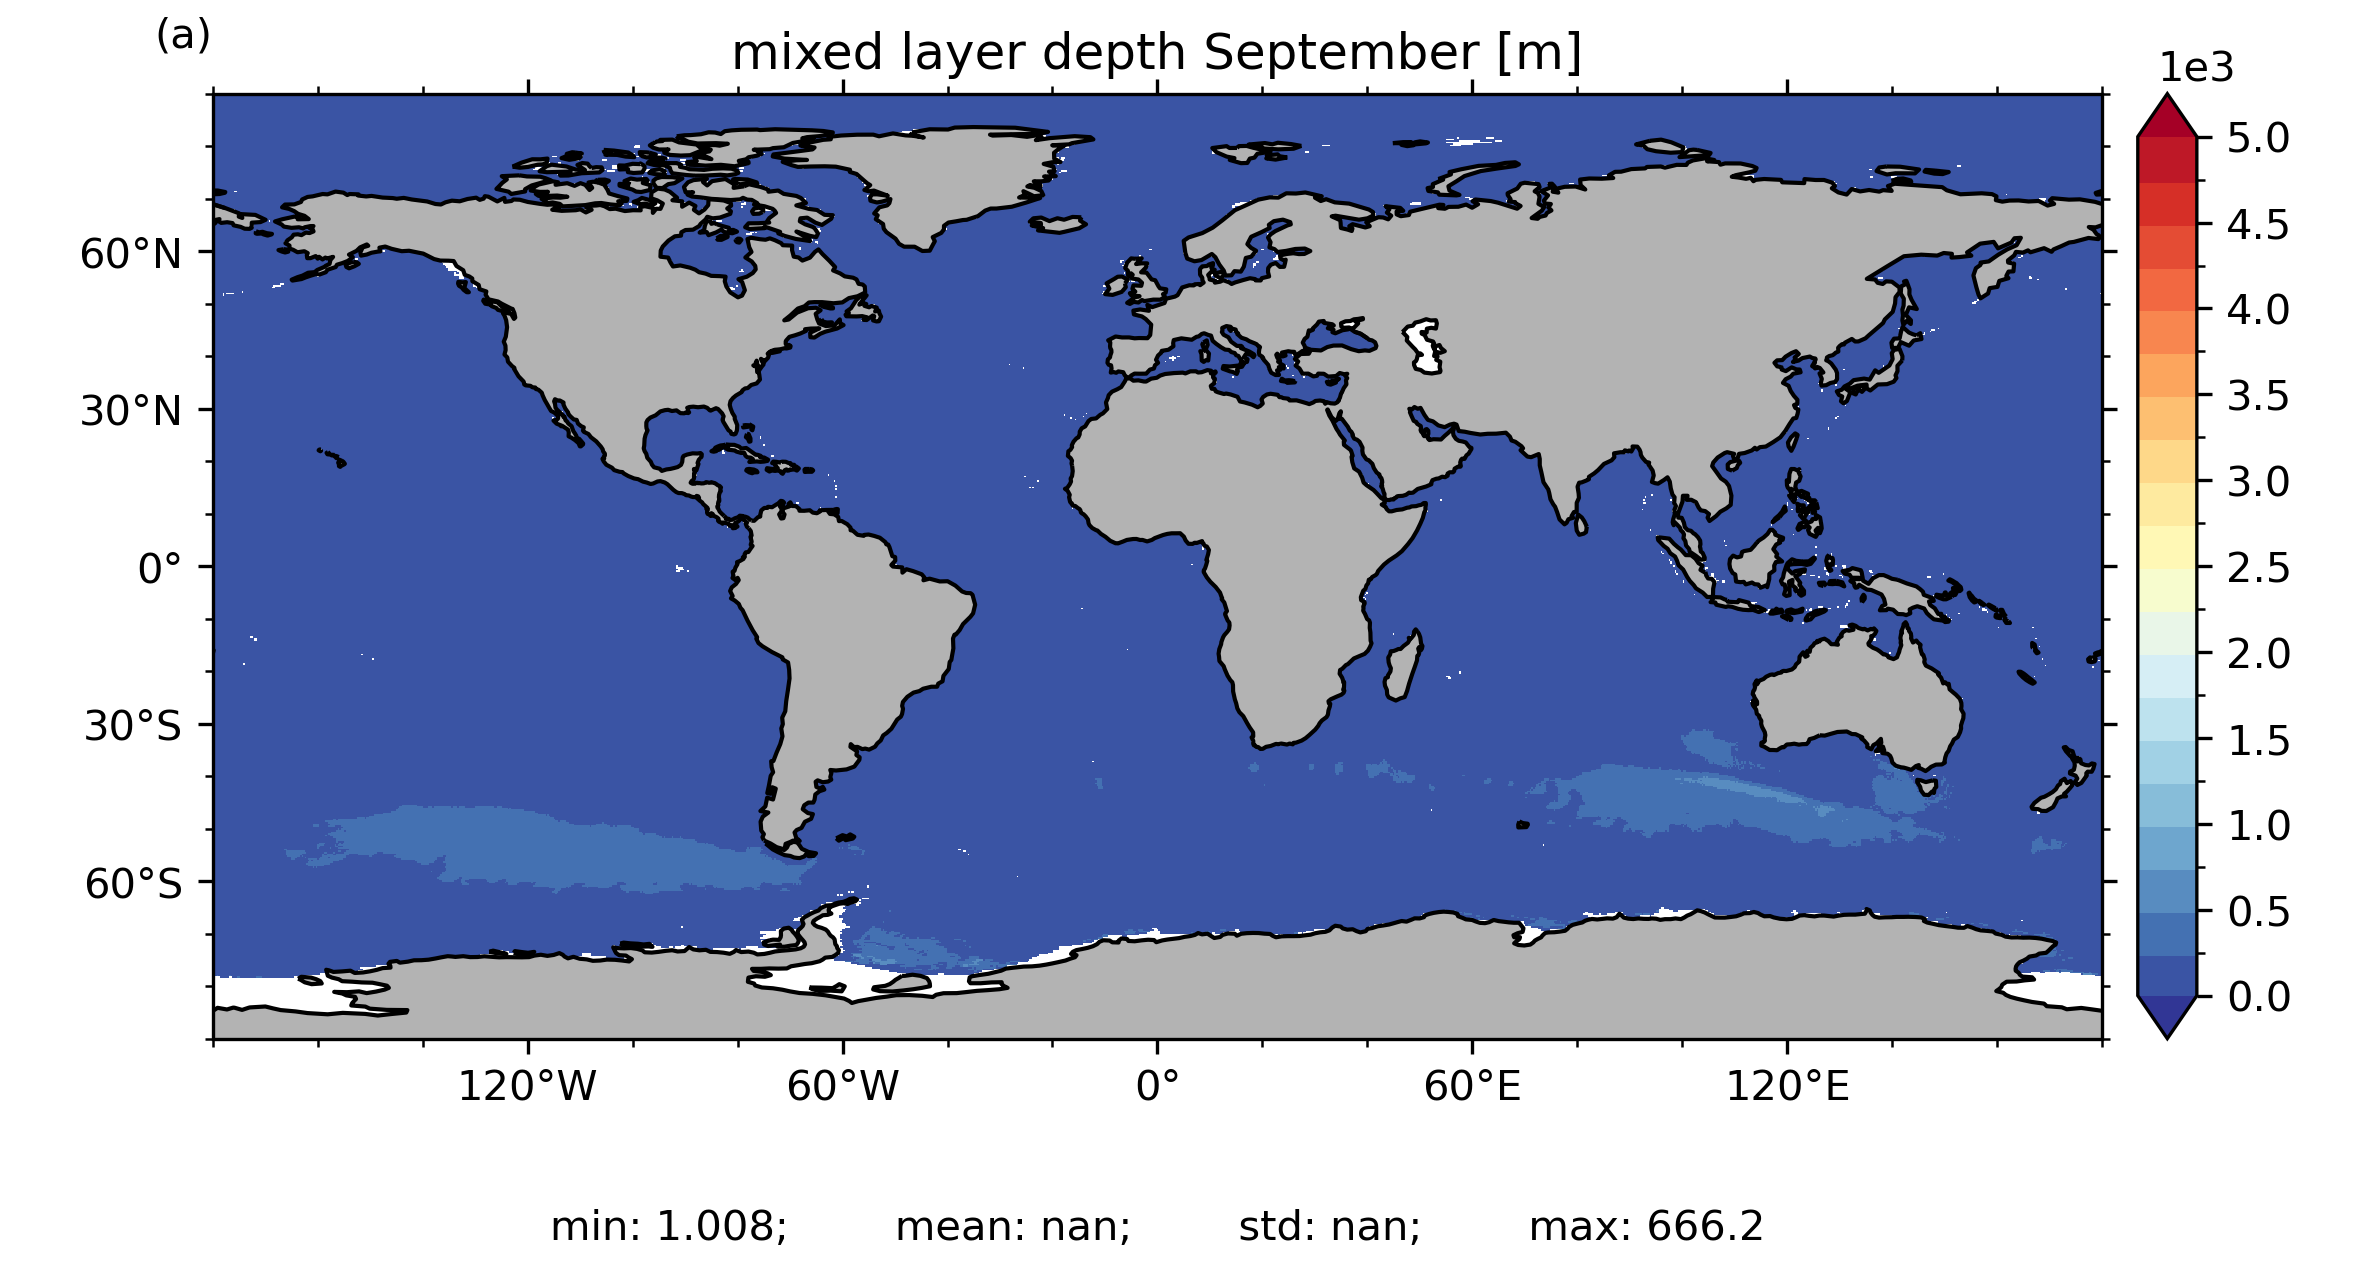
Mixed layer depth September
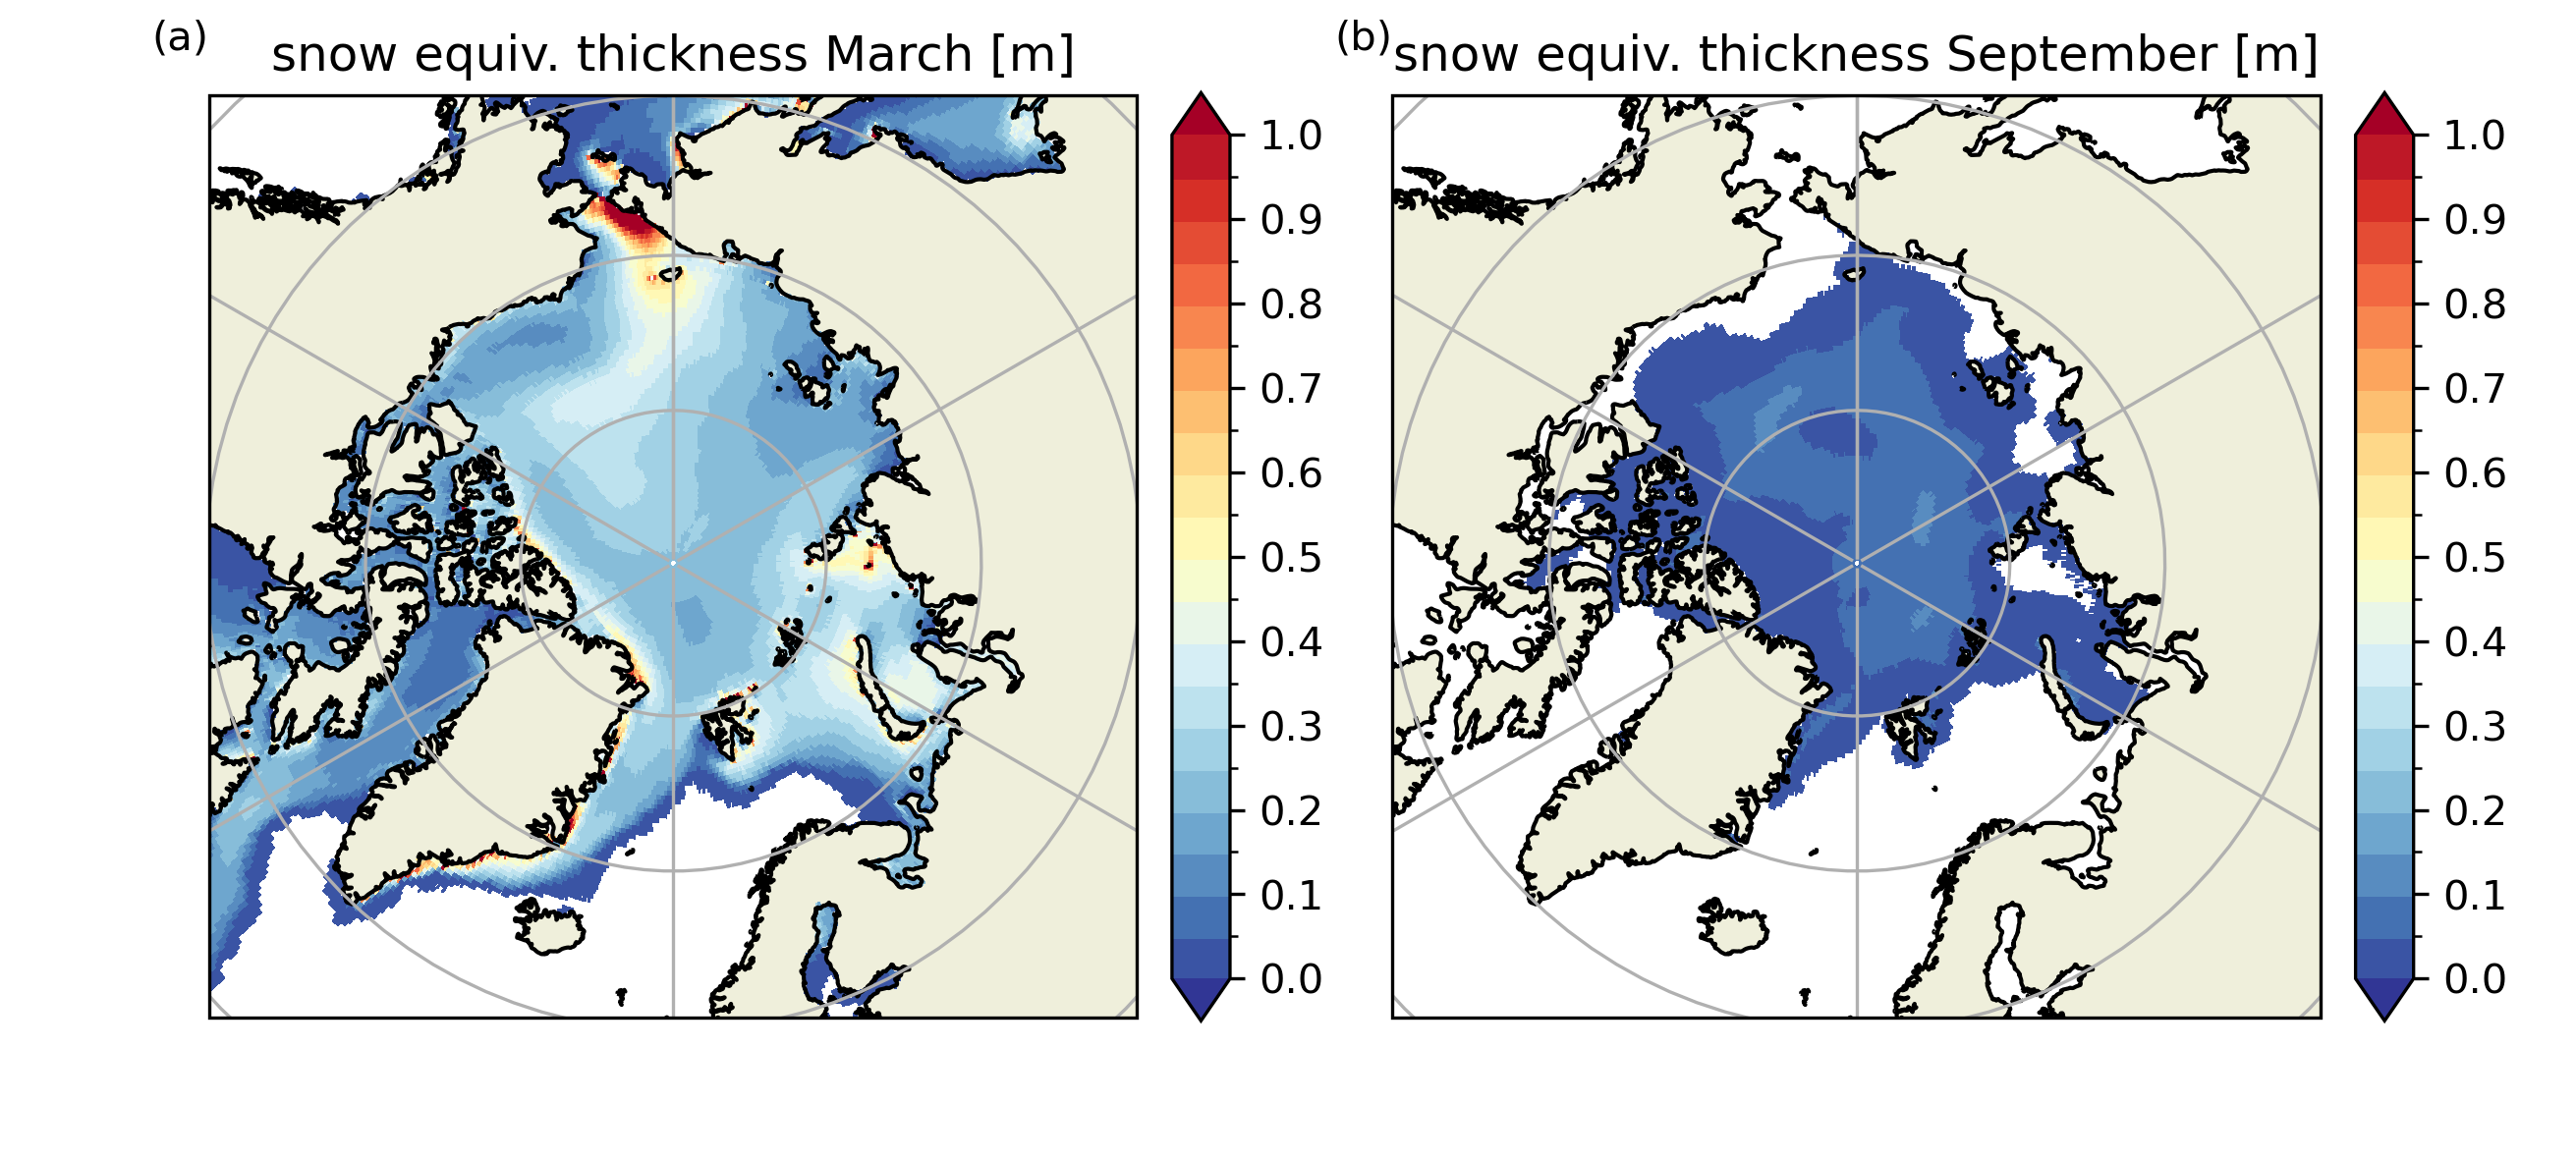
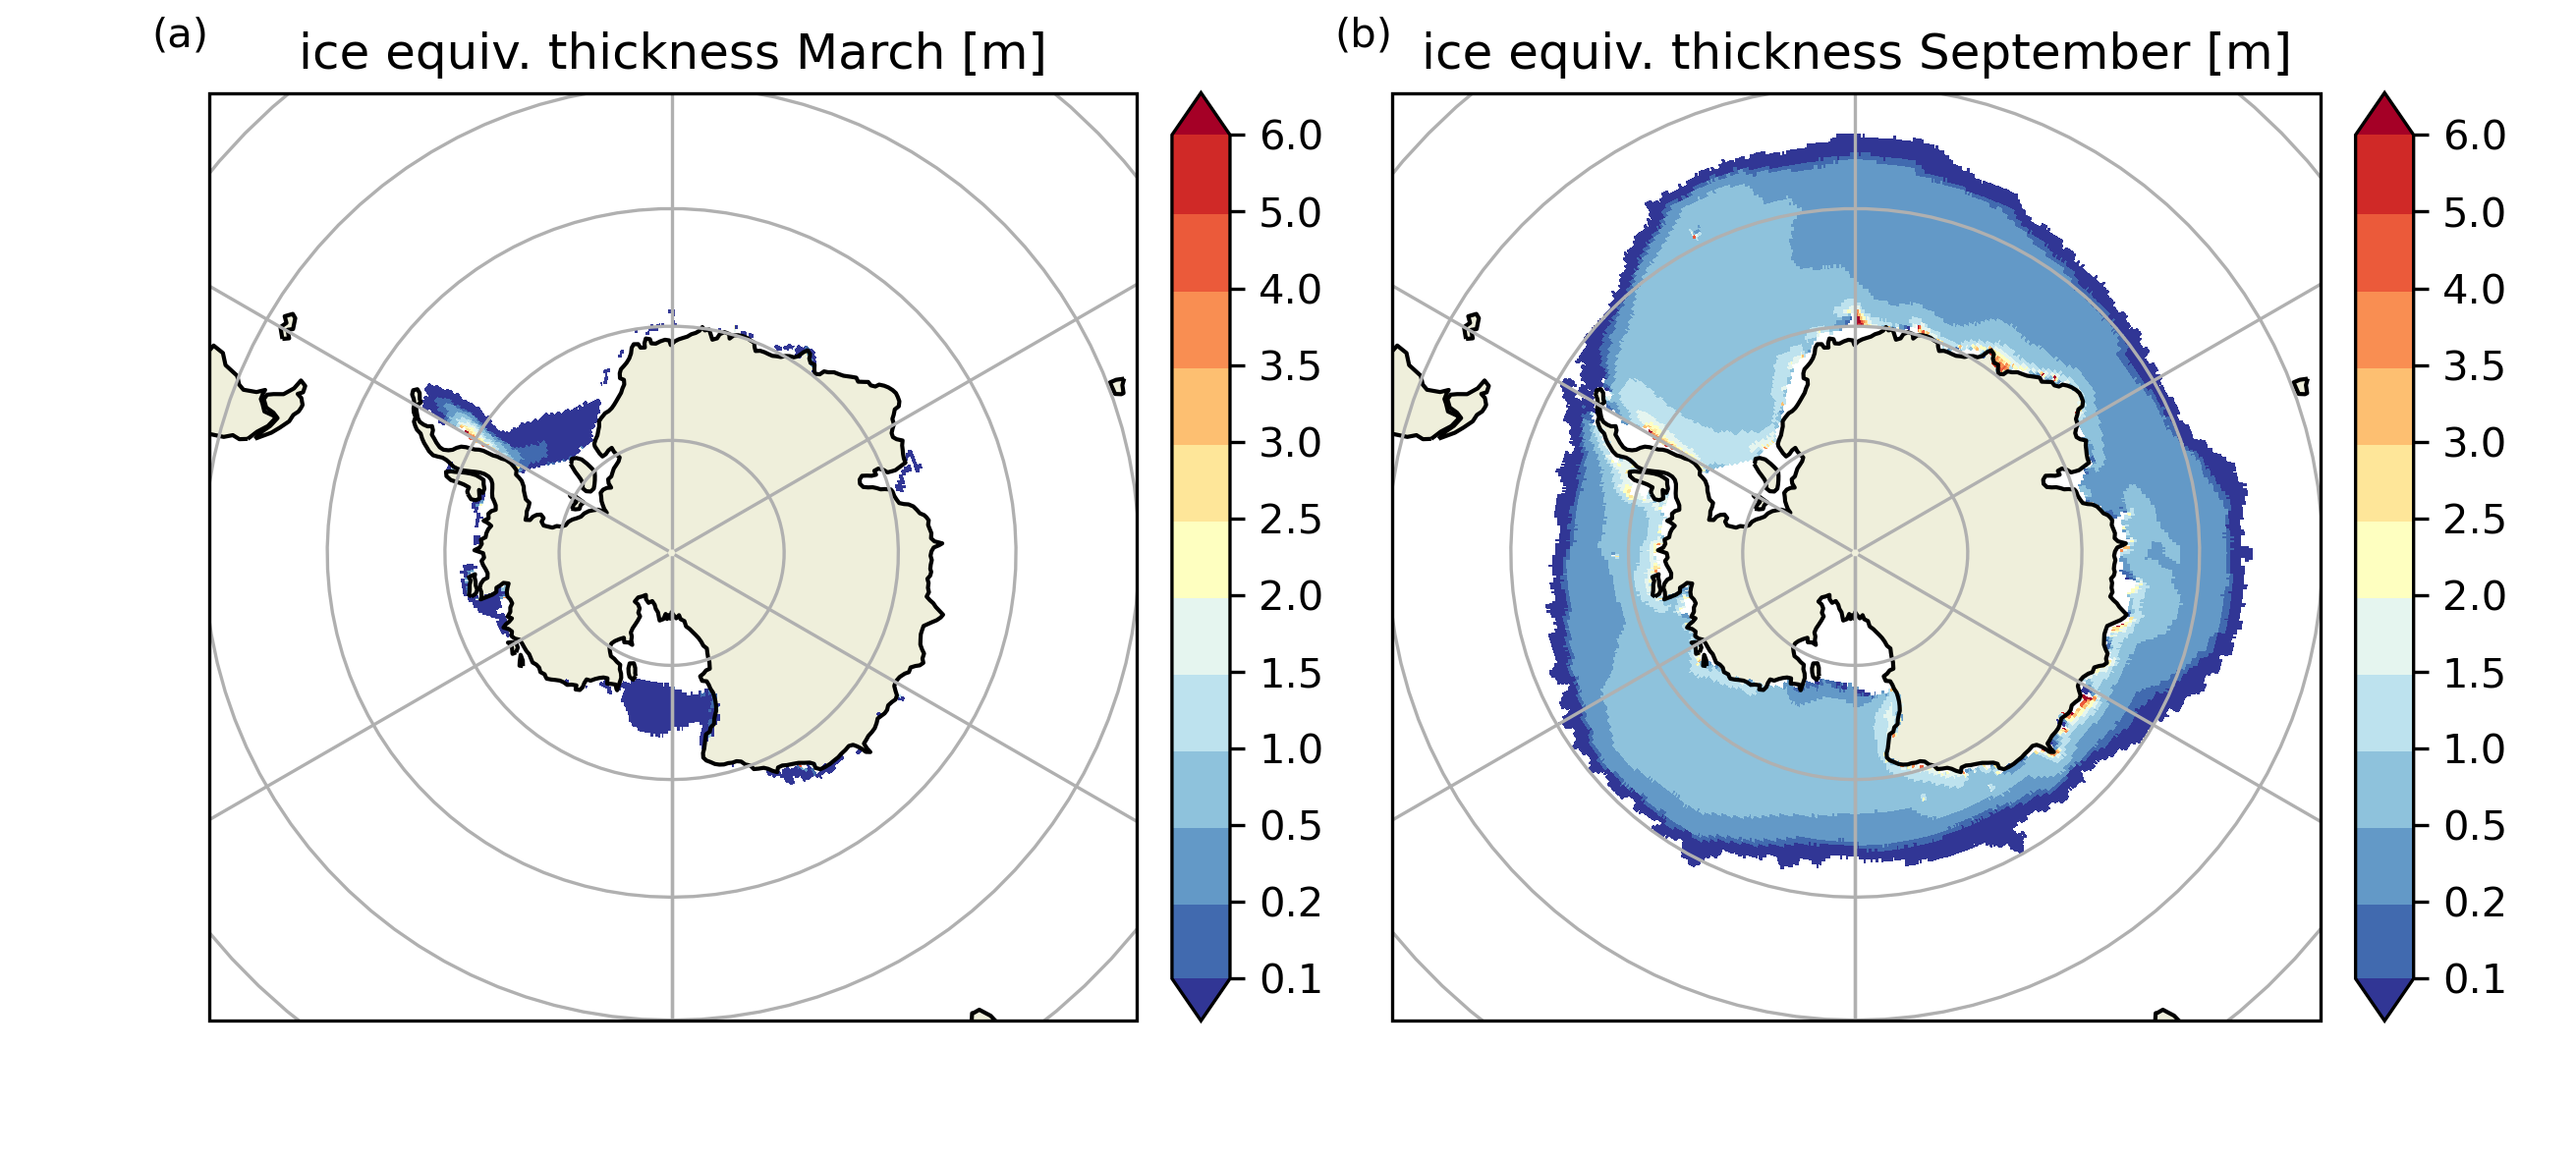
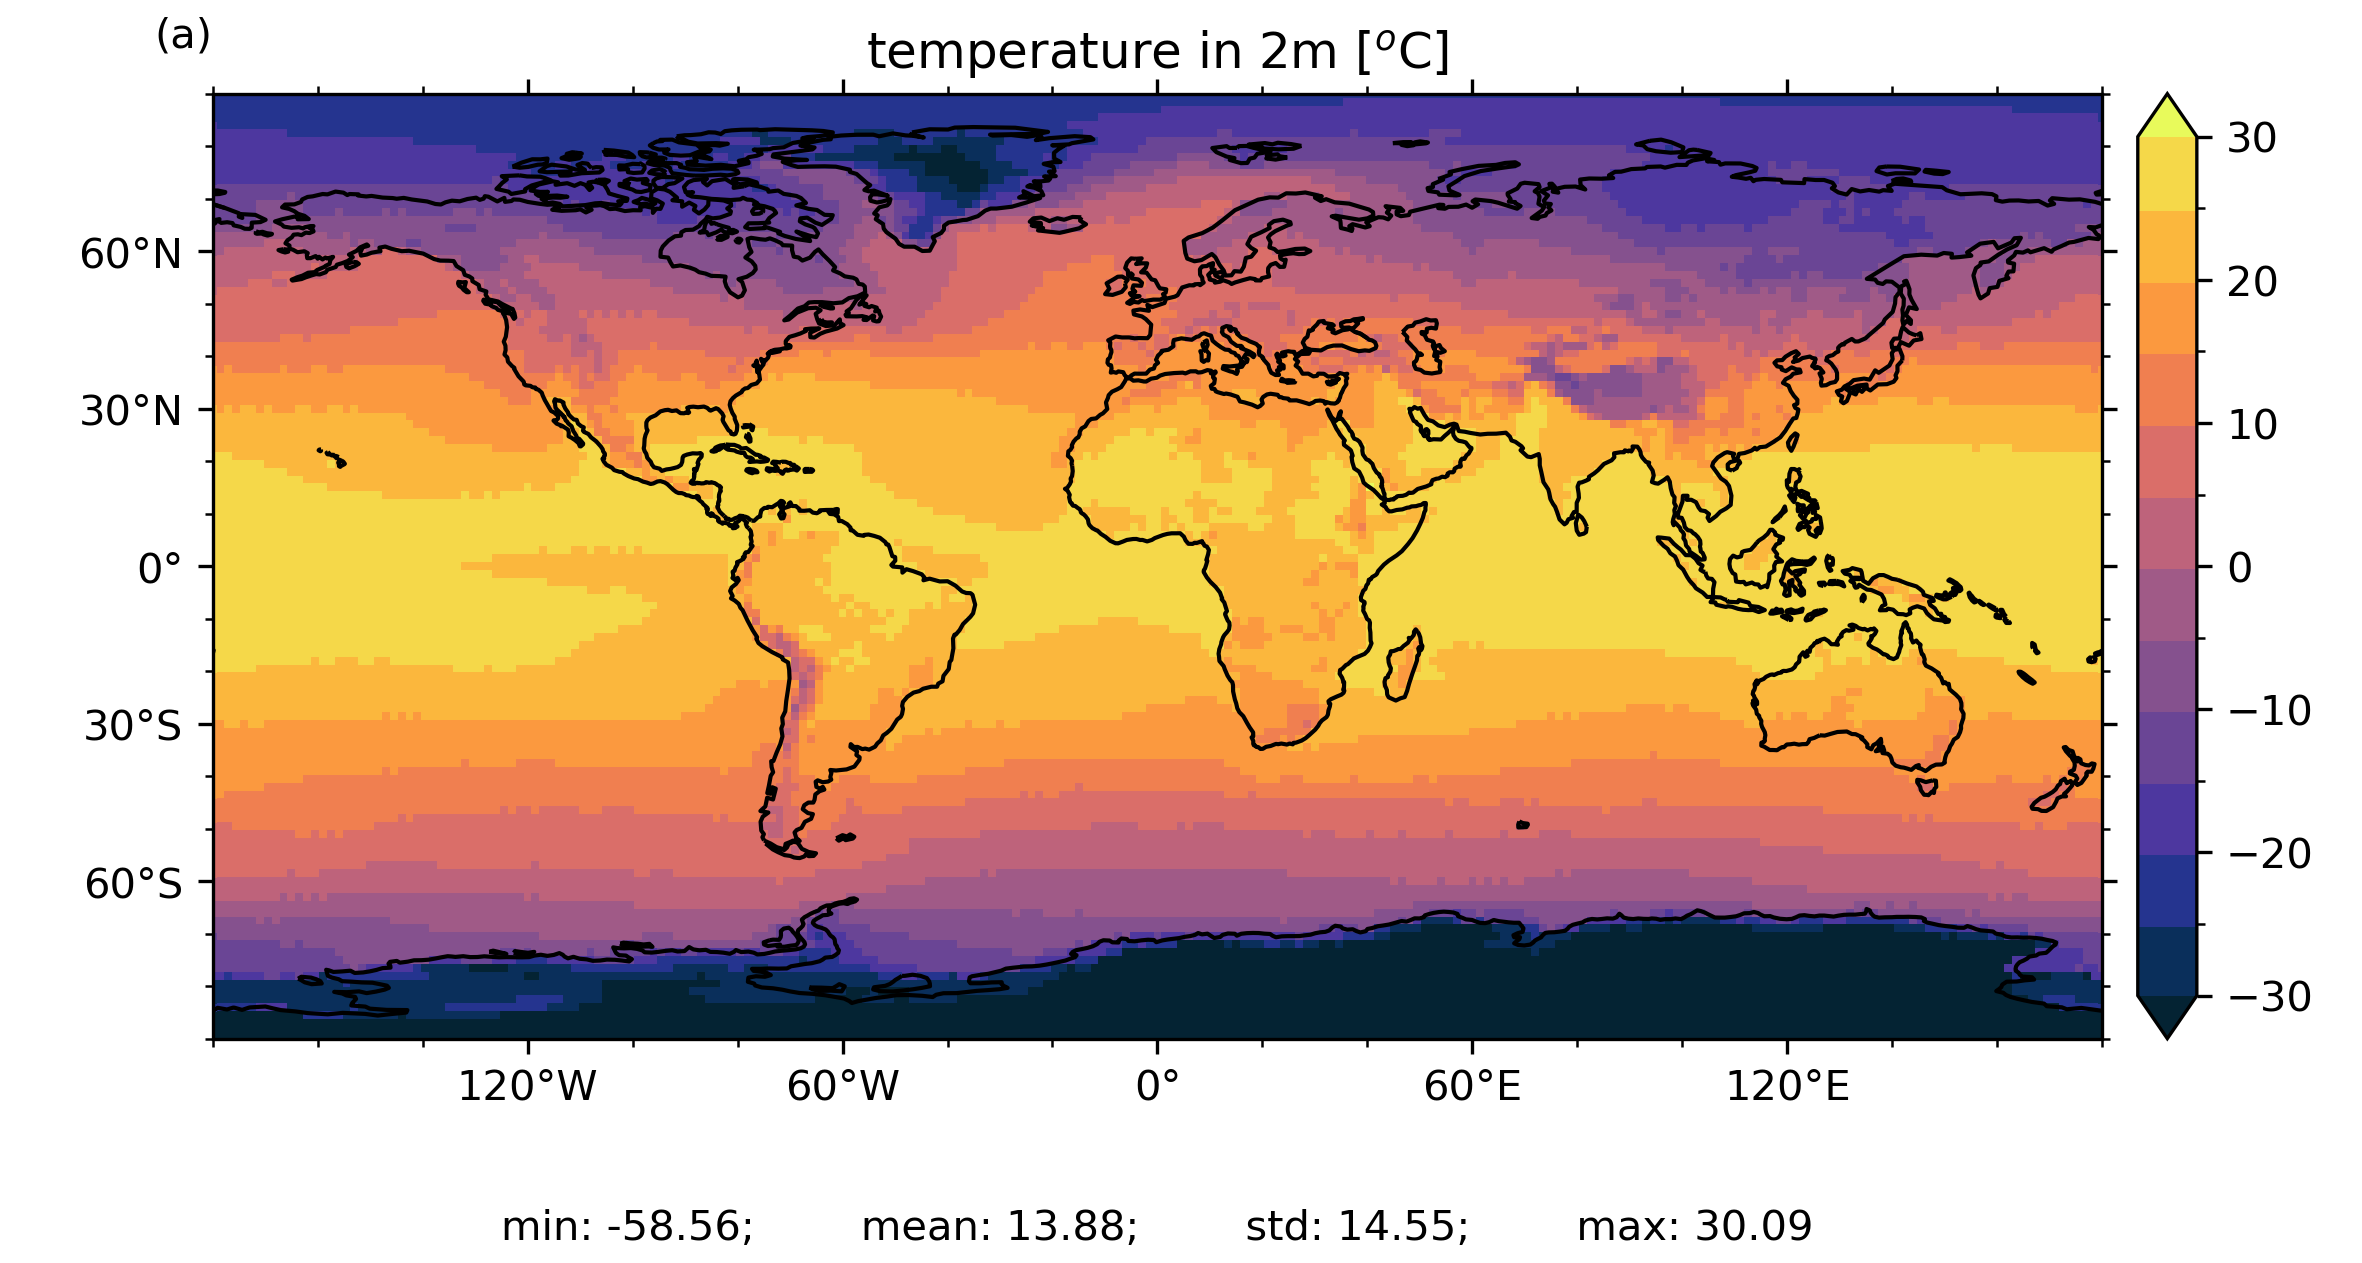
Sea ice equiv. thickness NH
Sea ice equiv. thickness SH
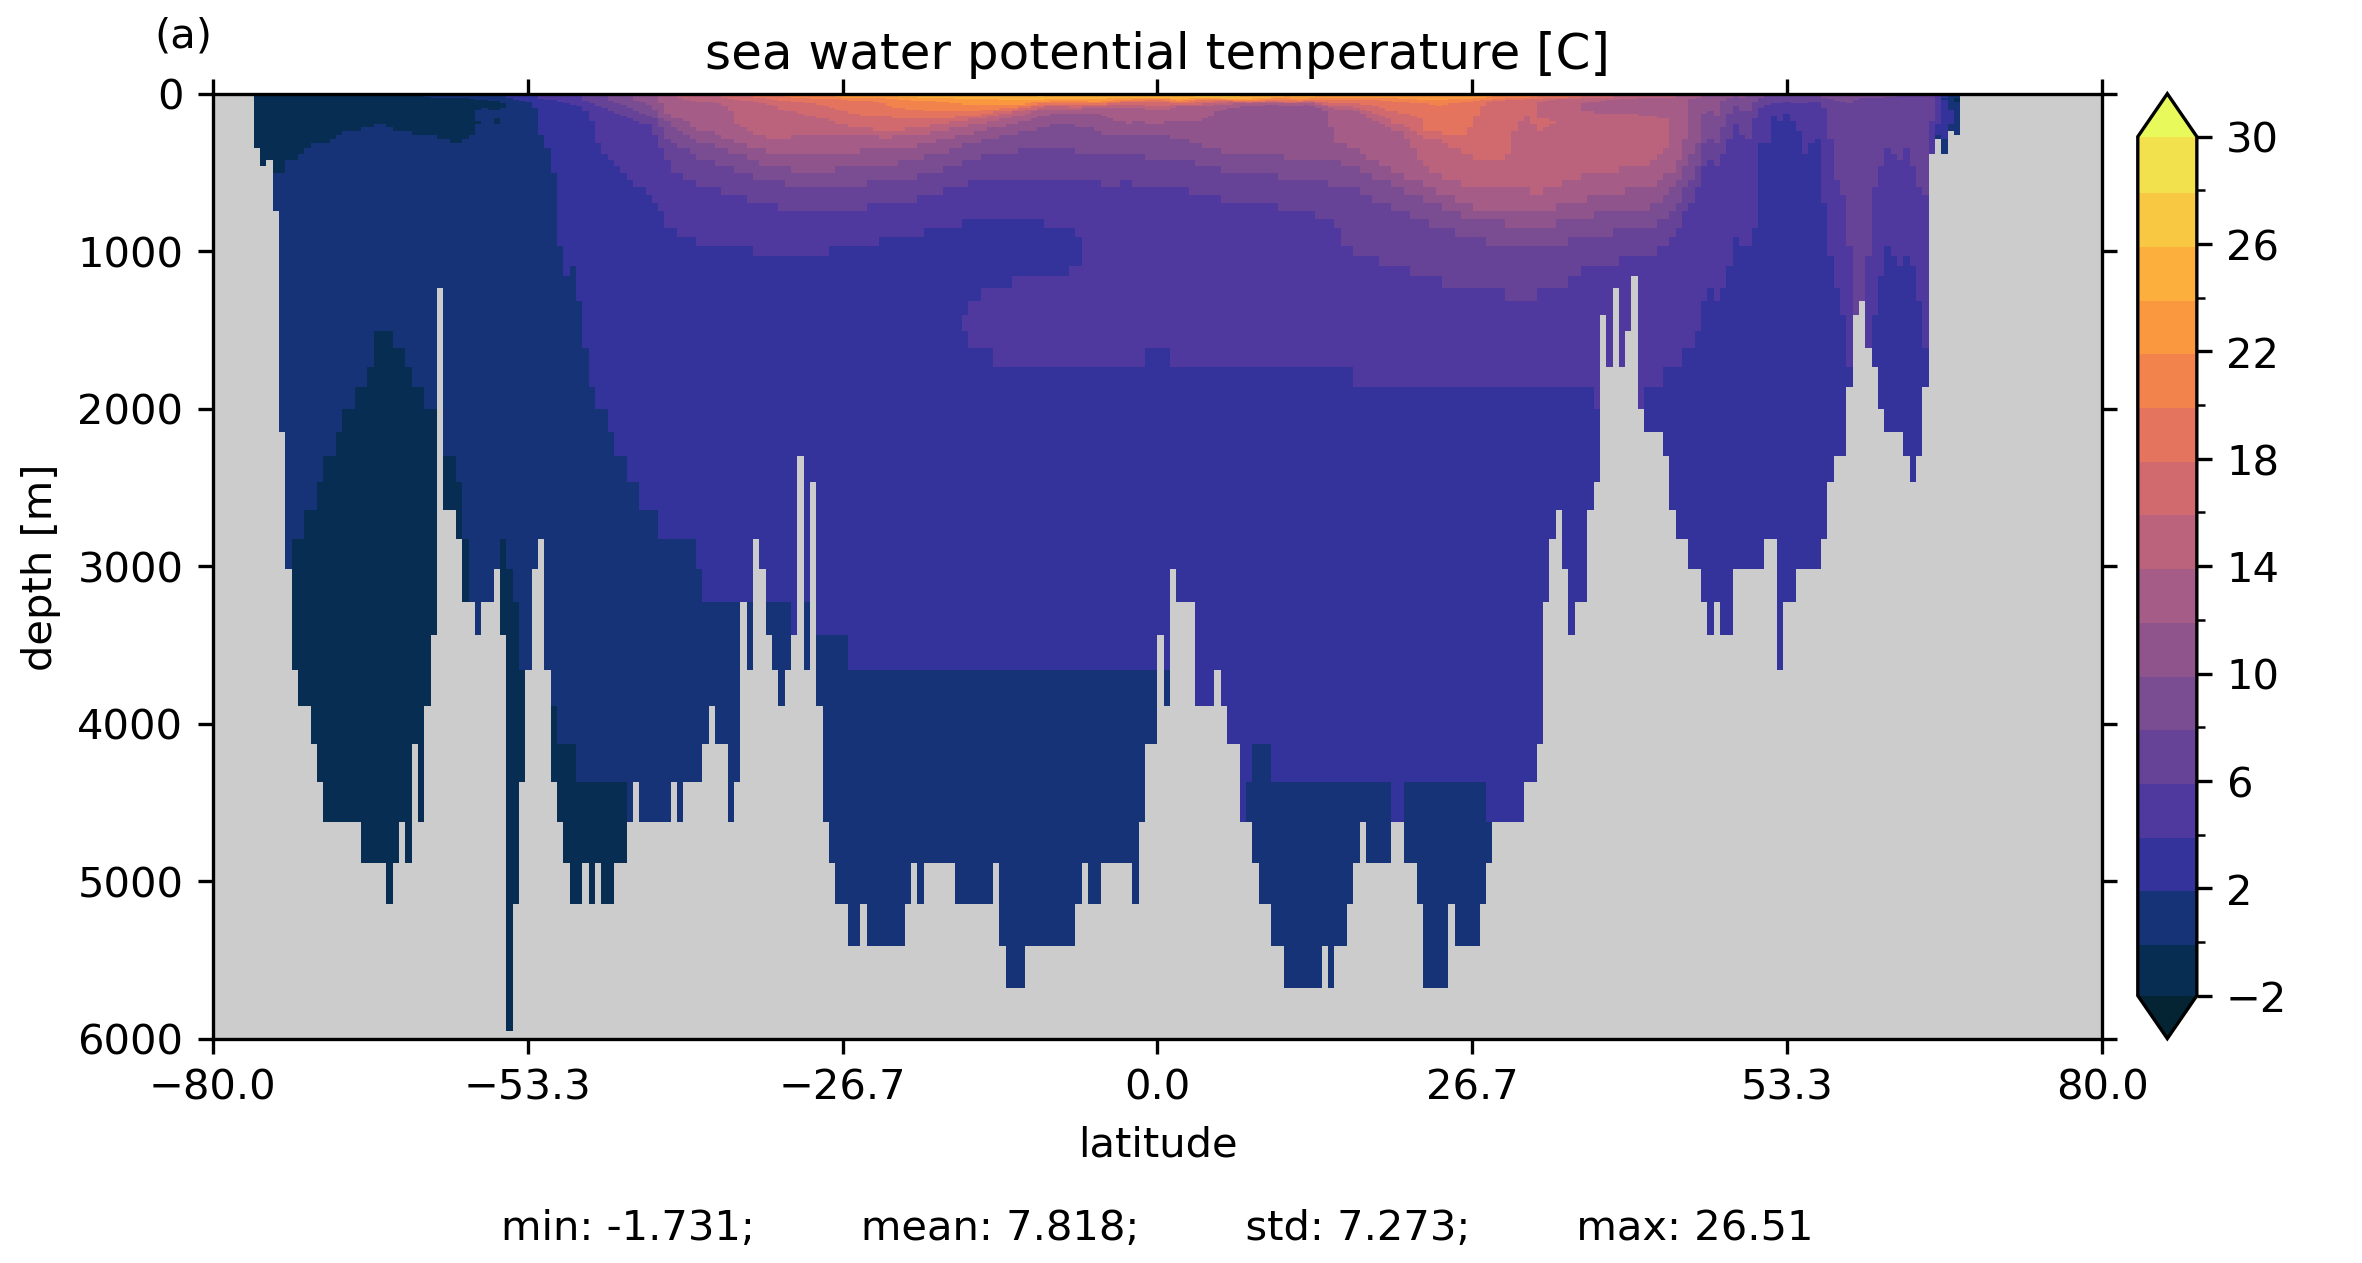
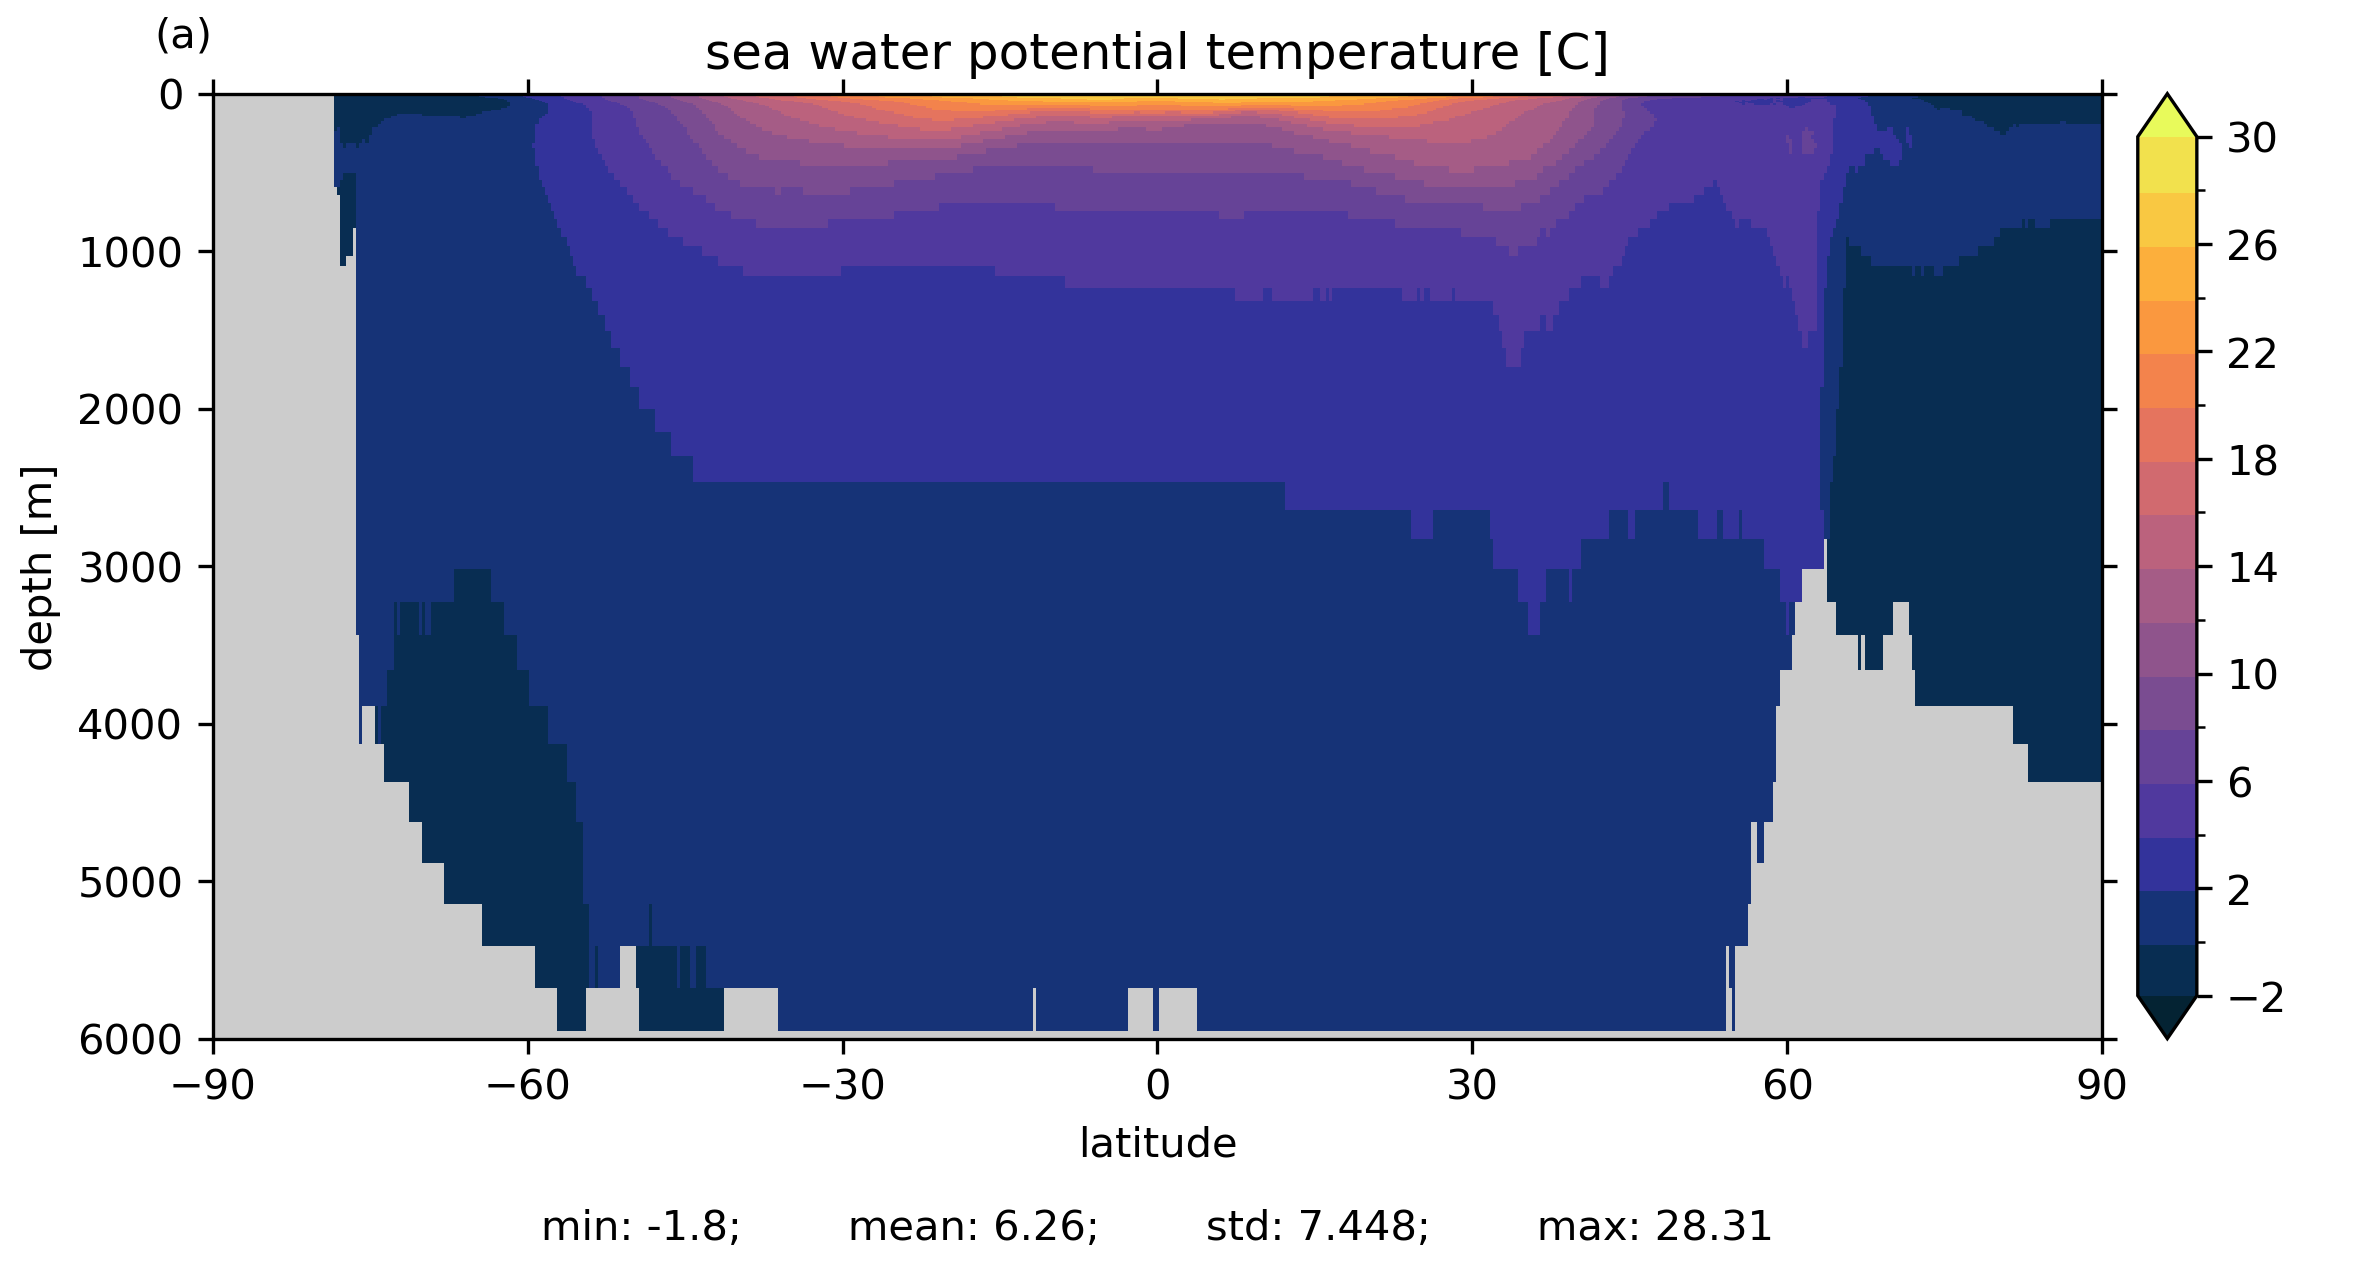
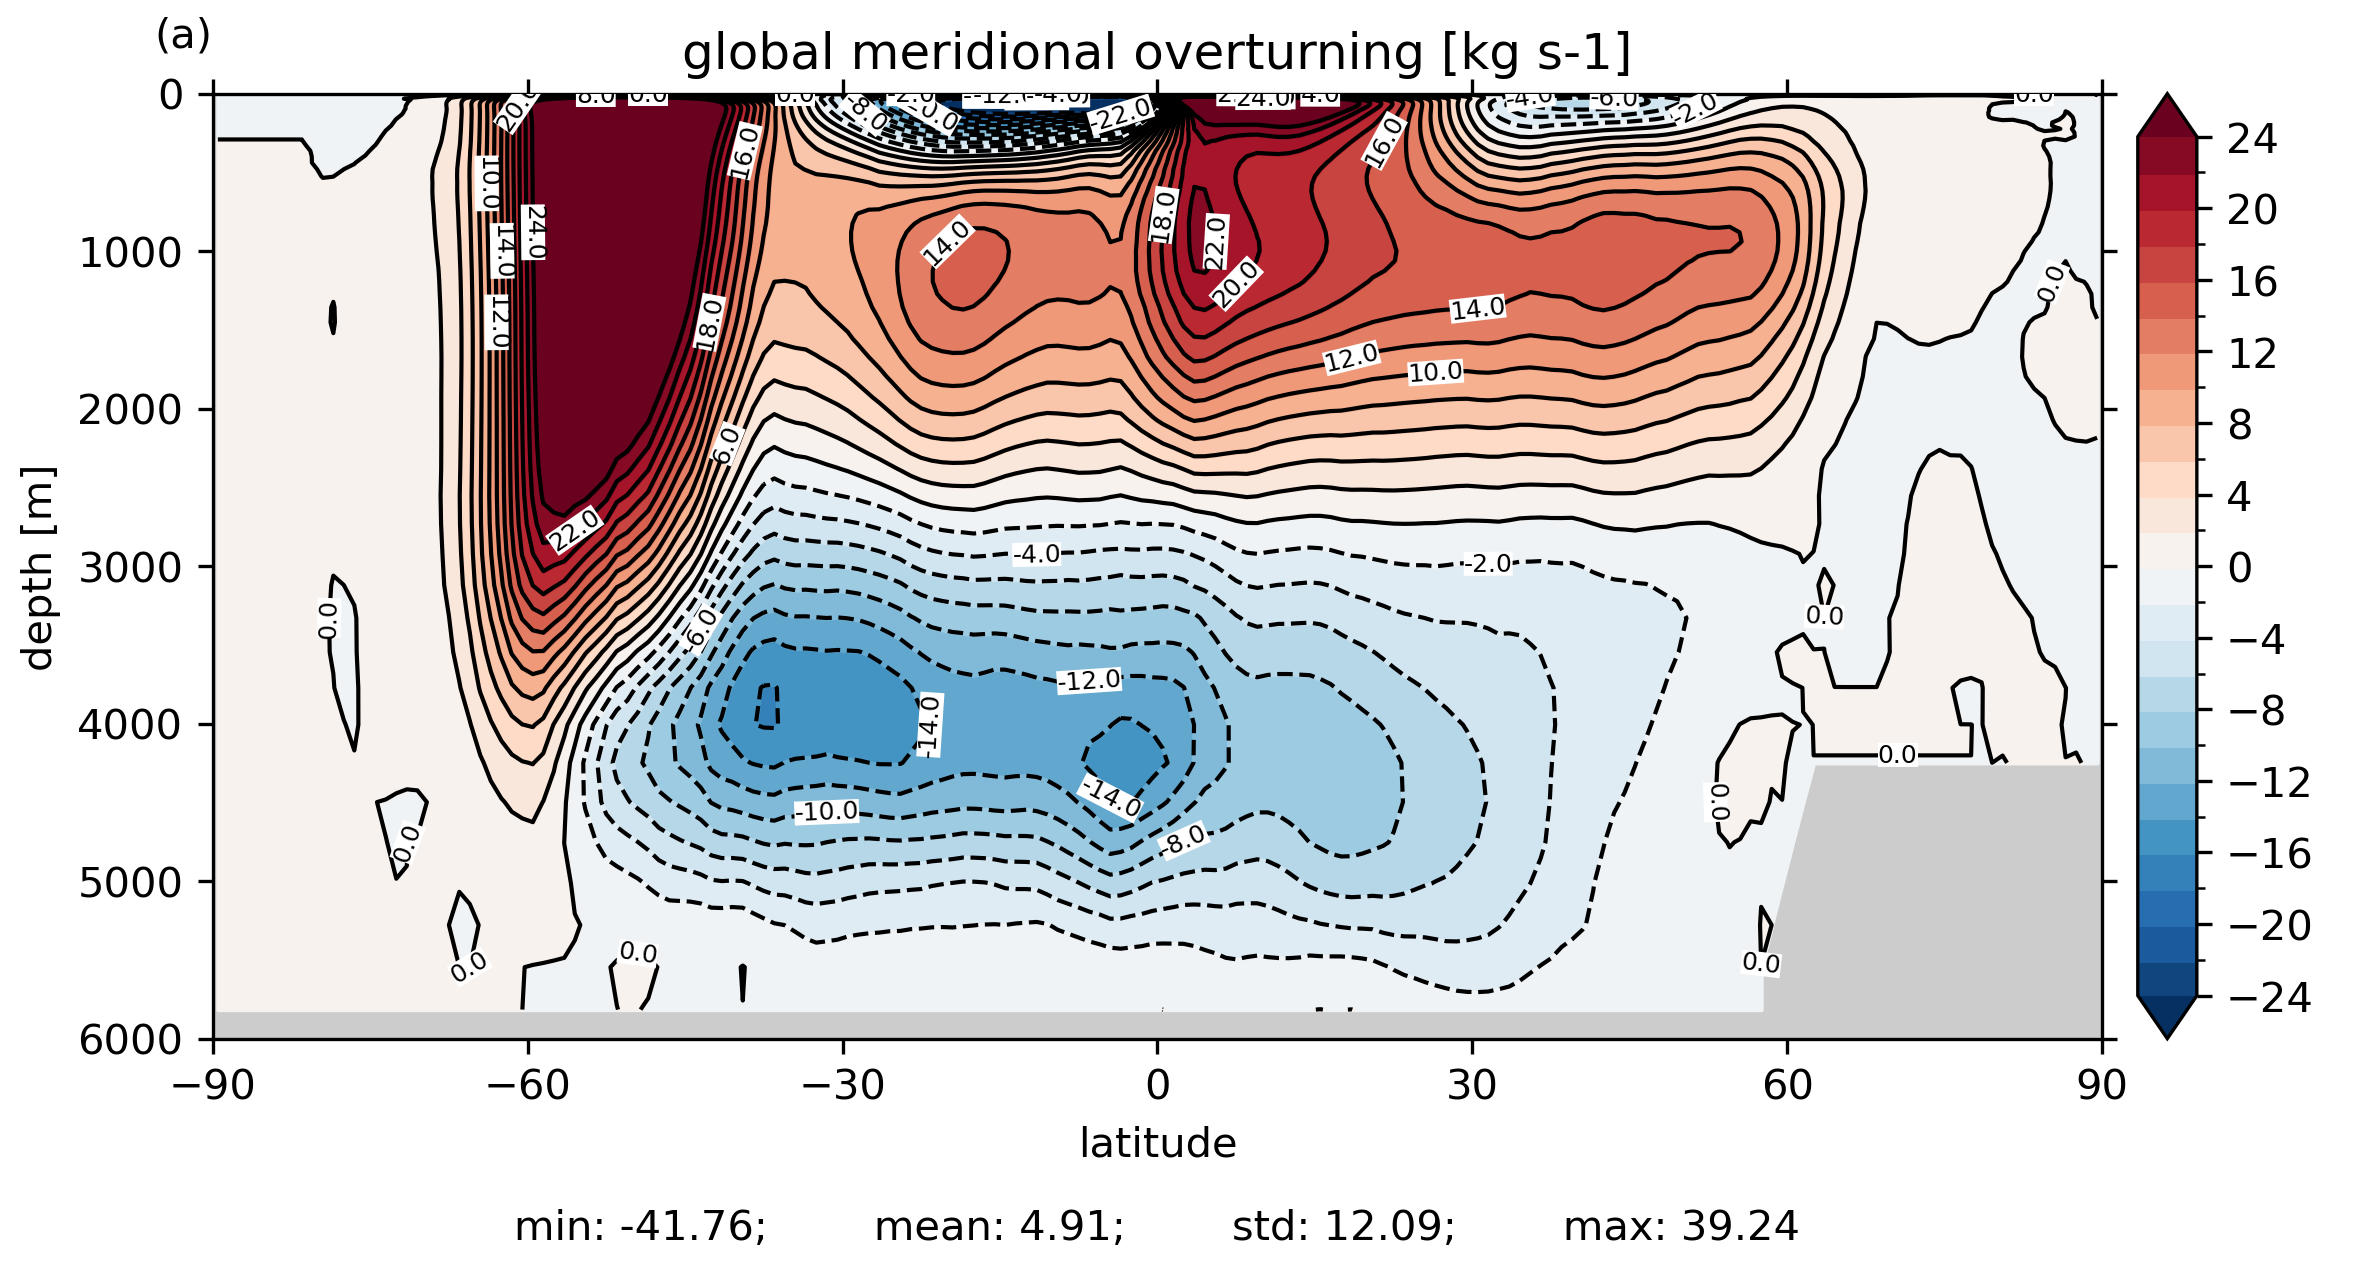
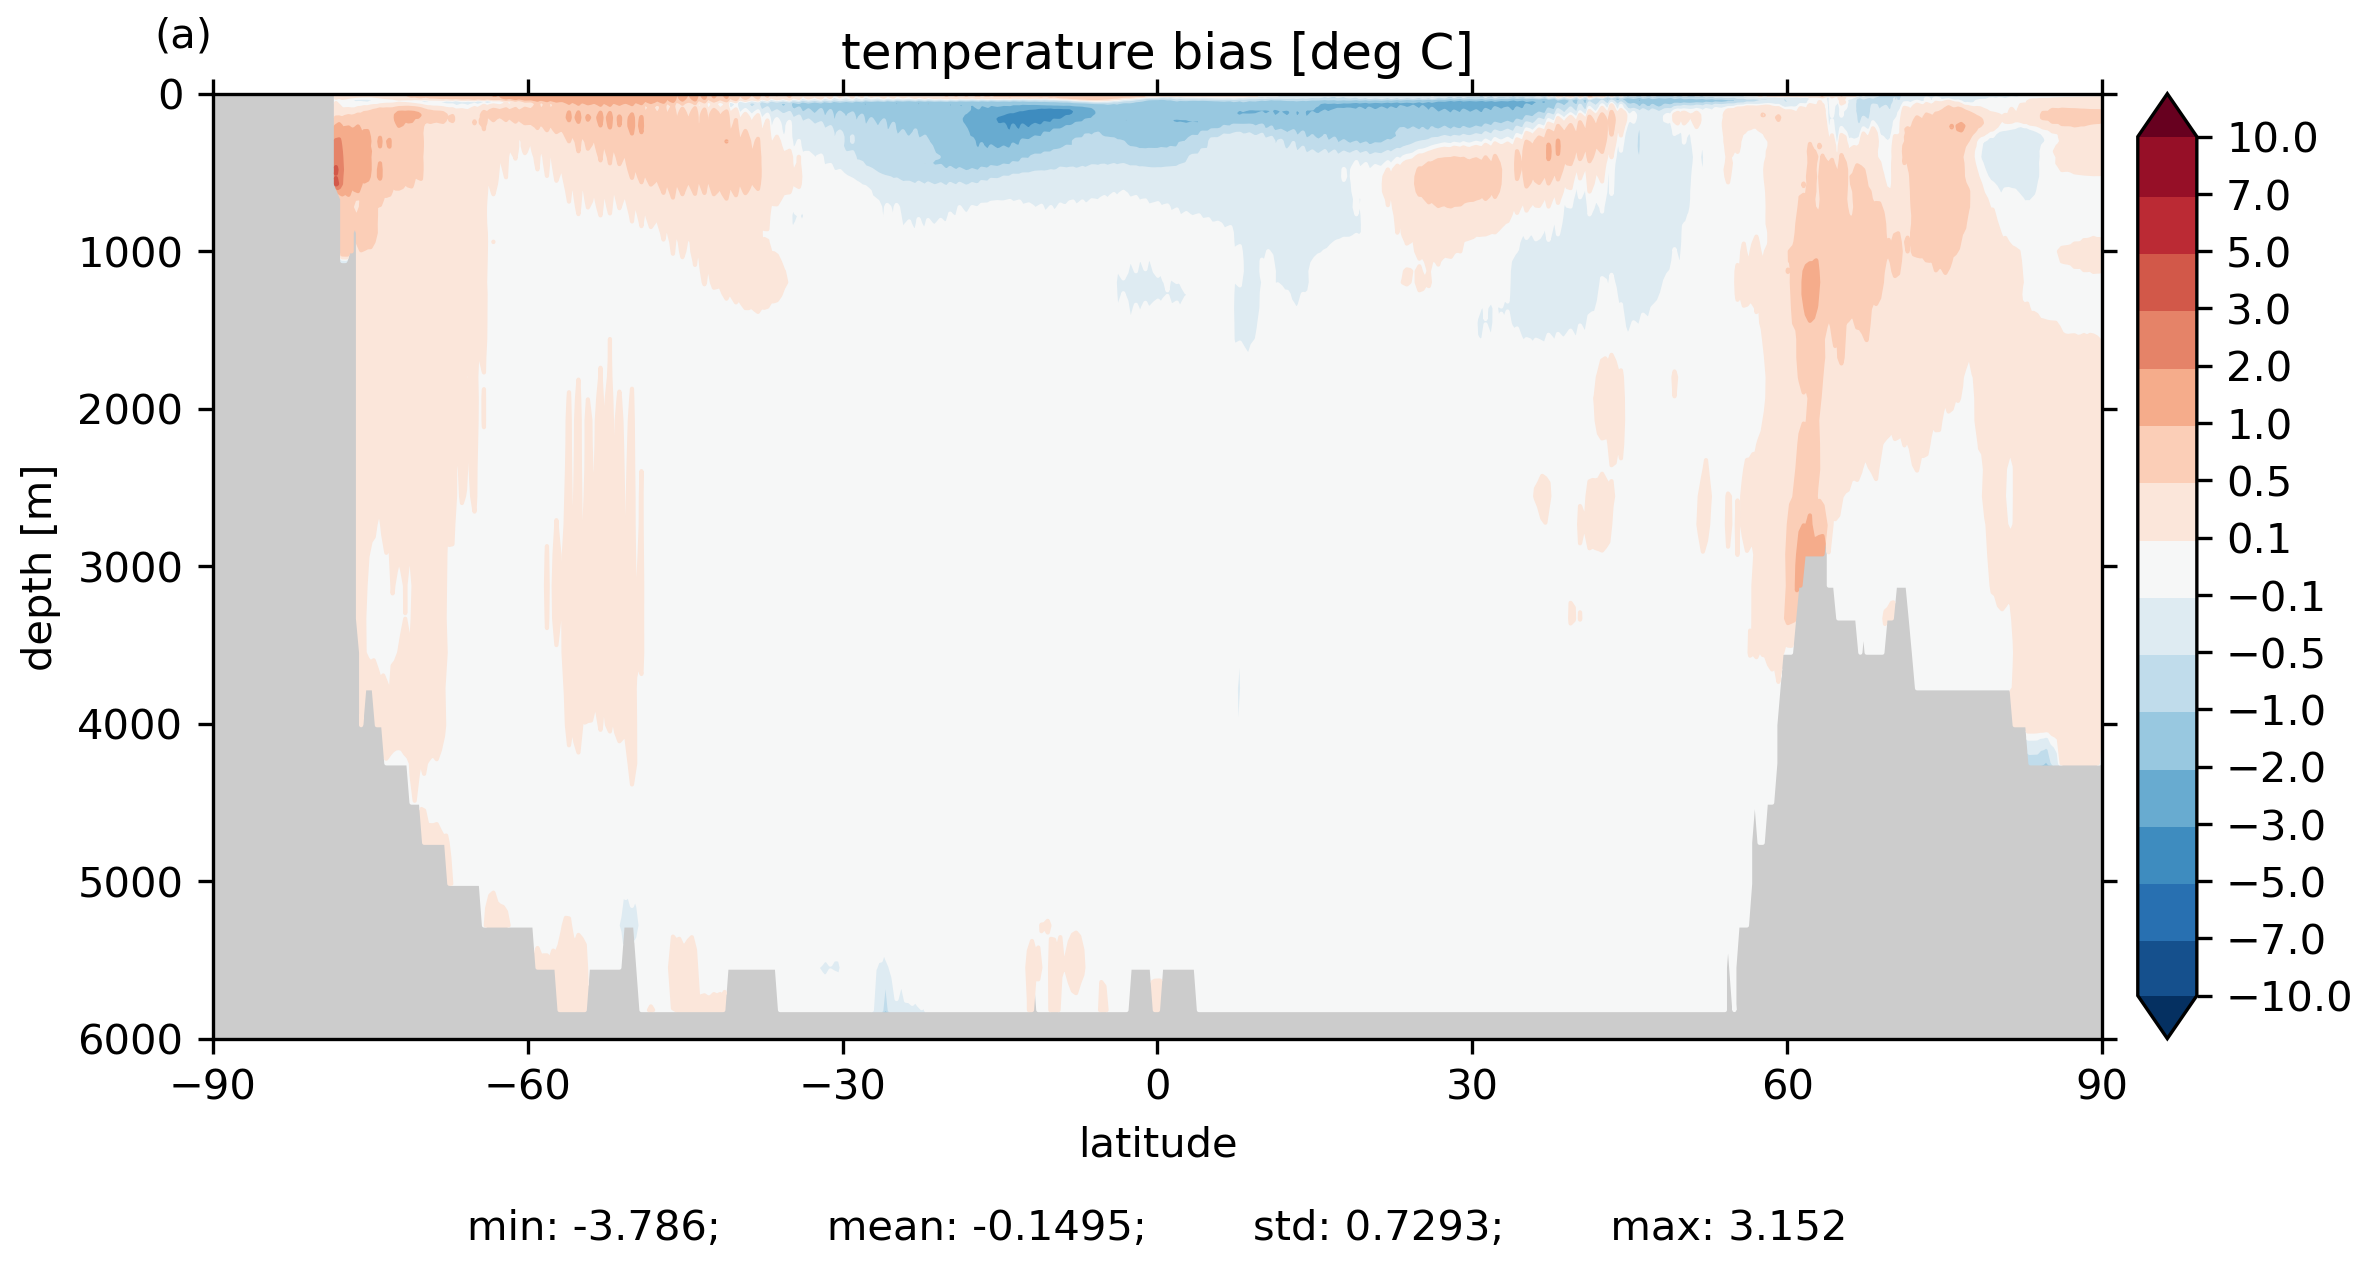
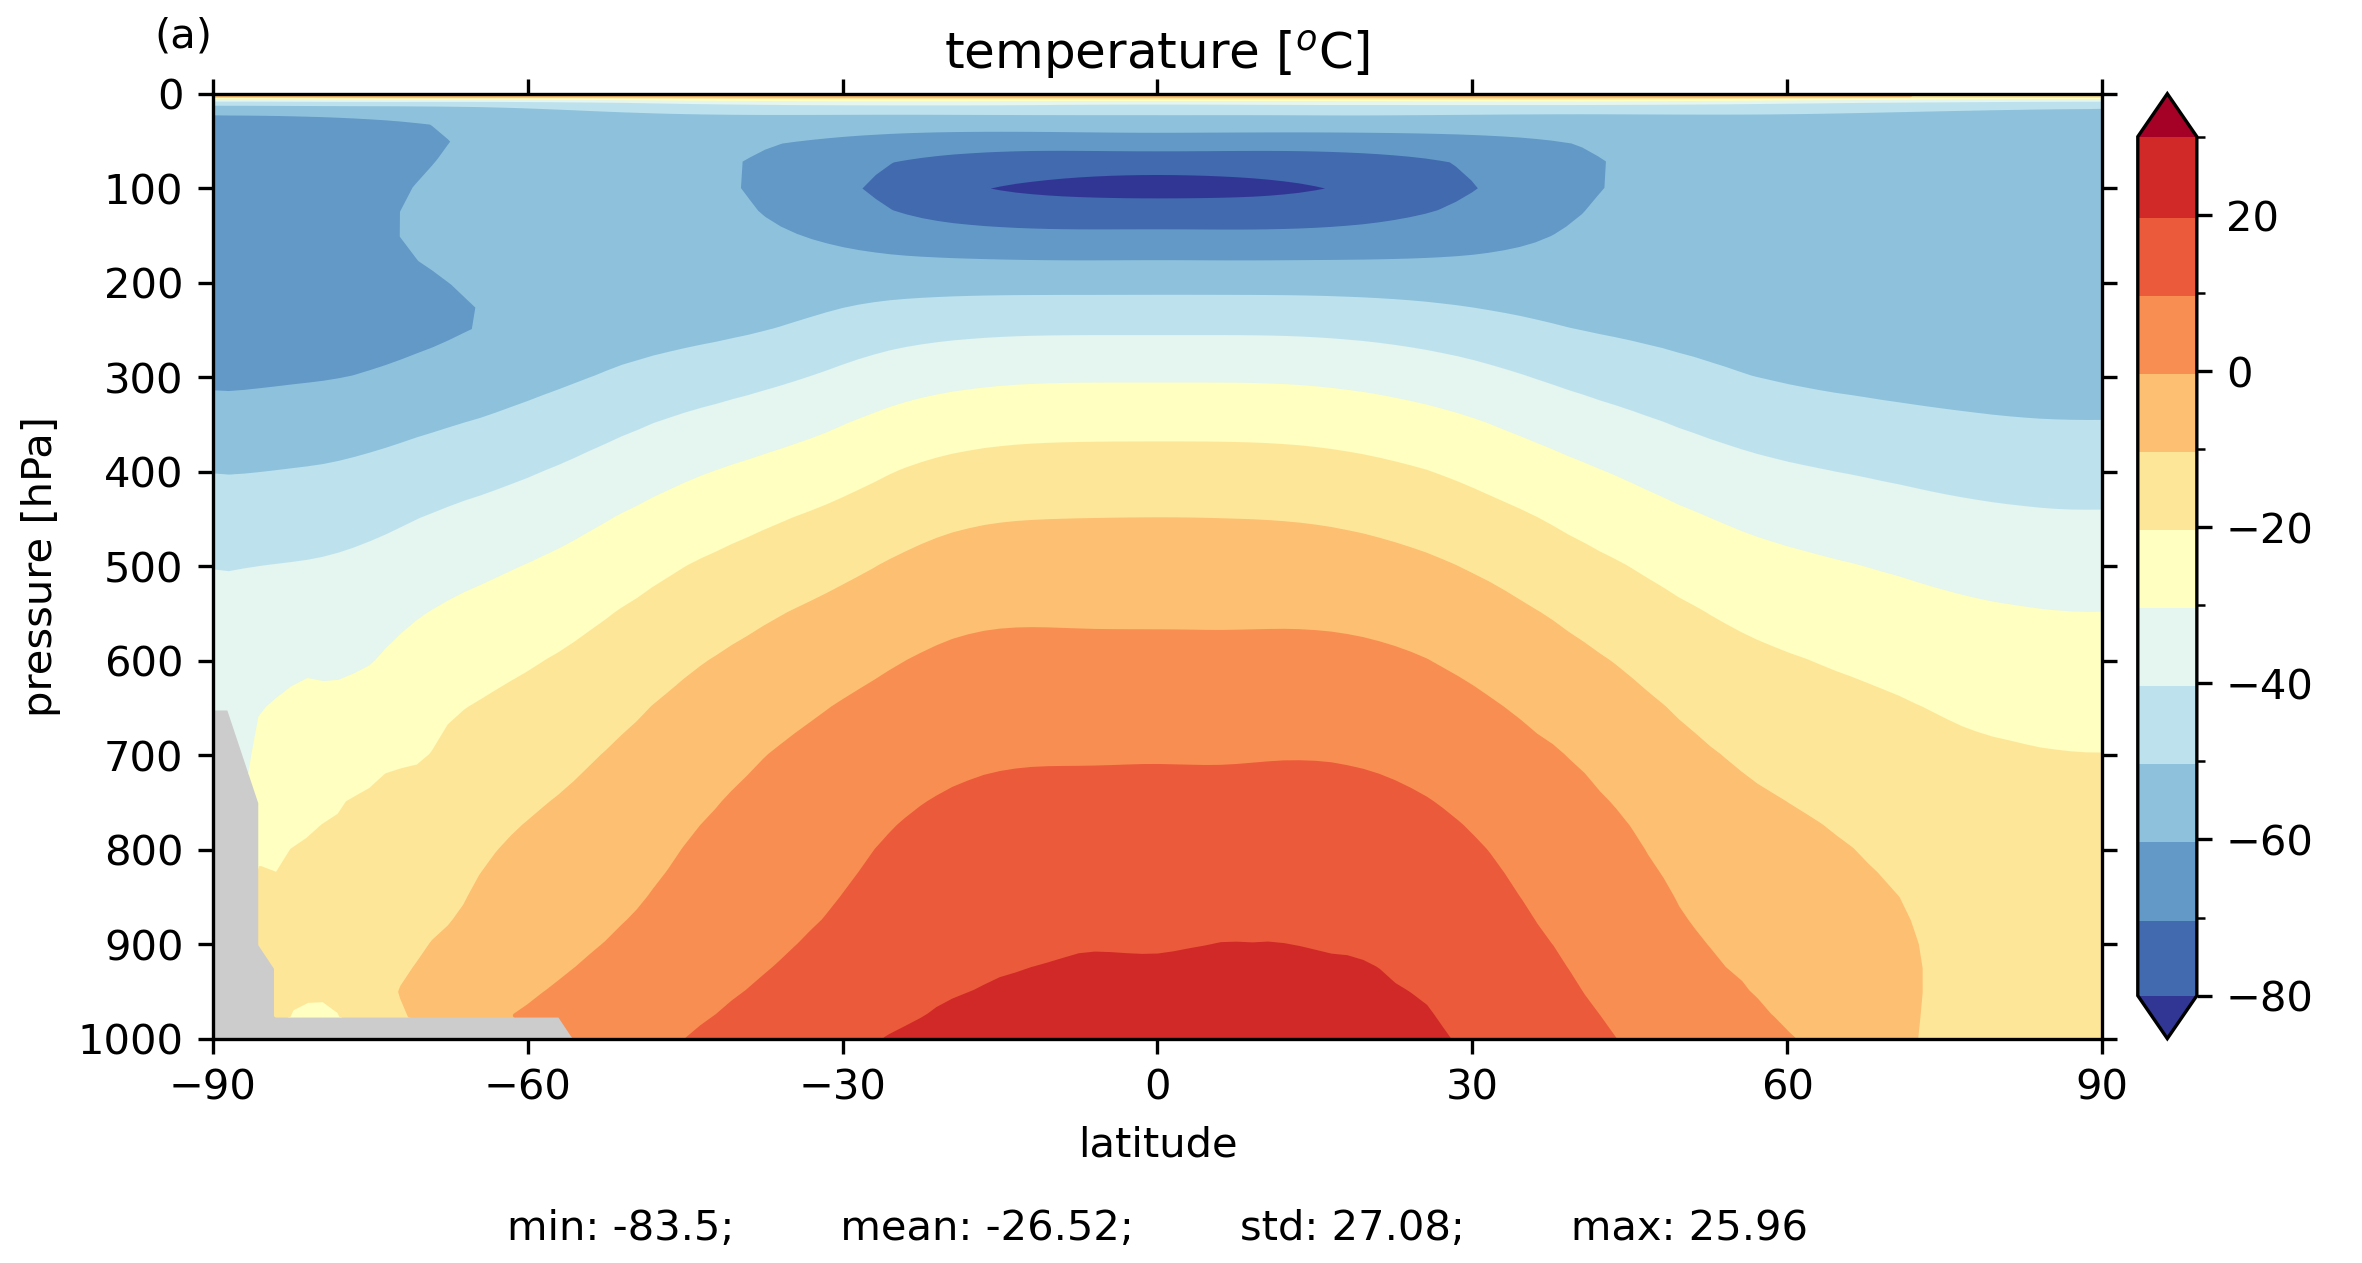
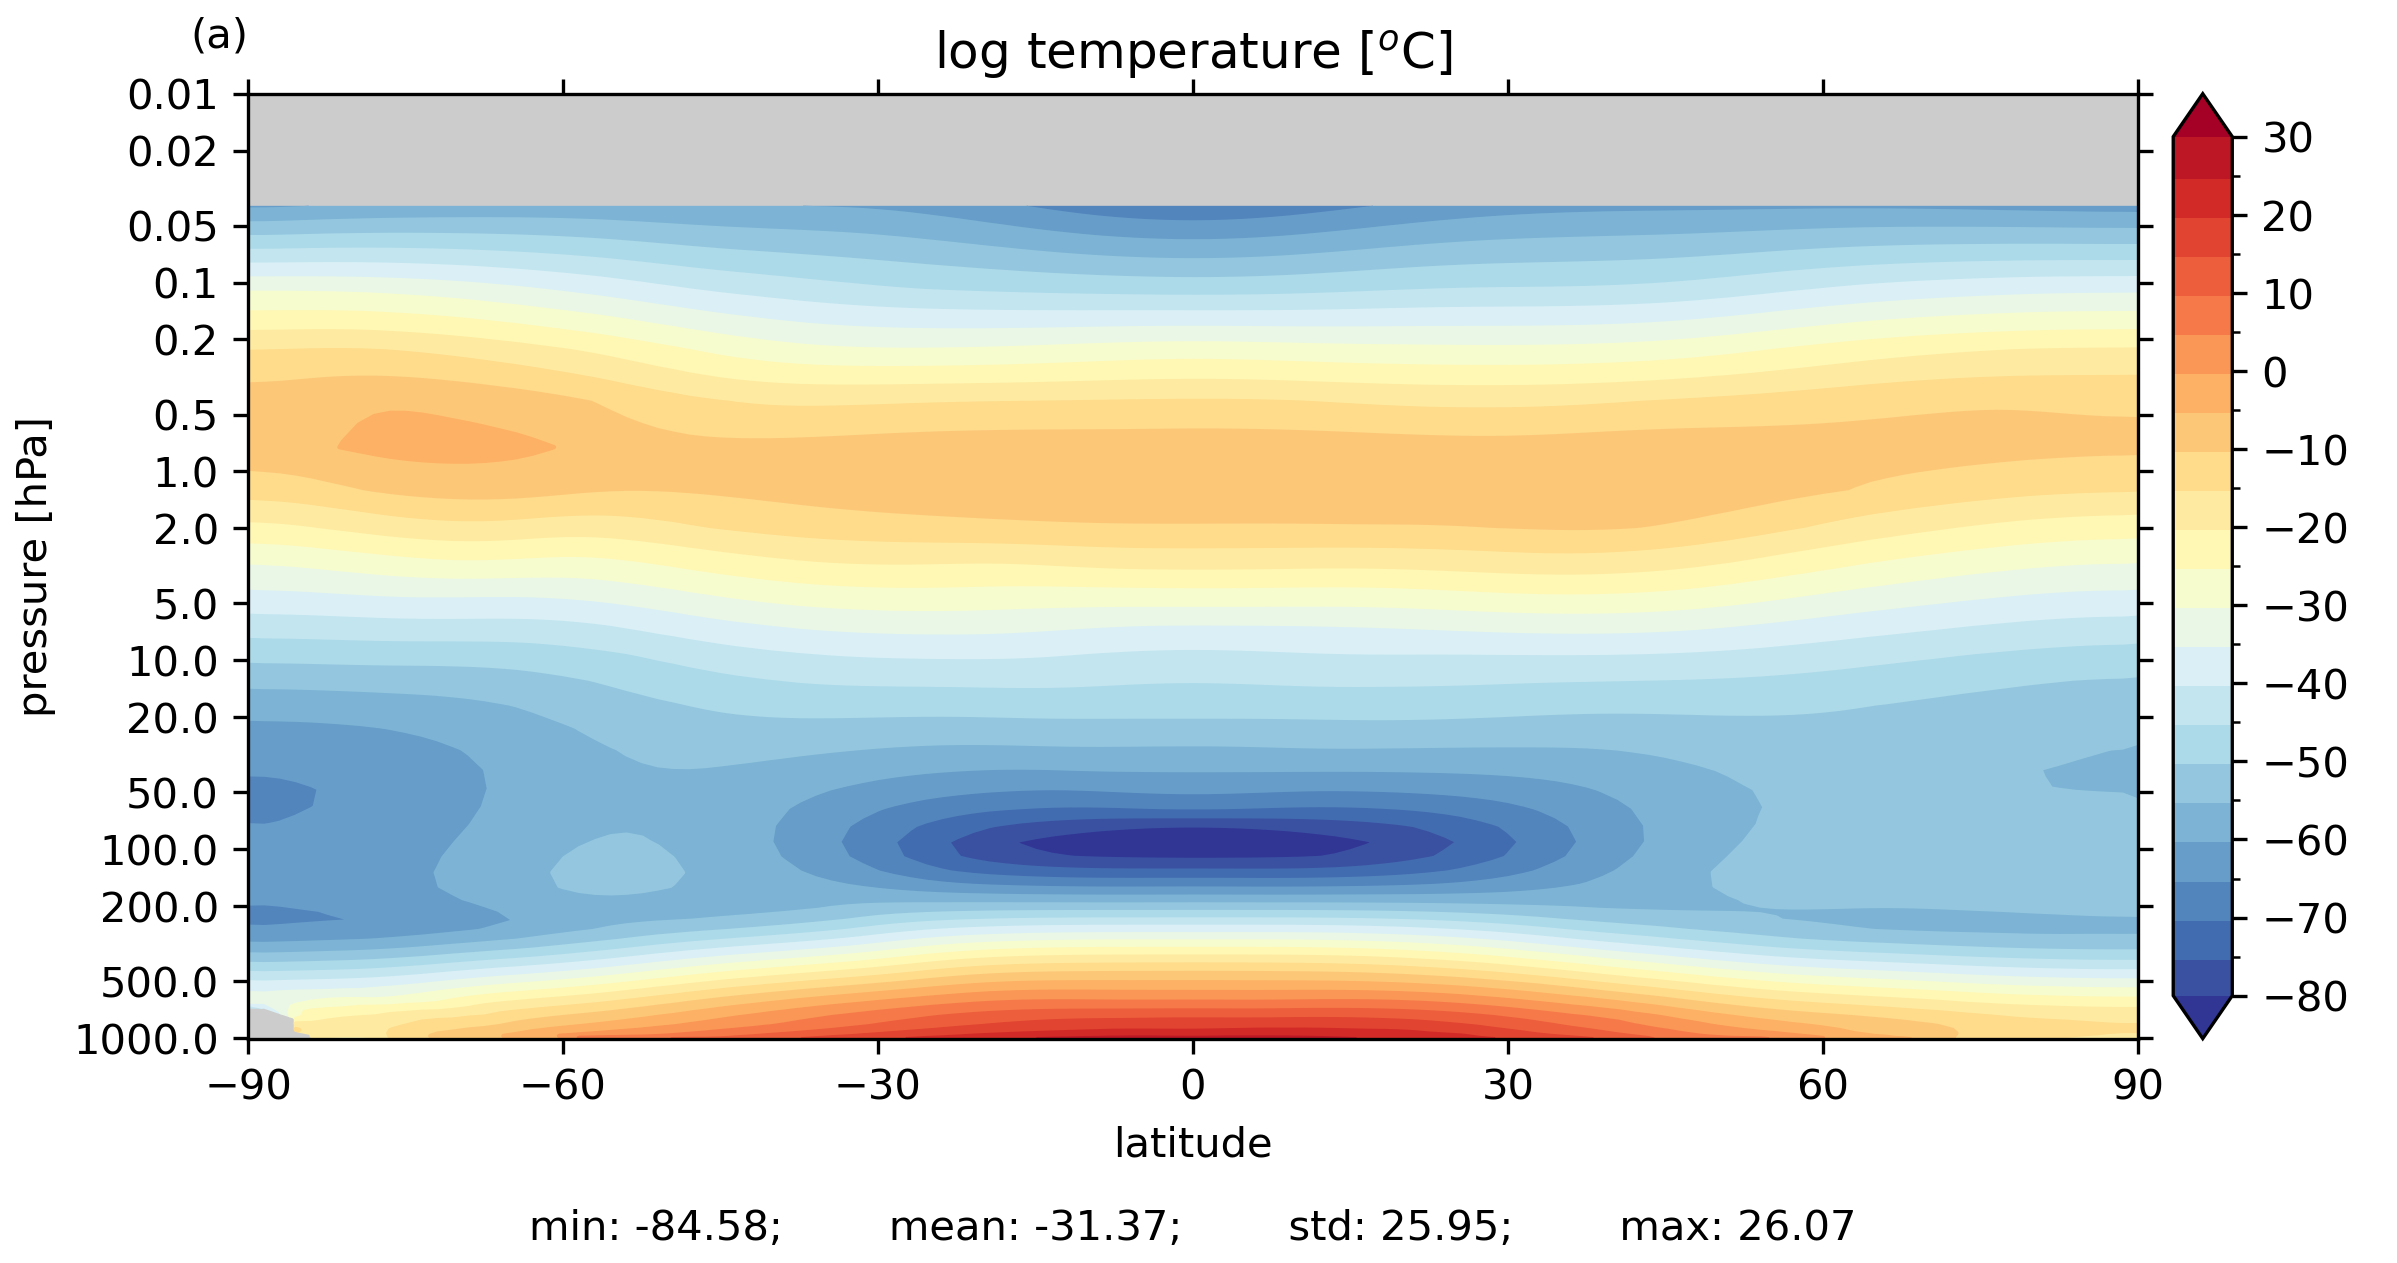
Temperature global zon. ave.
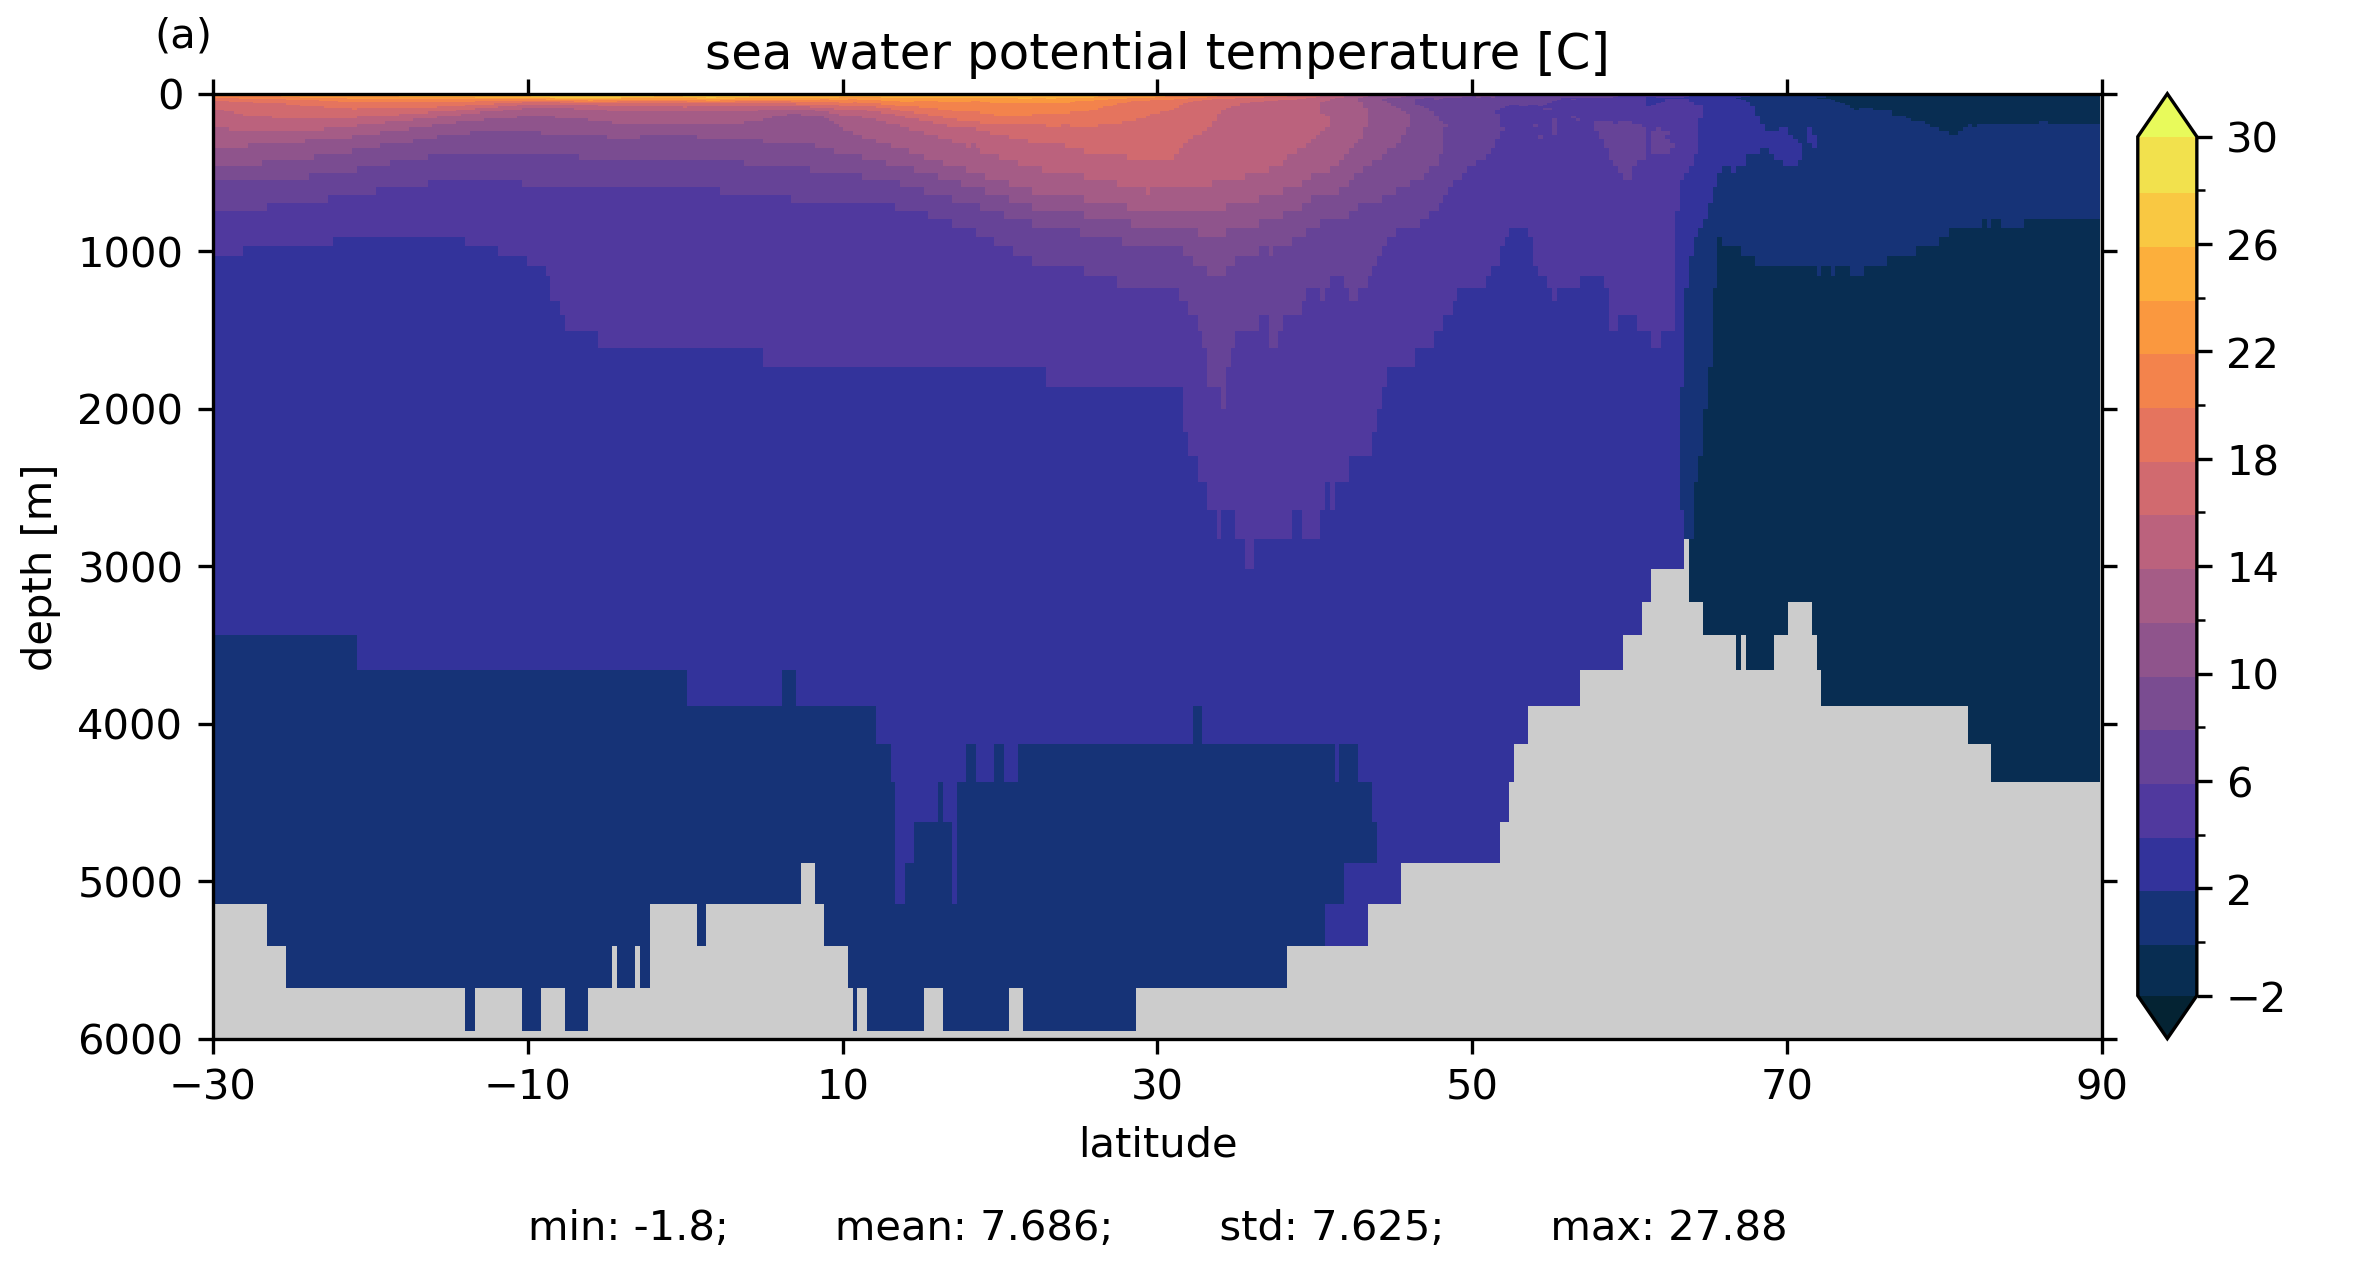
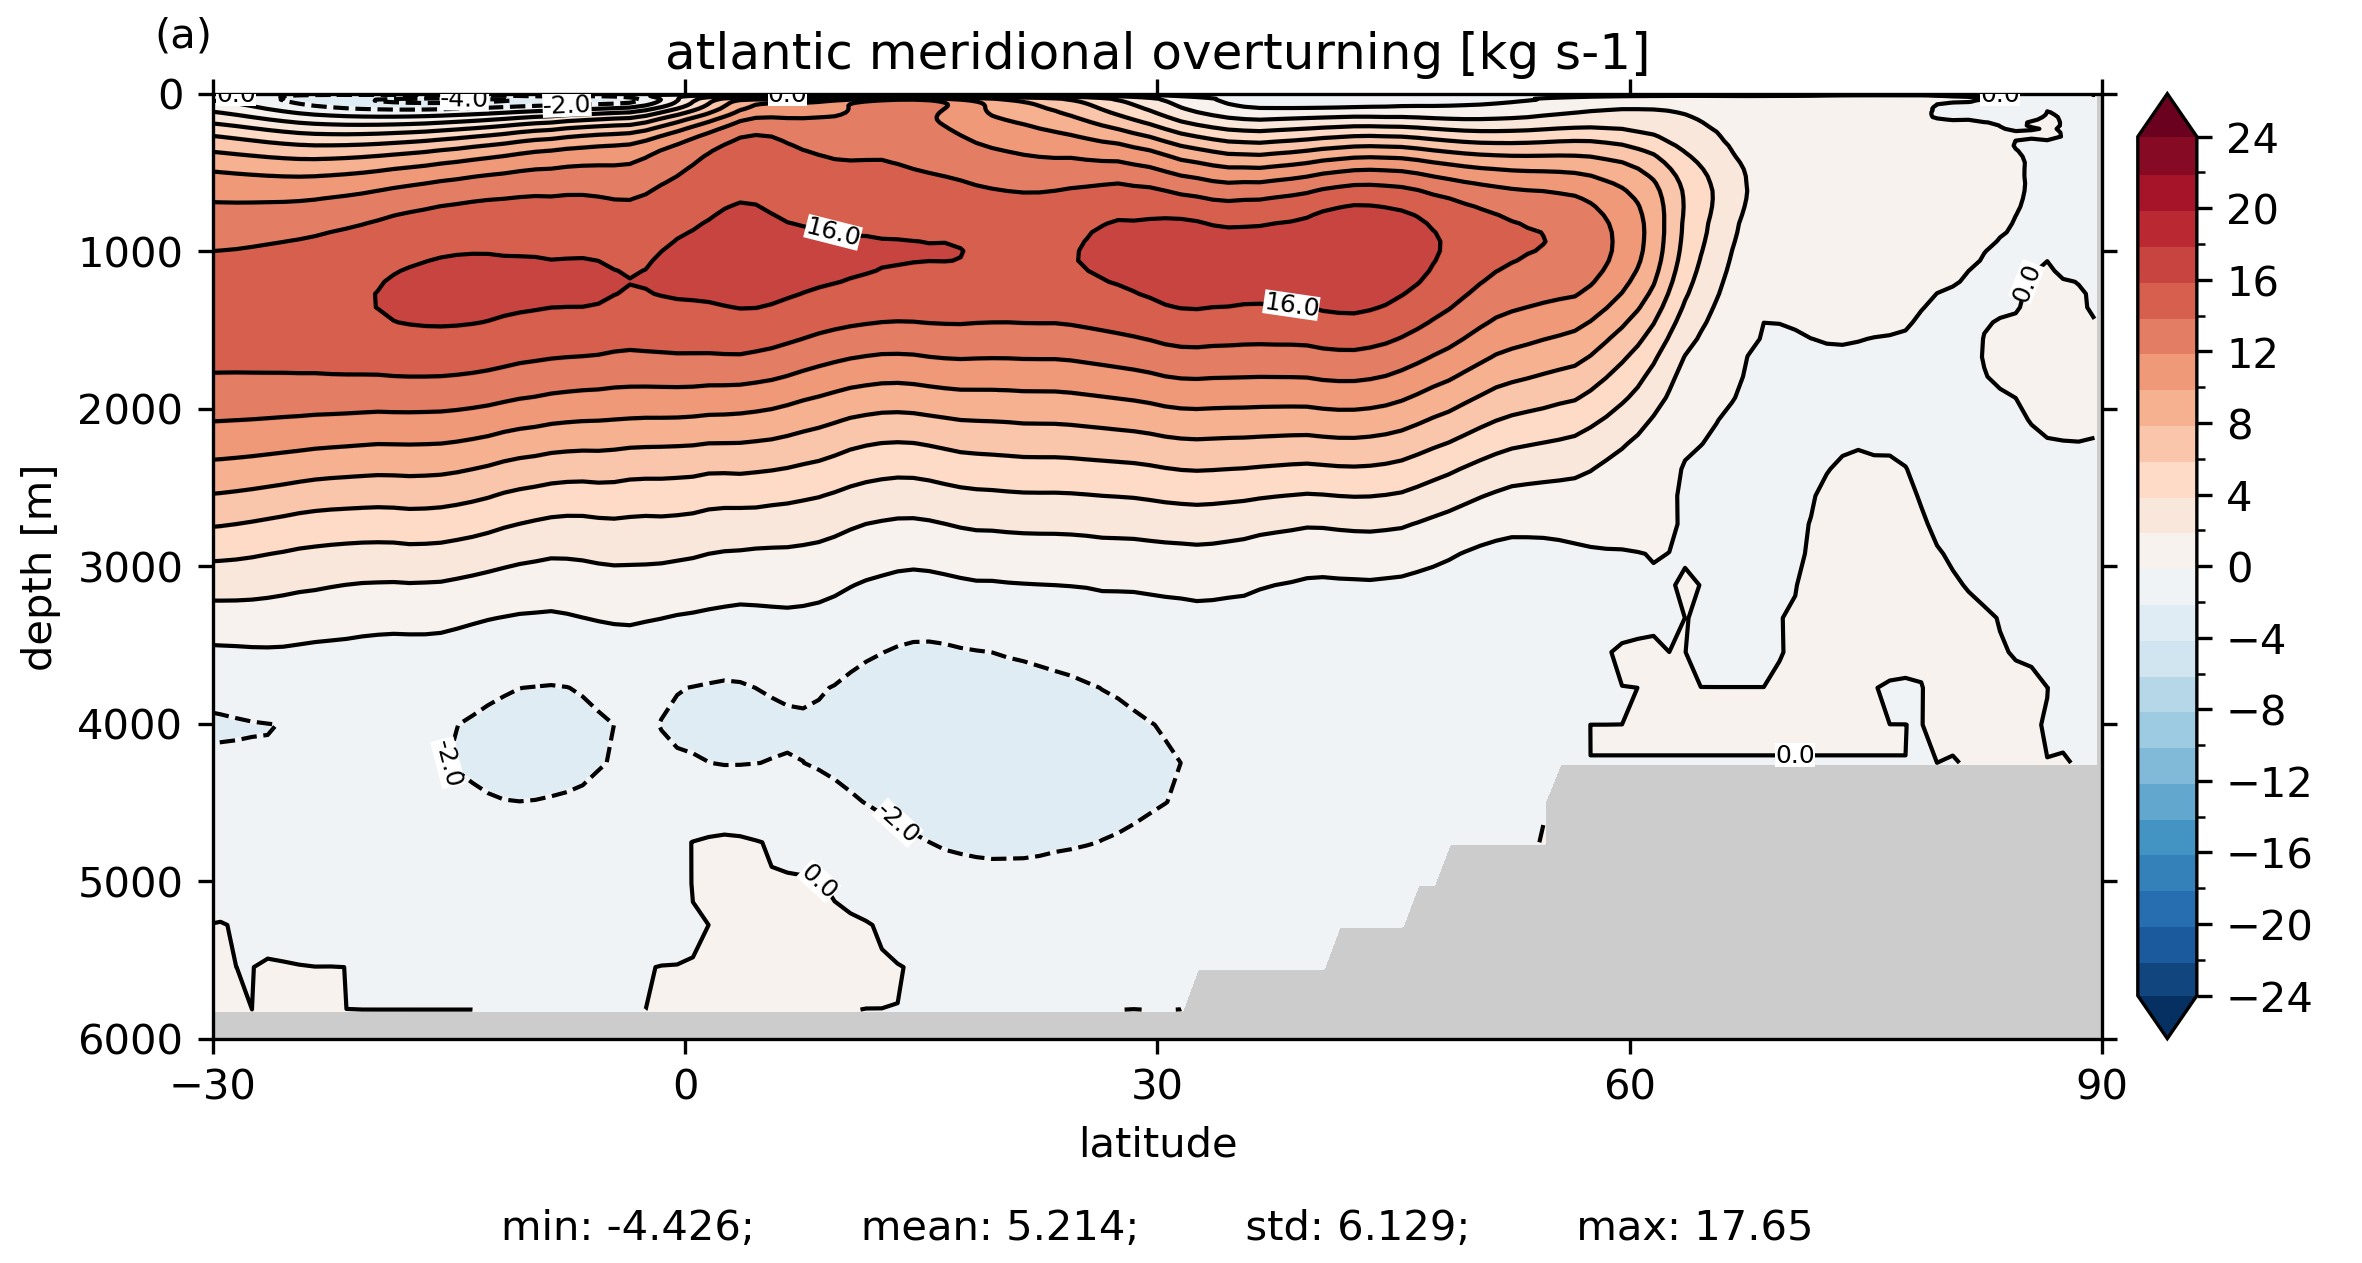
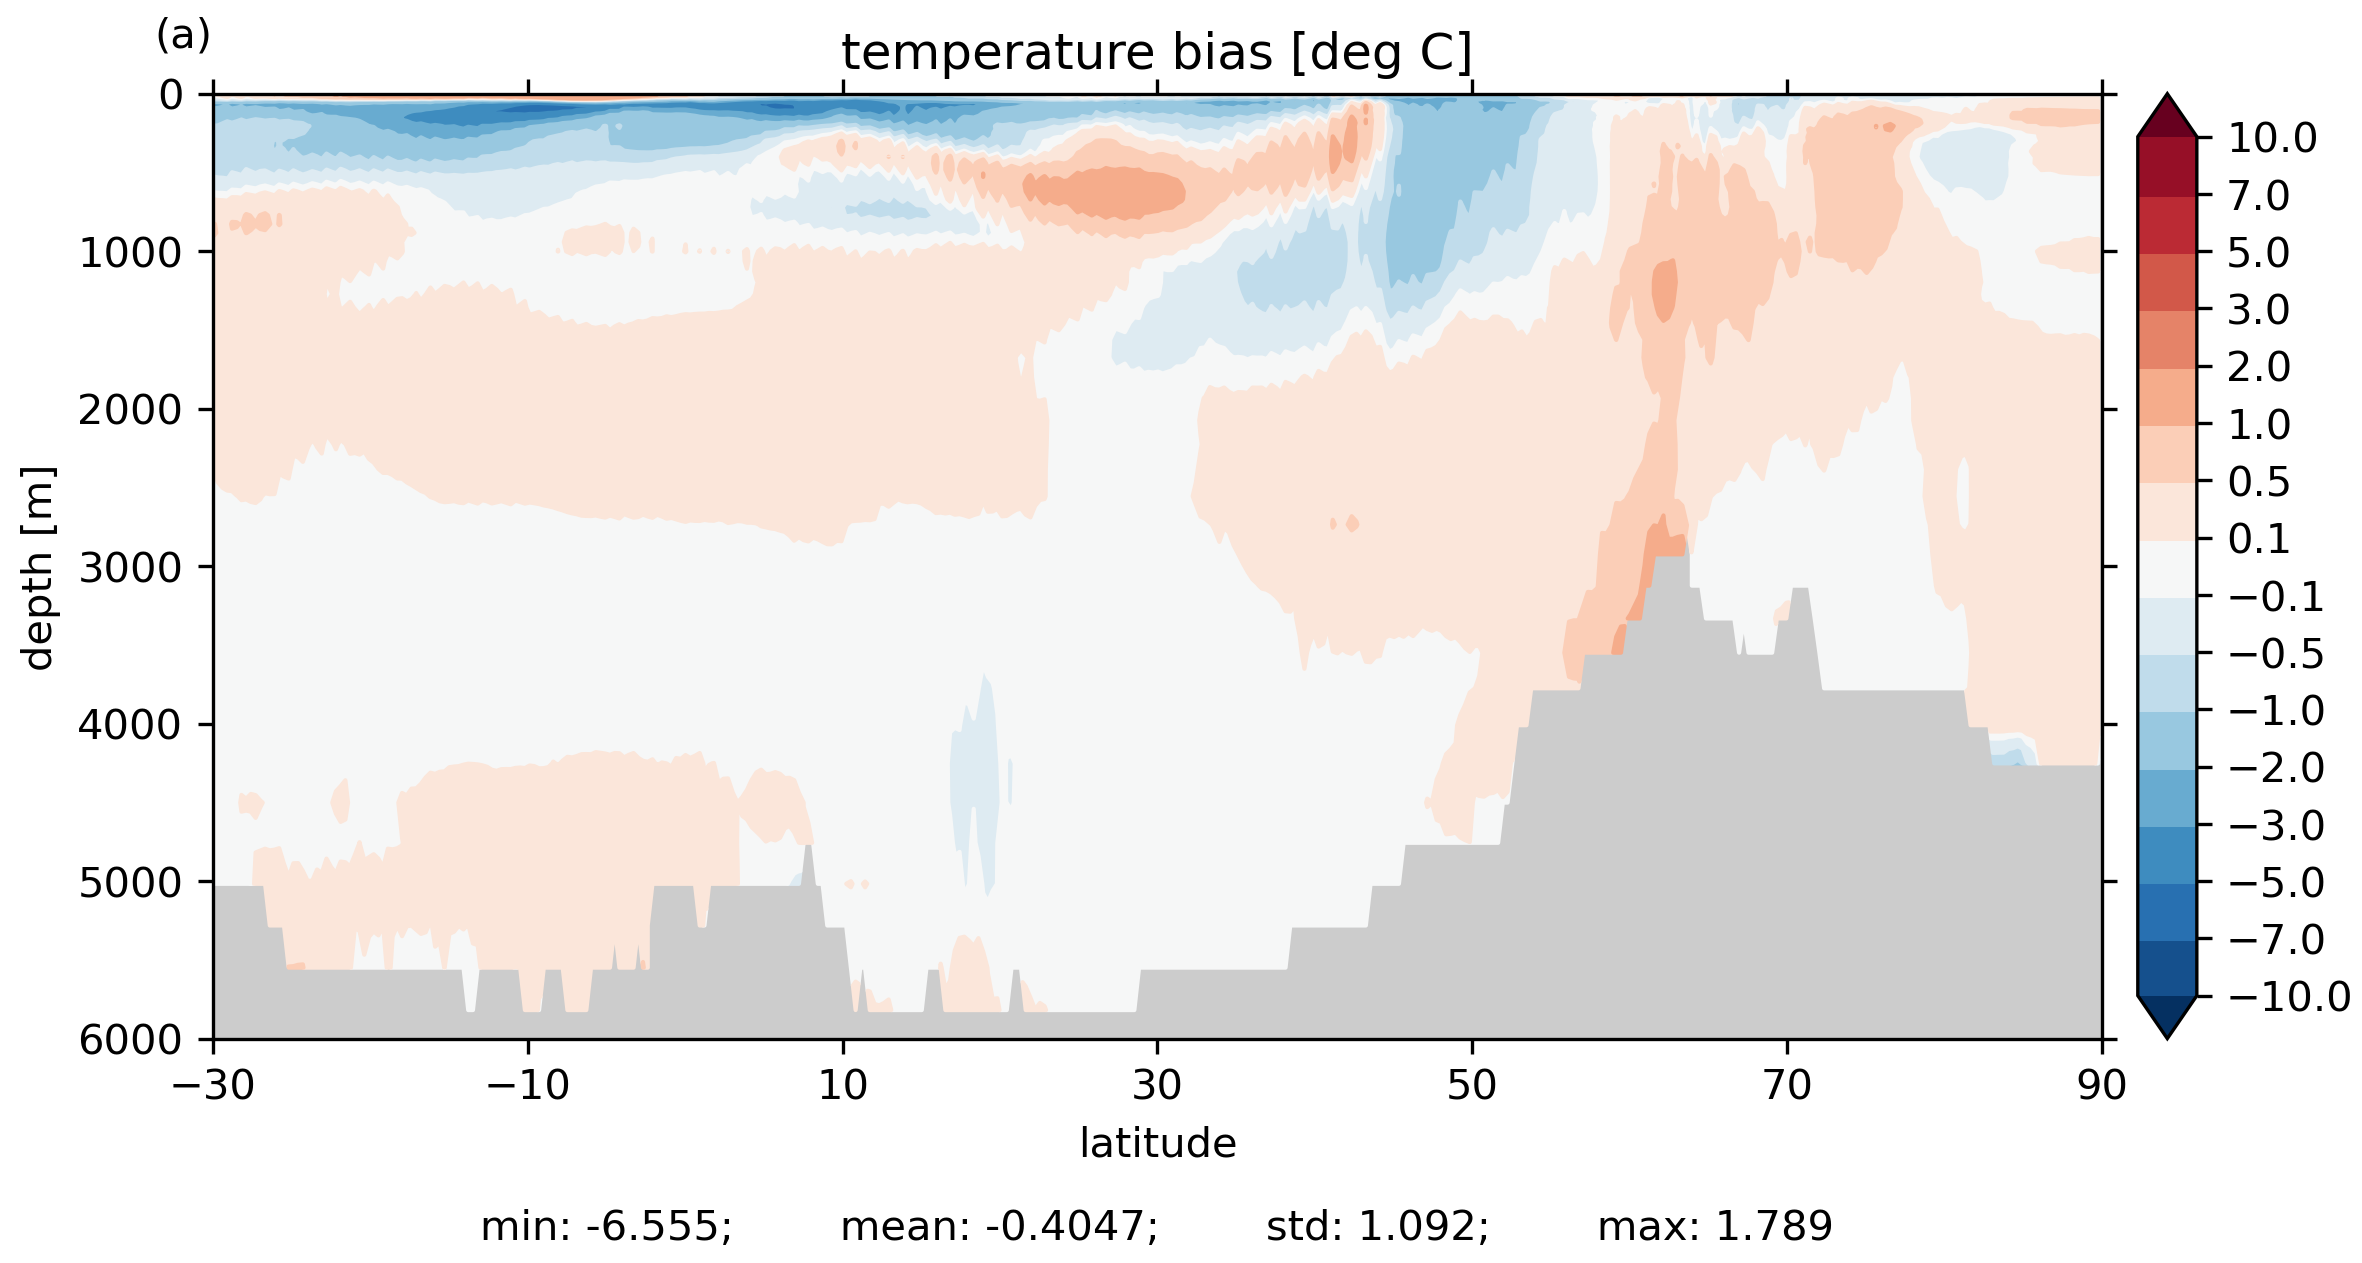
Temperature Atlantic zon. ave.
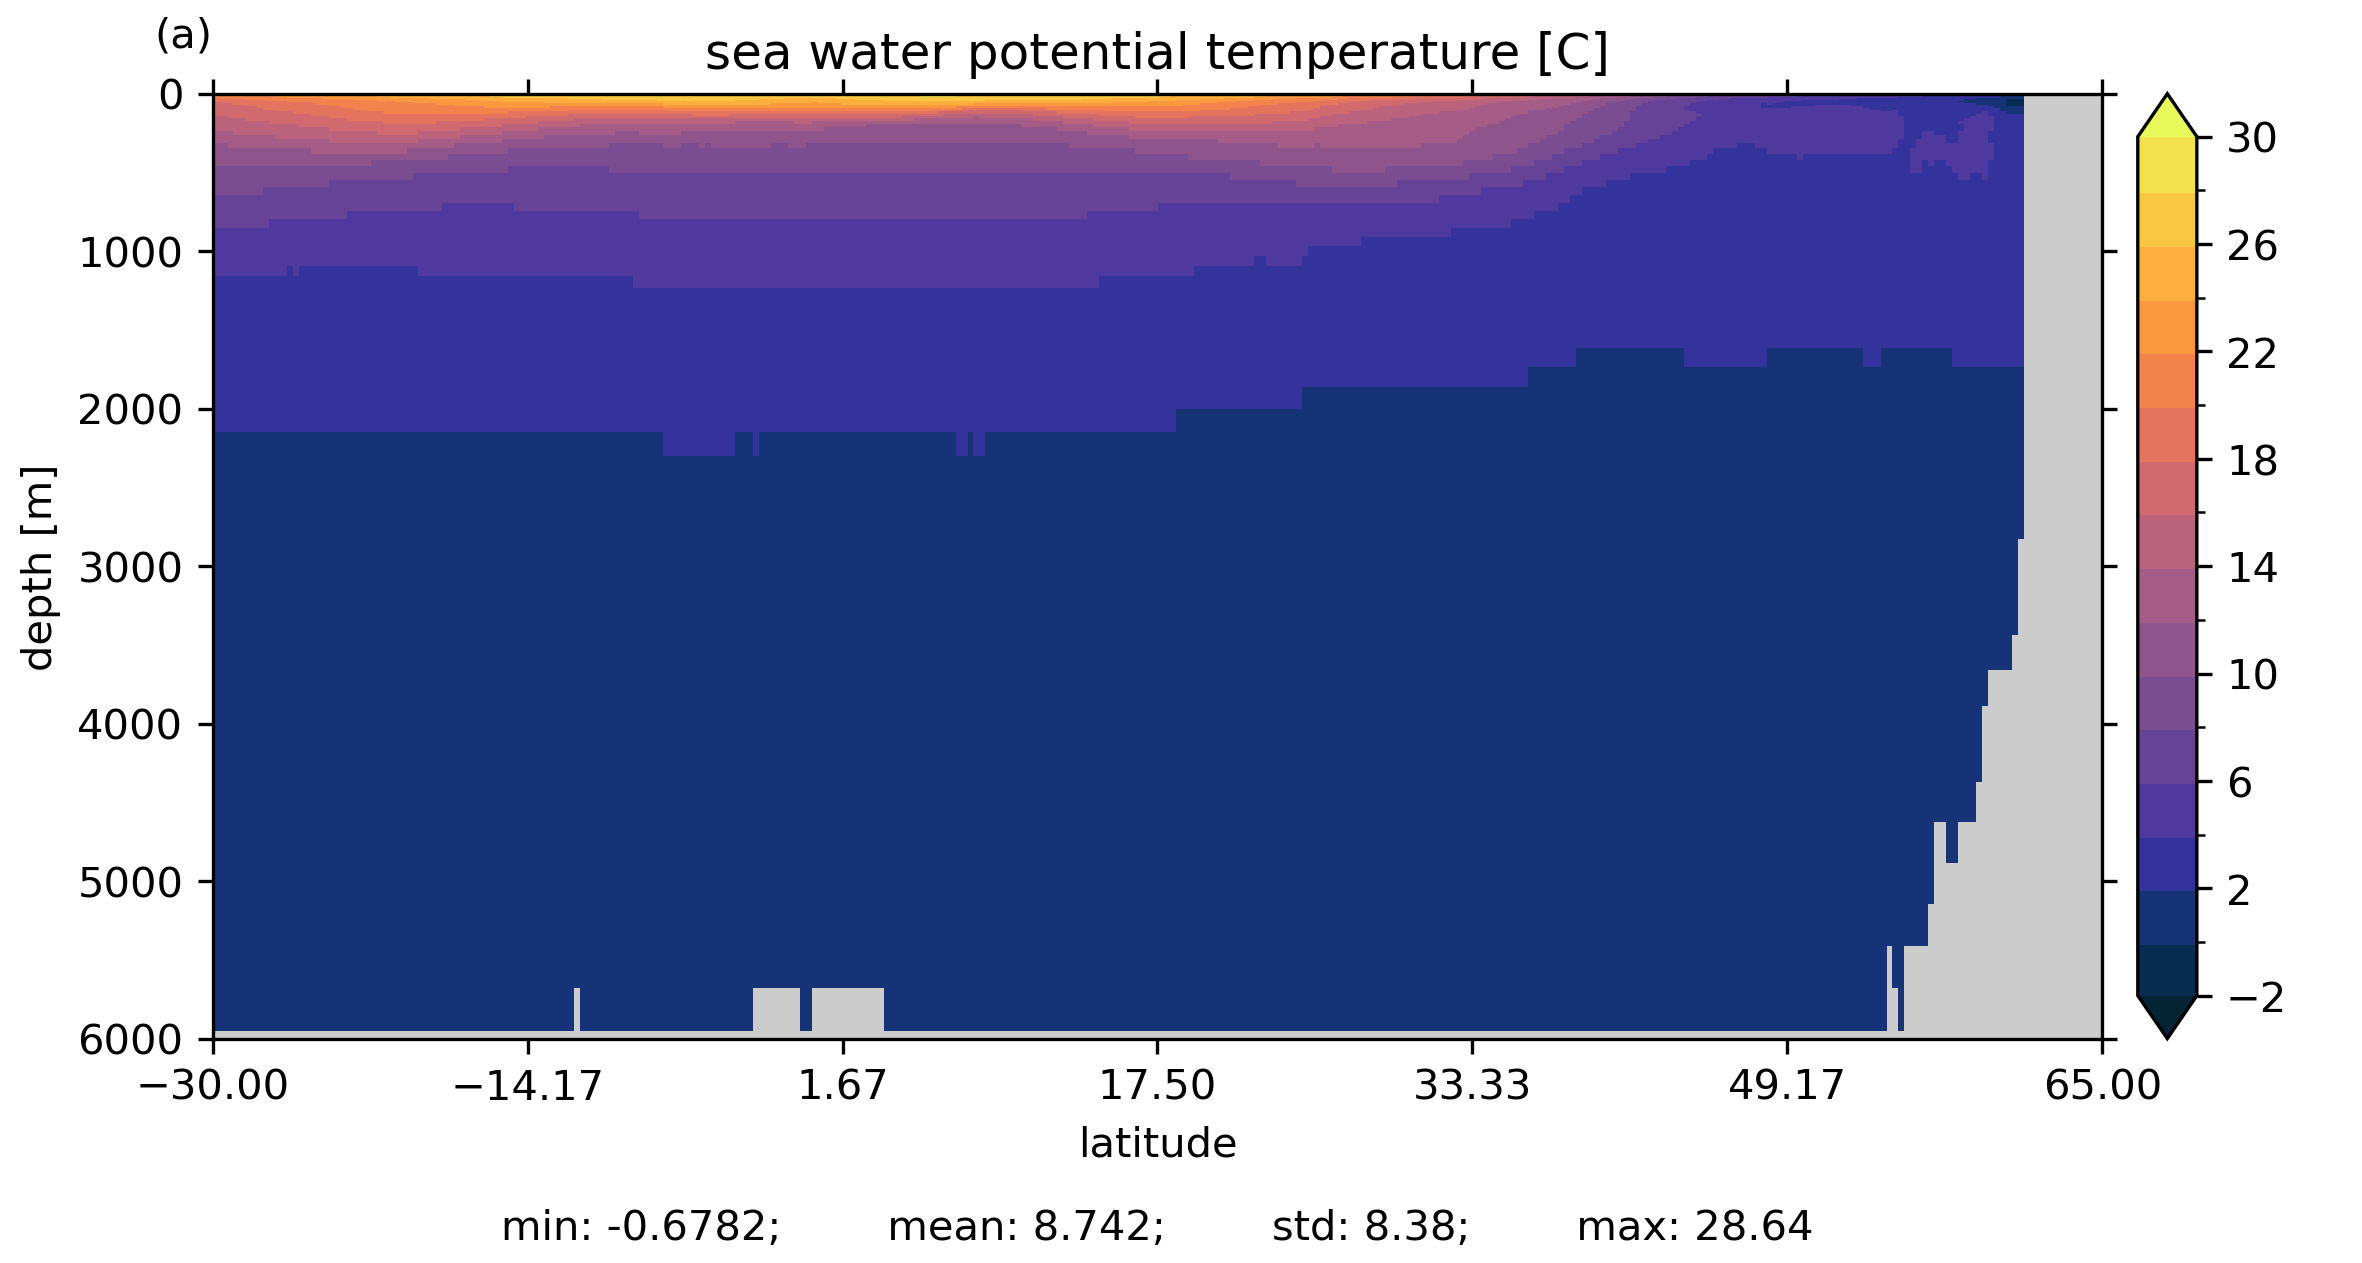
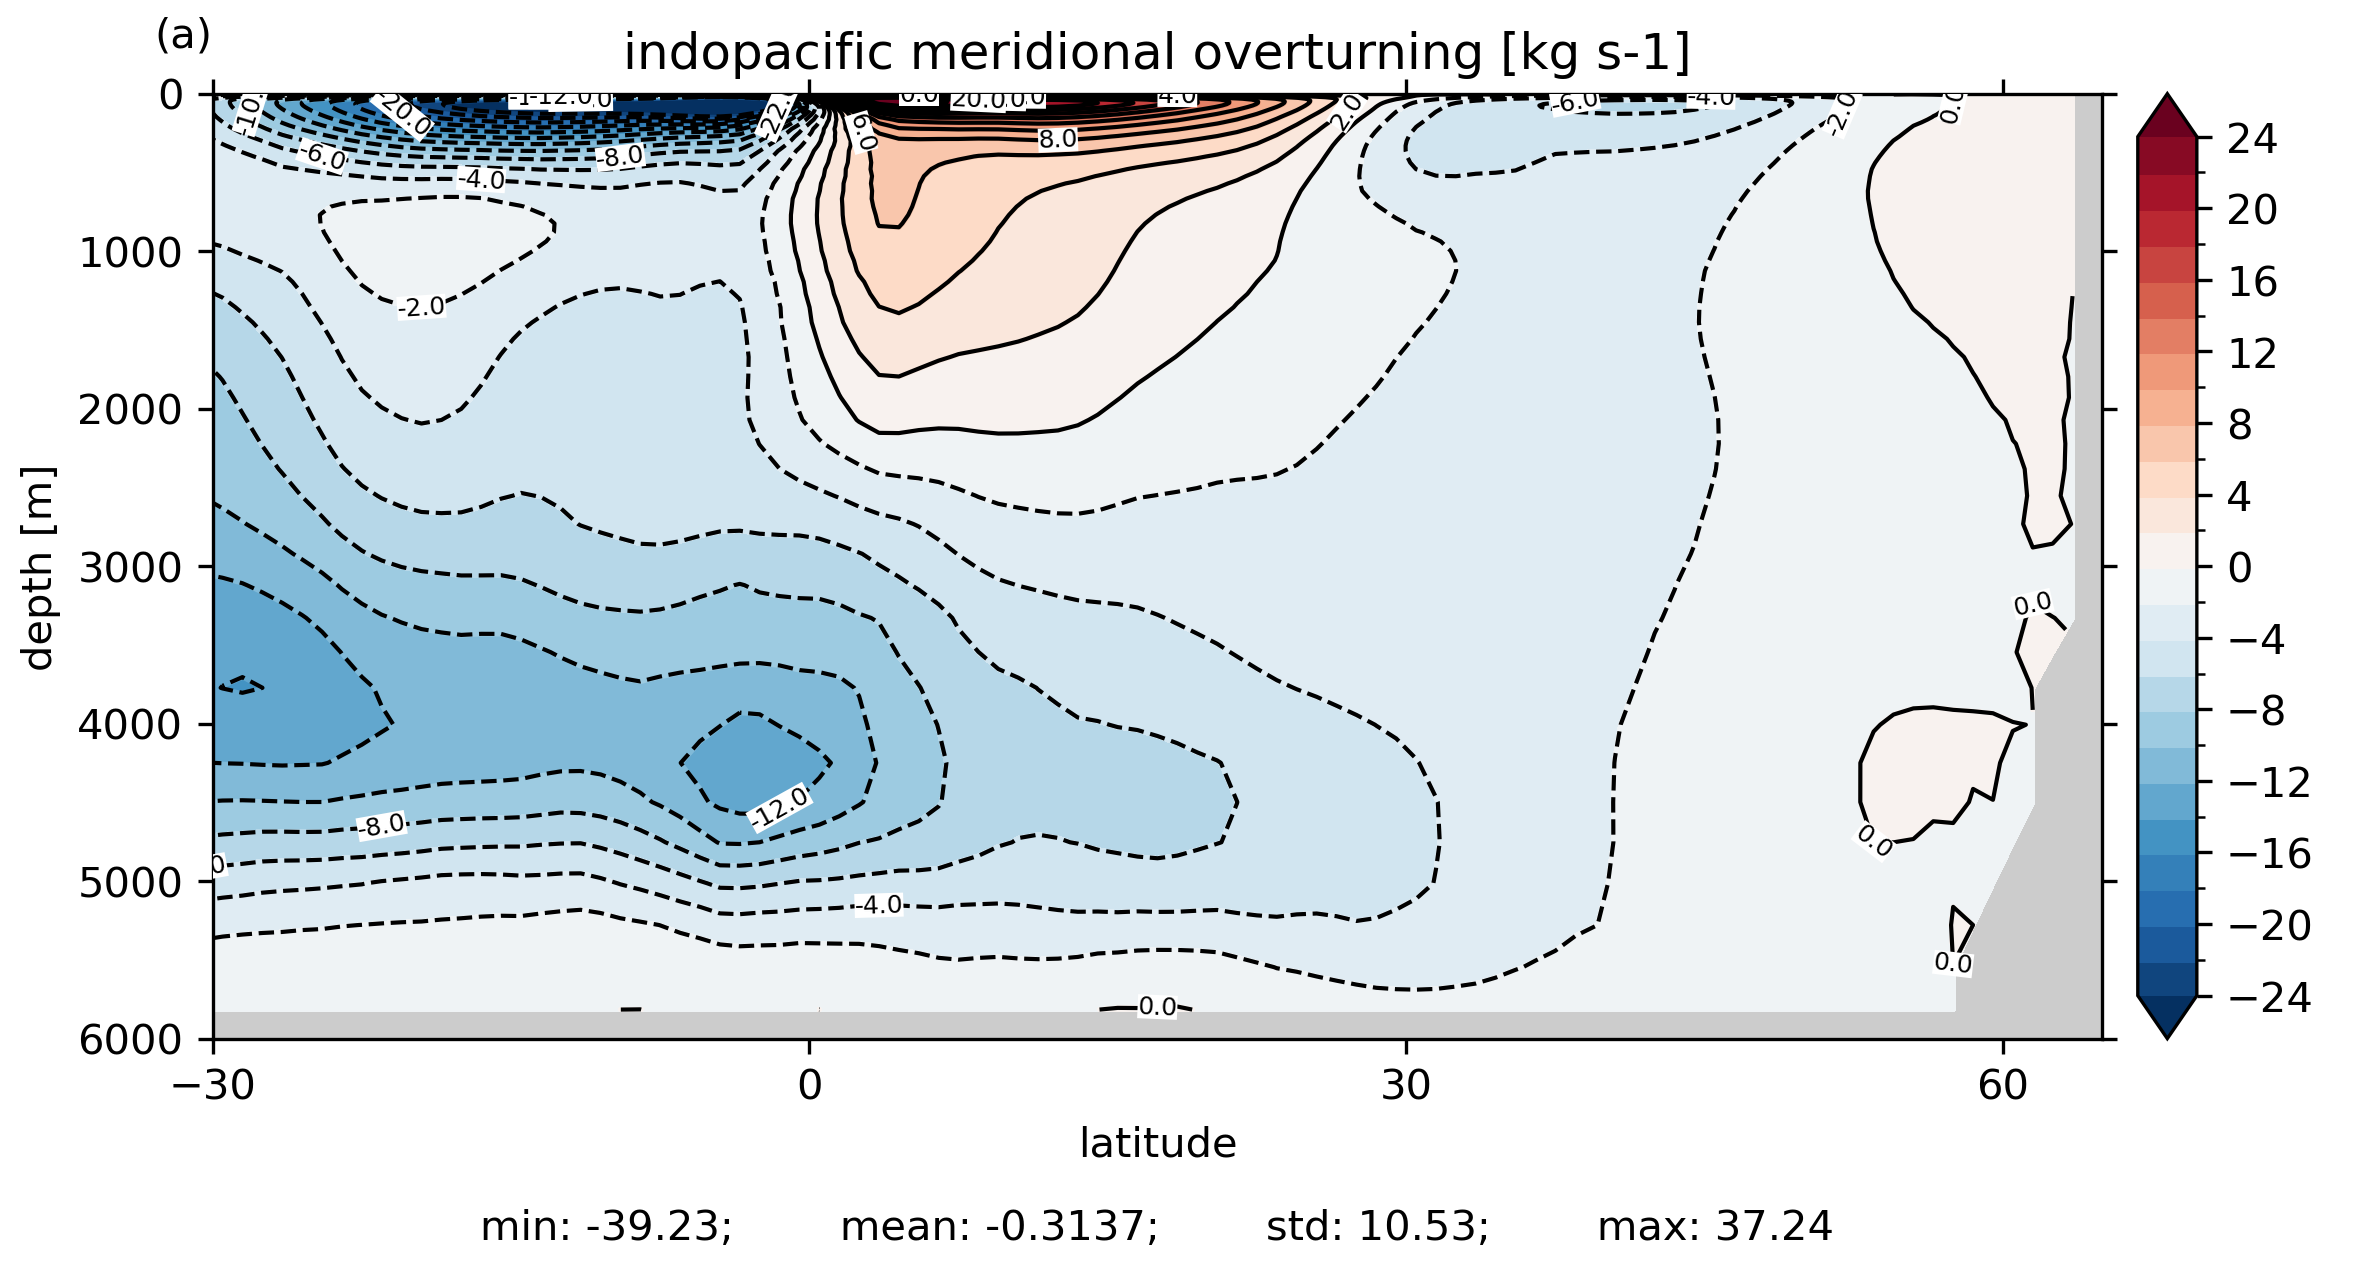
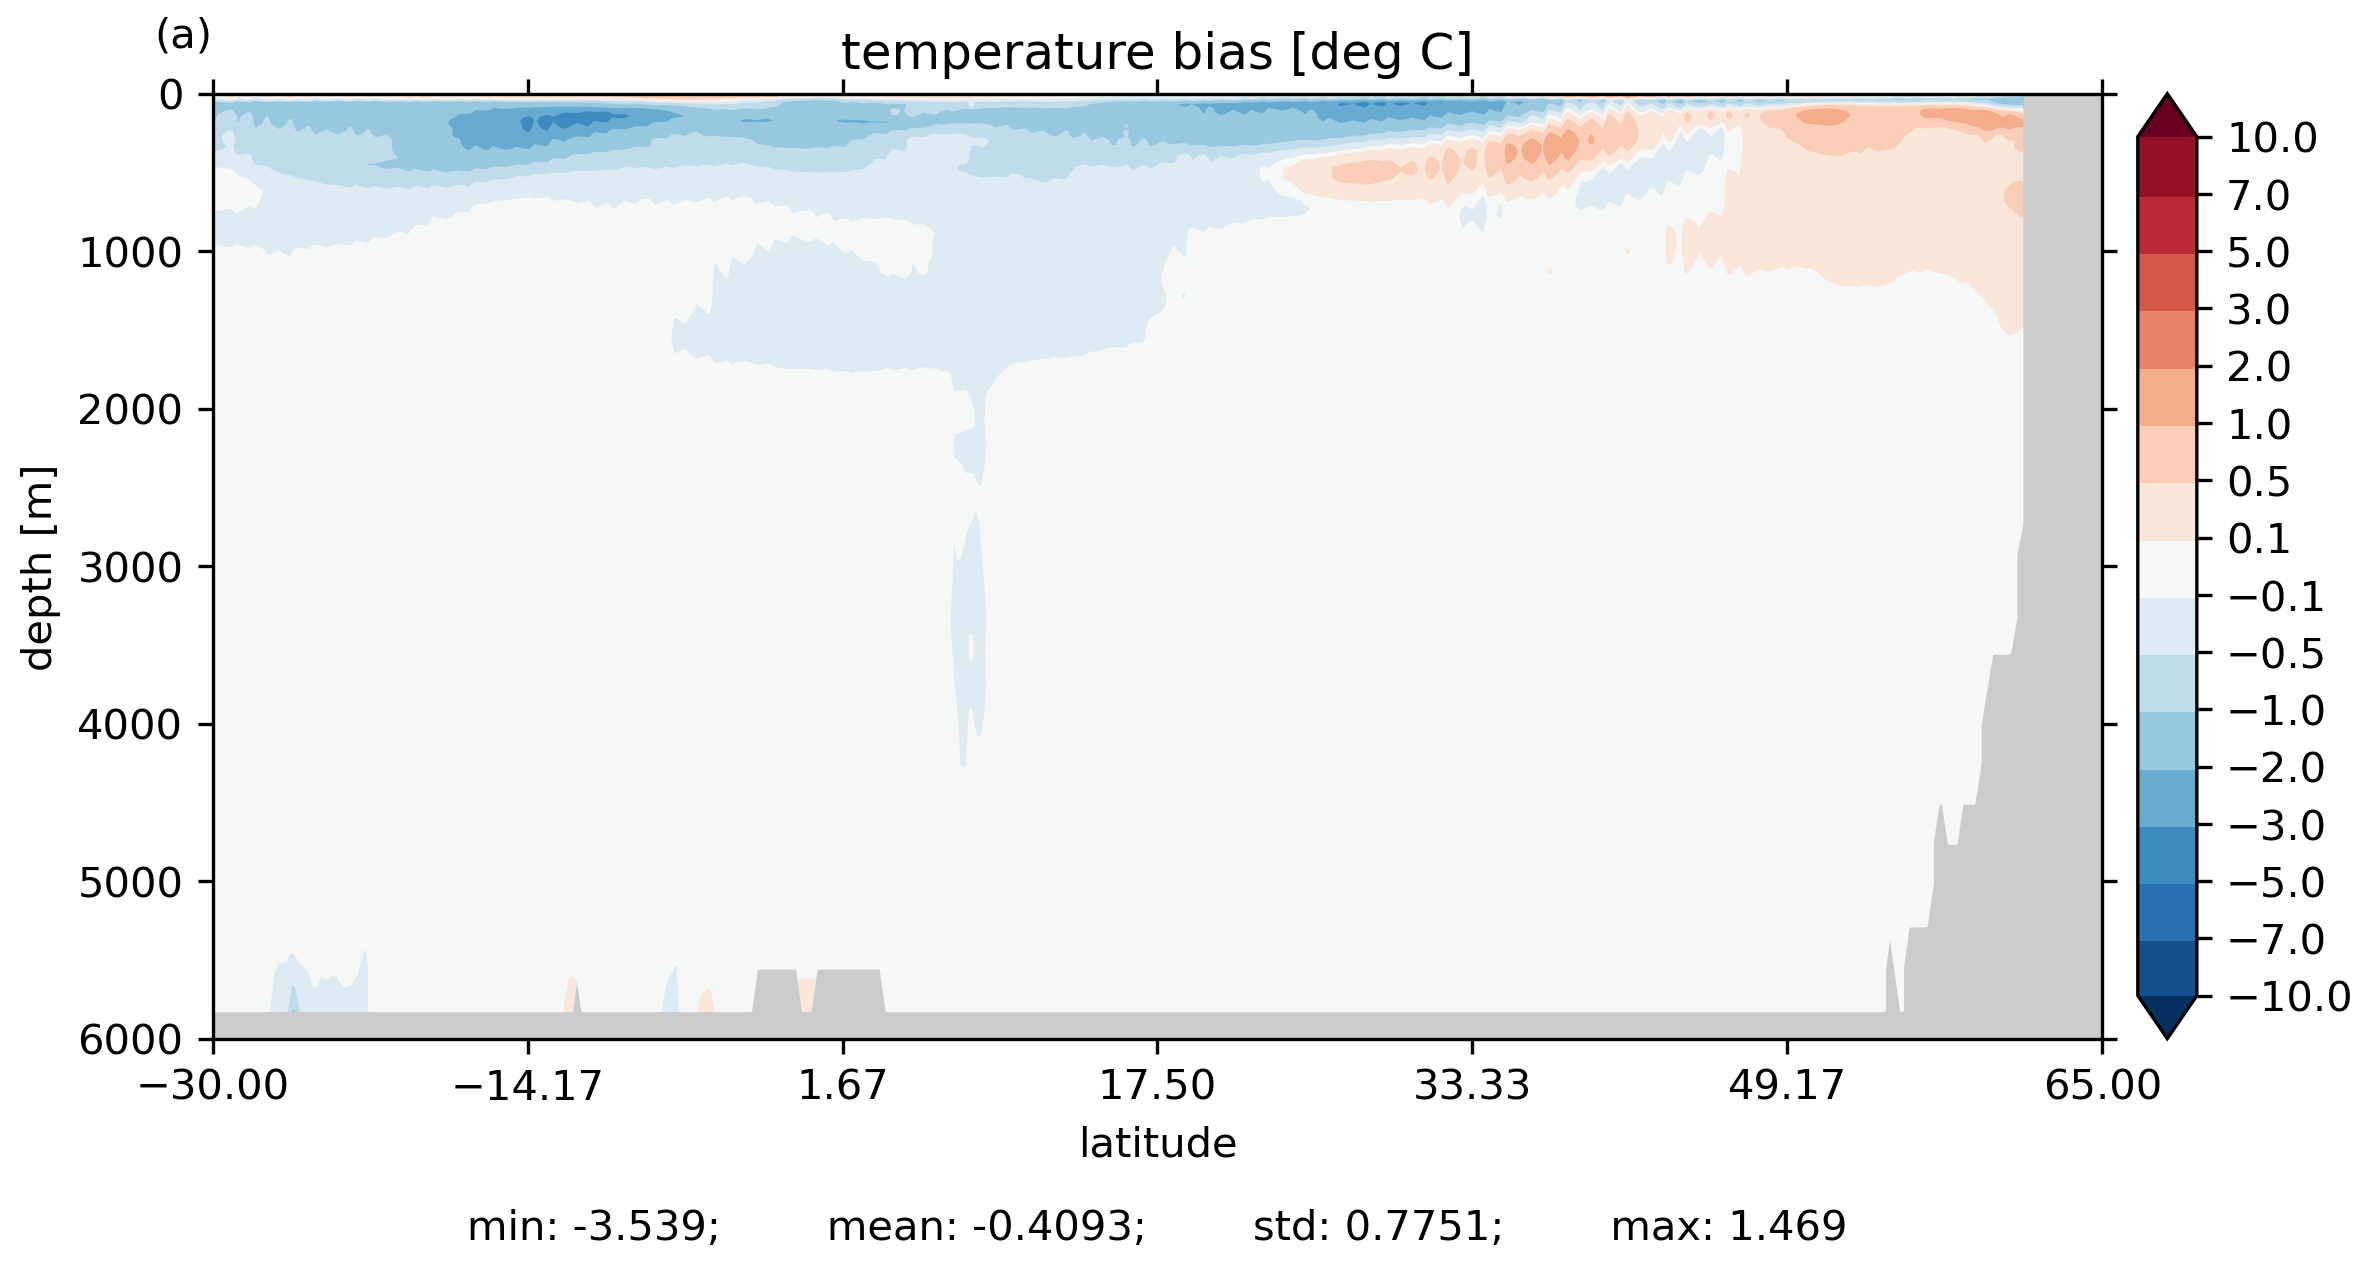
Temperature Indo-Pac. zon. ave.
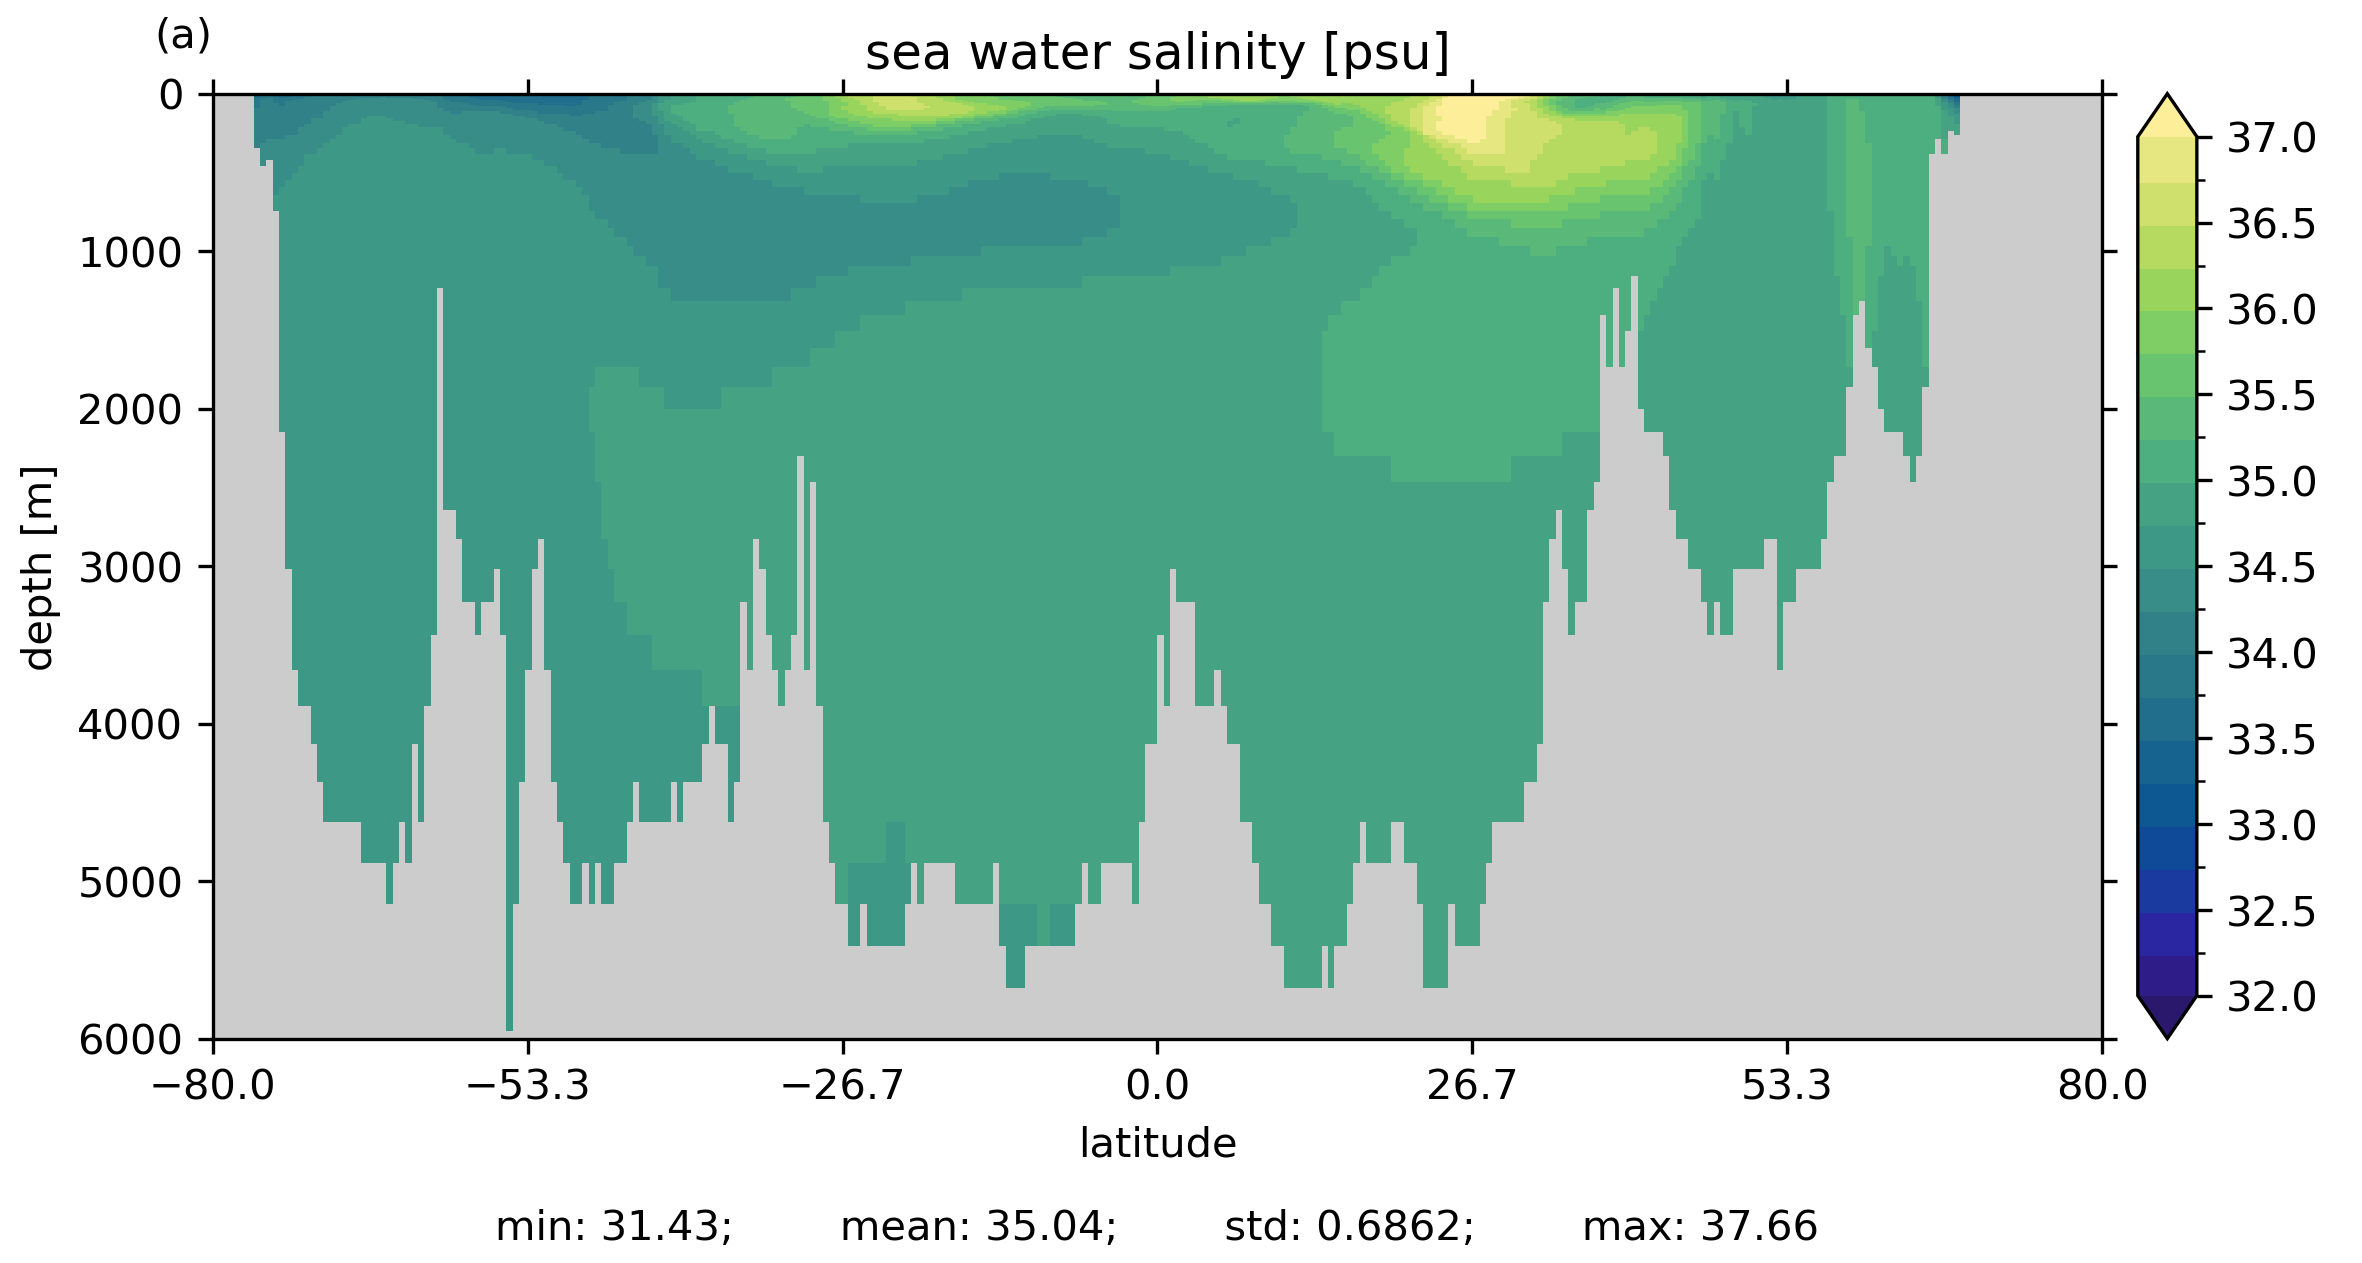
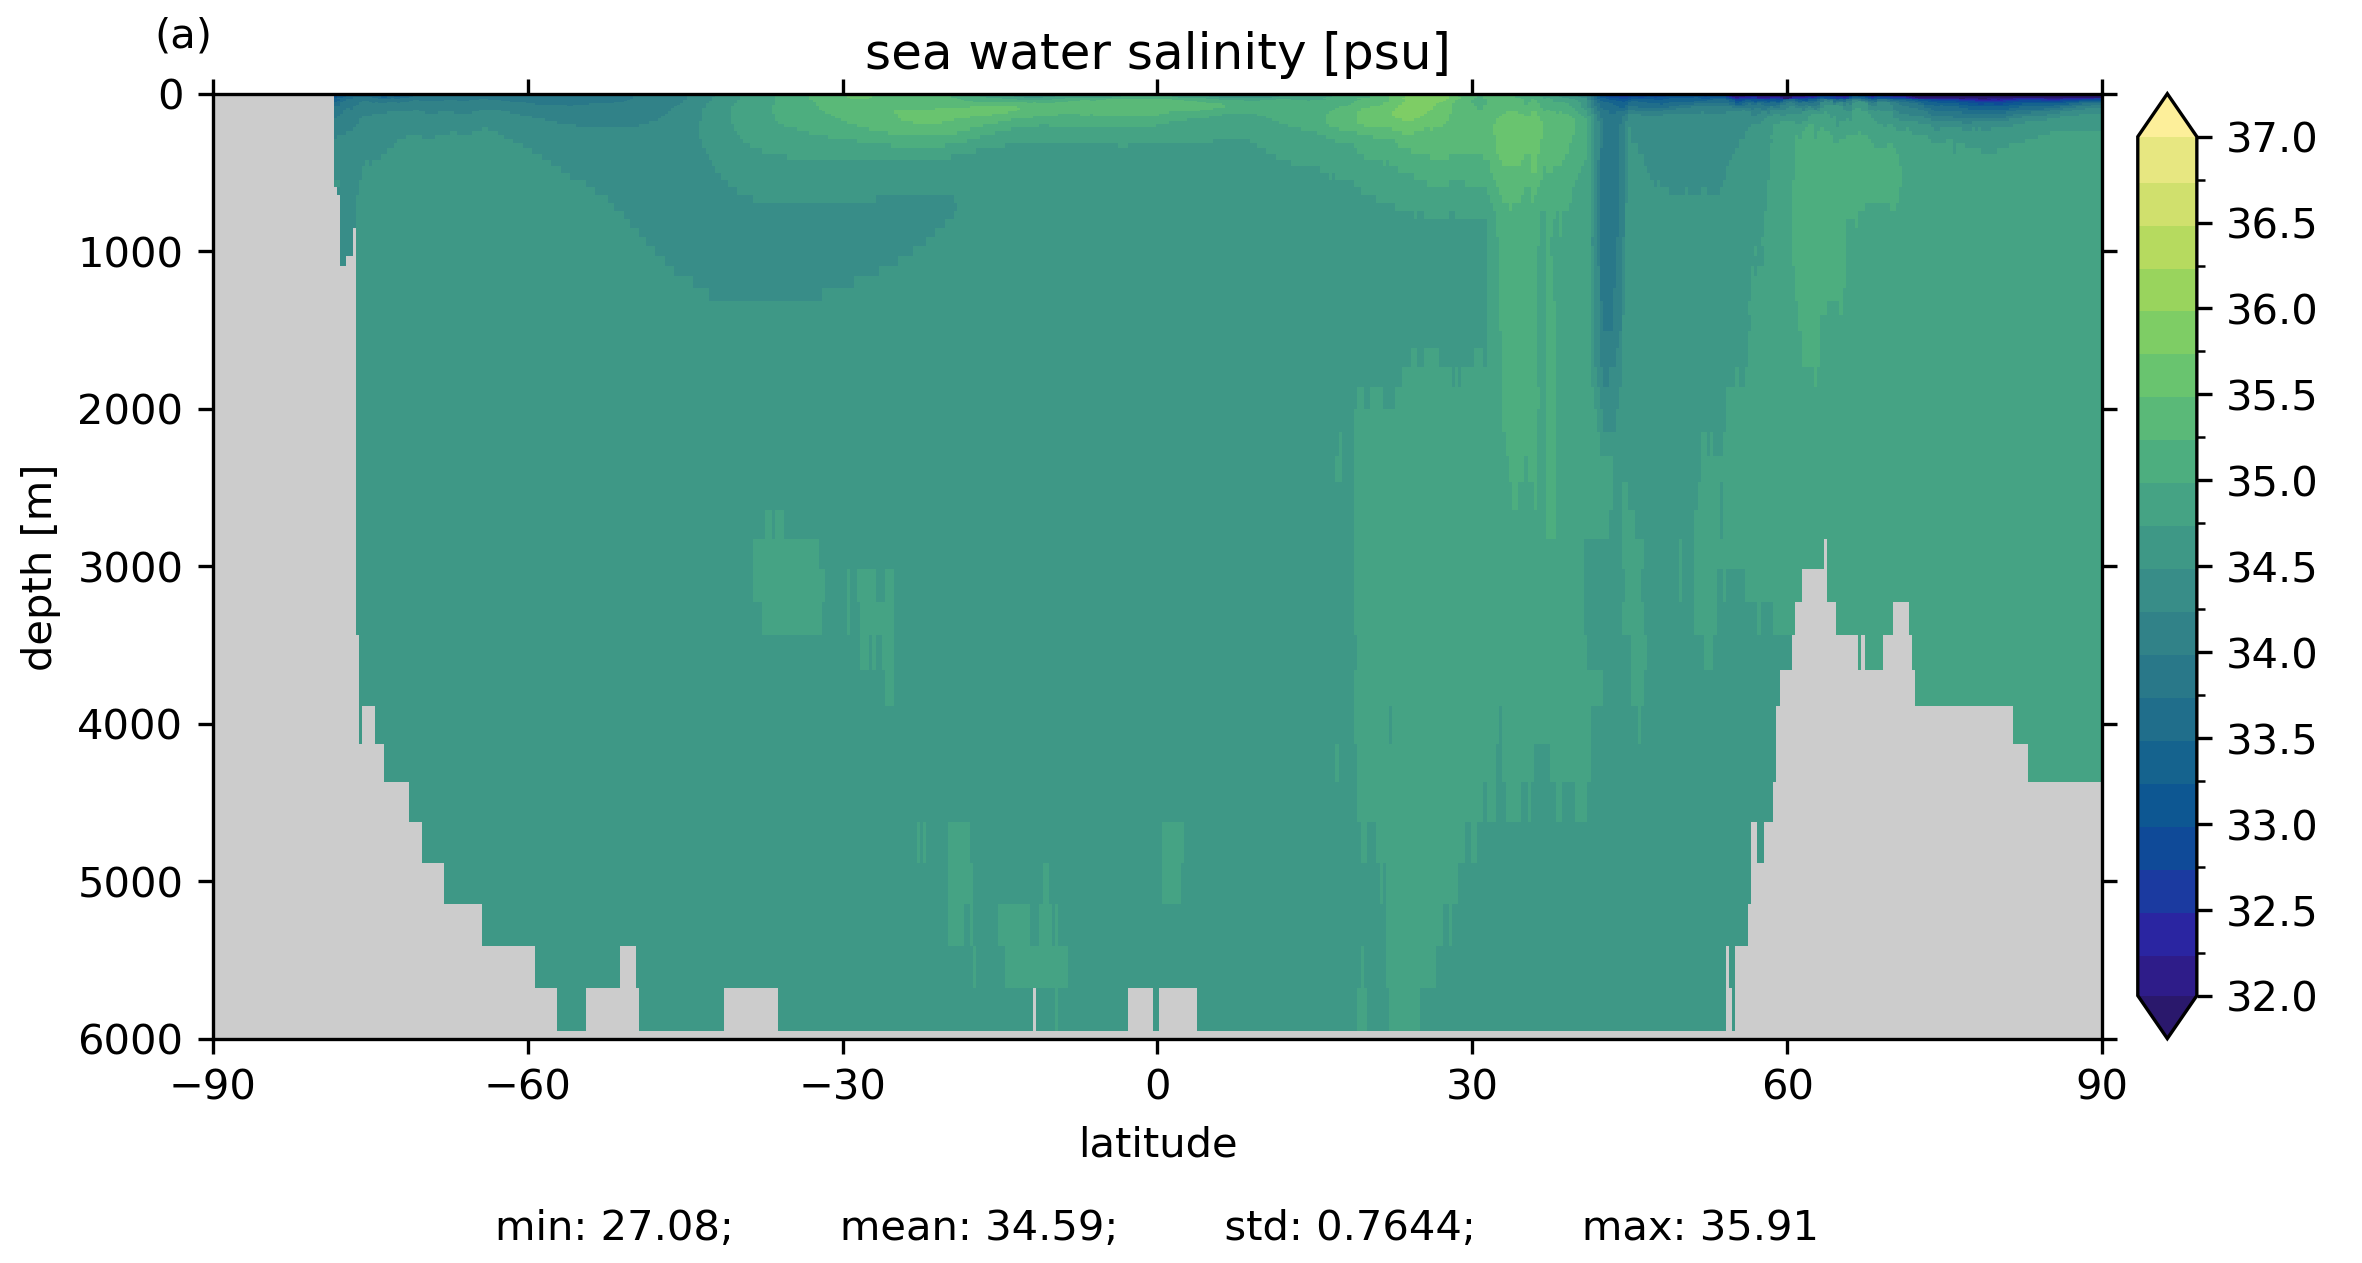
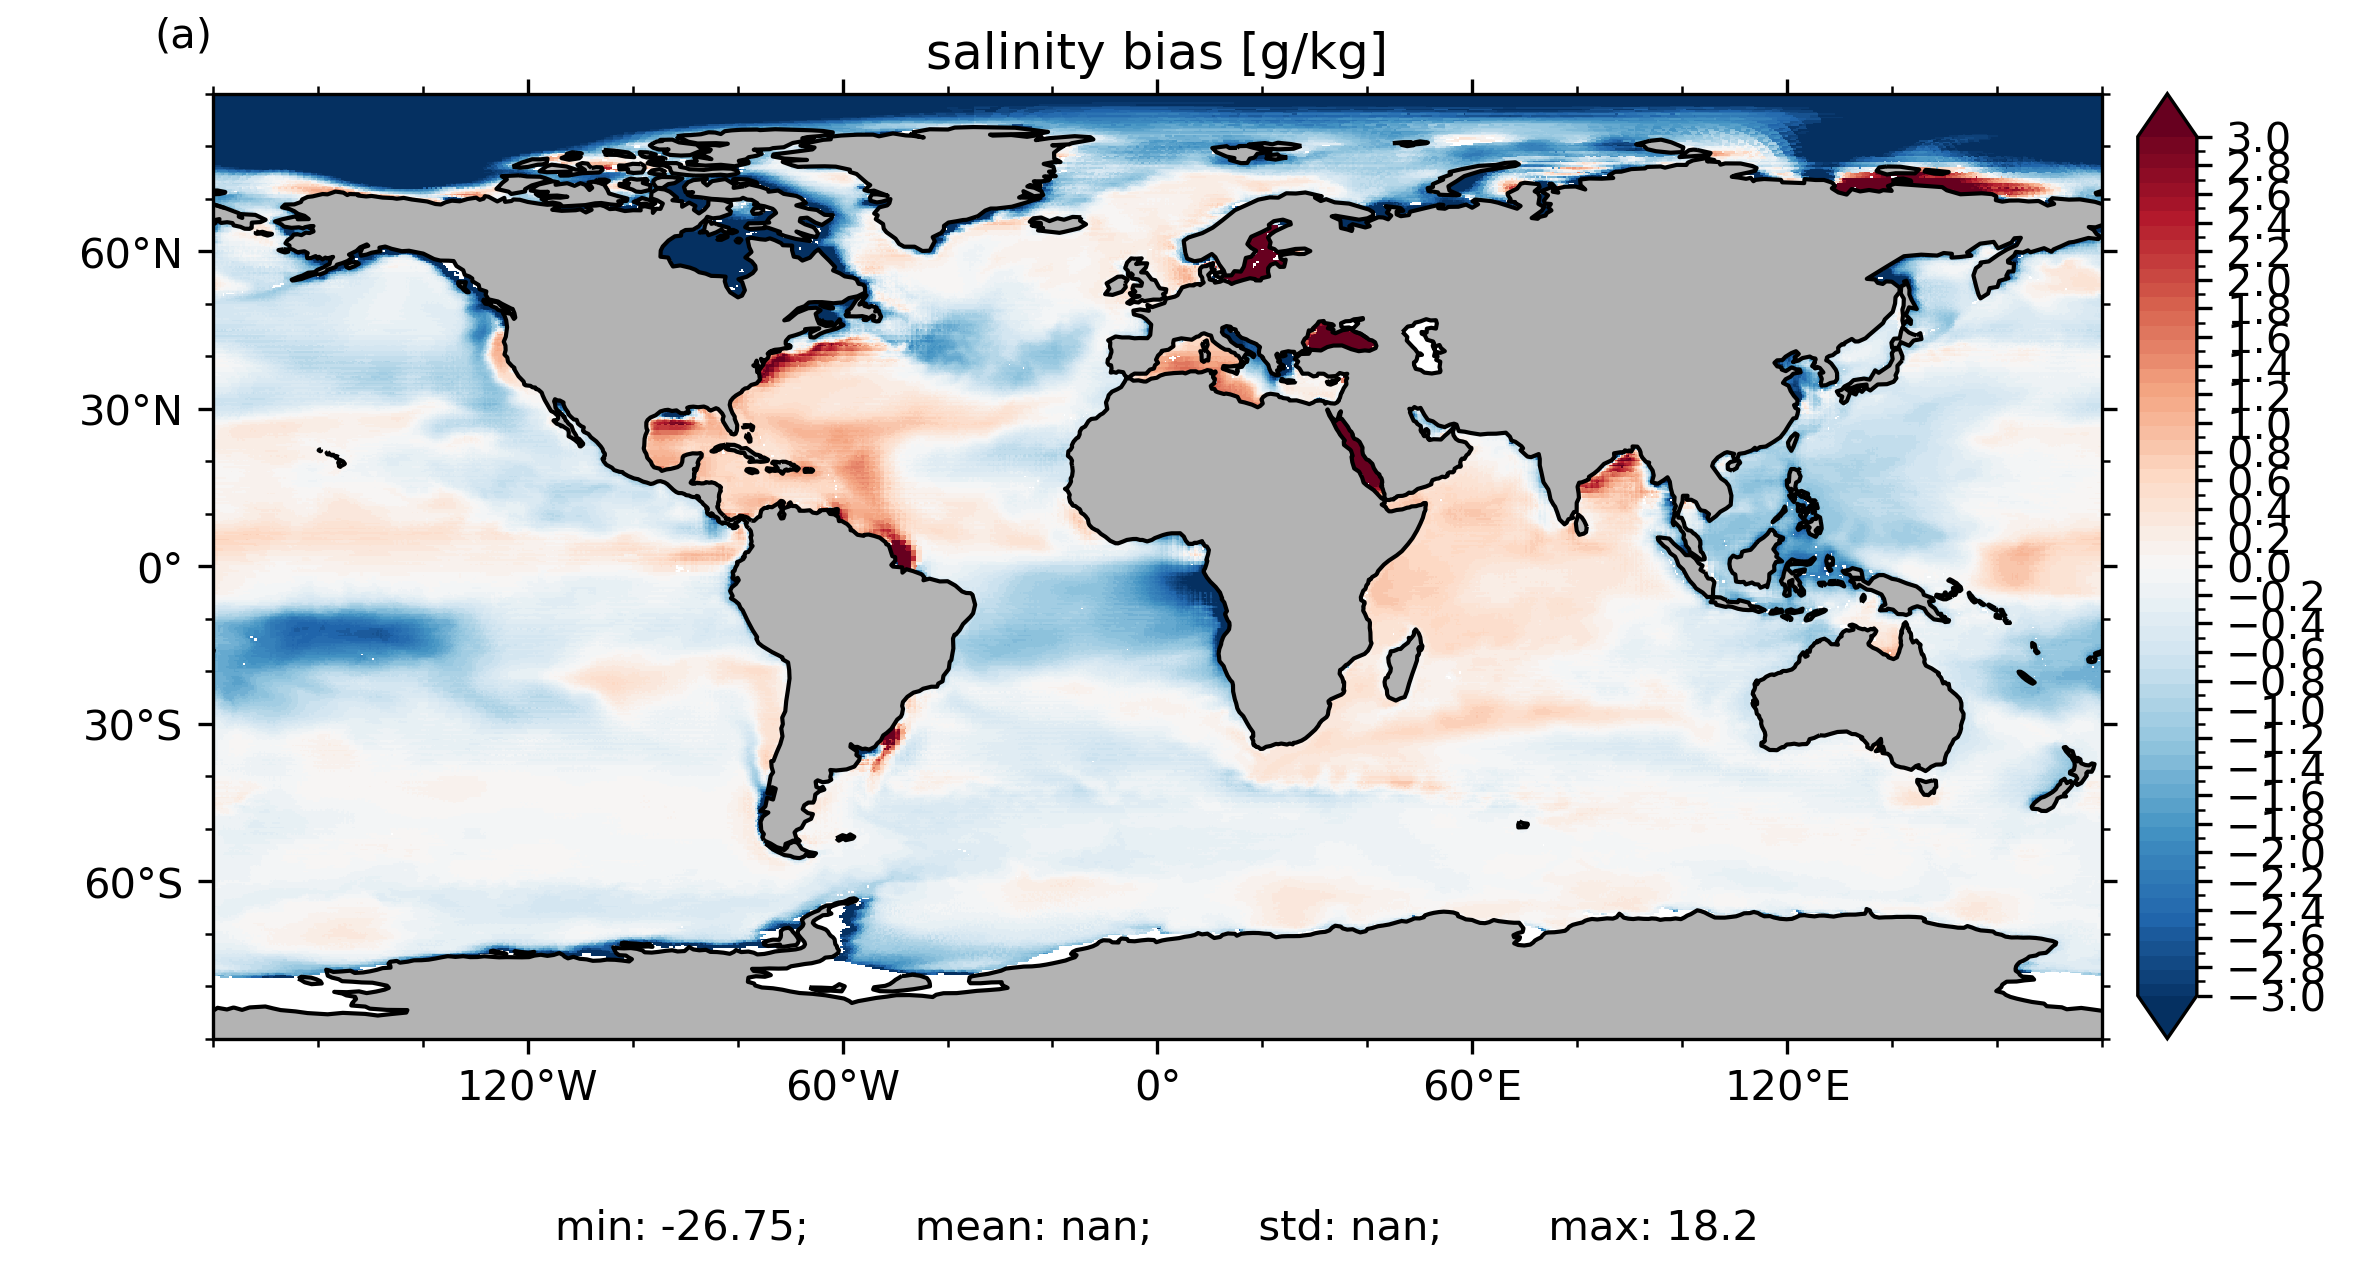
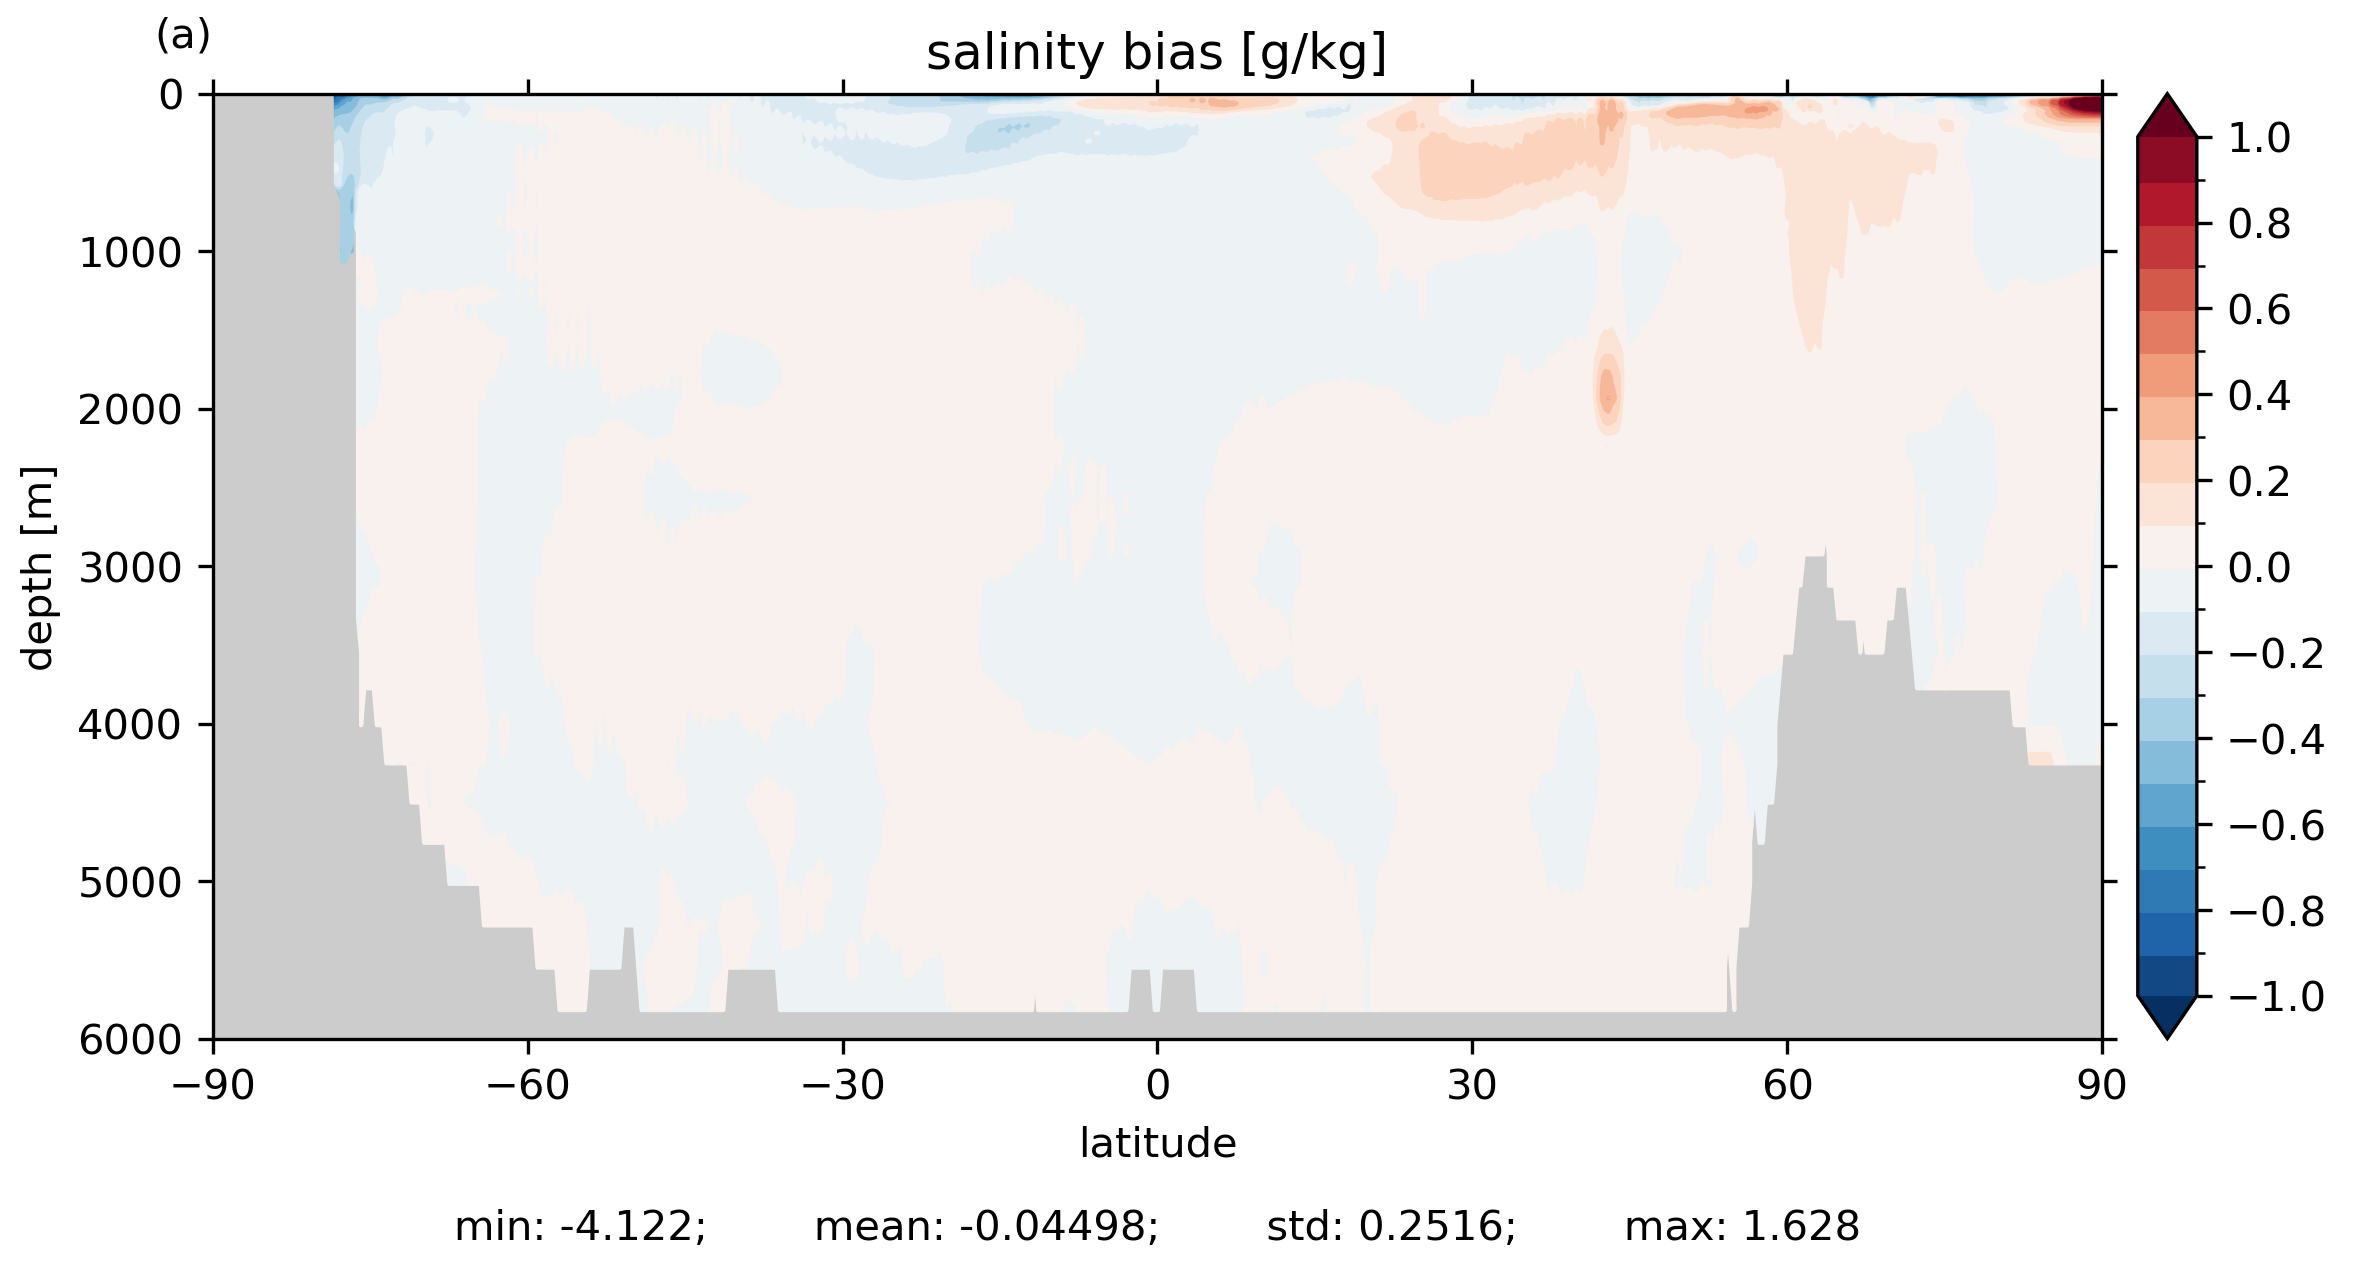
Salinity global zon. ave.
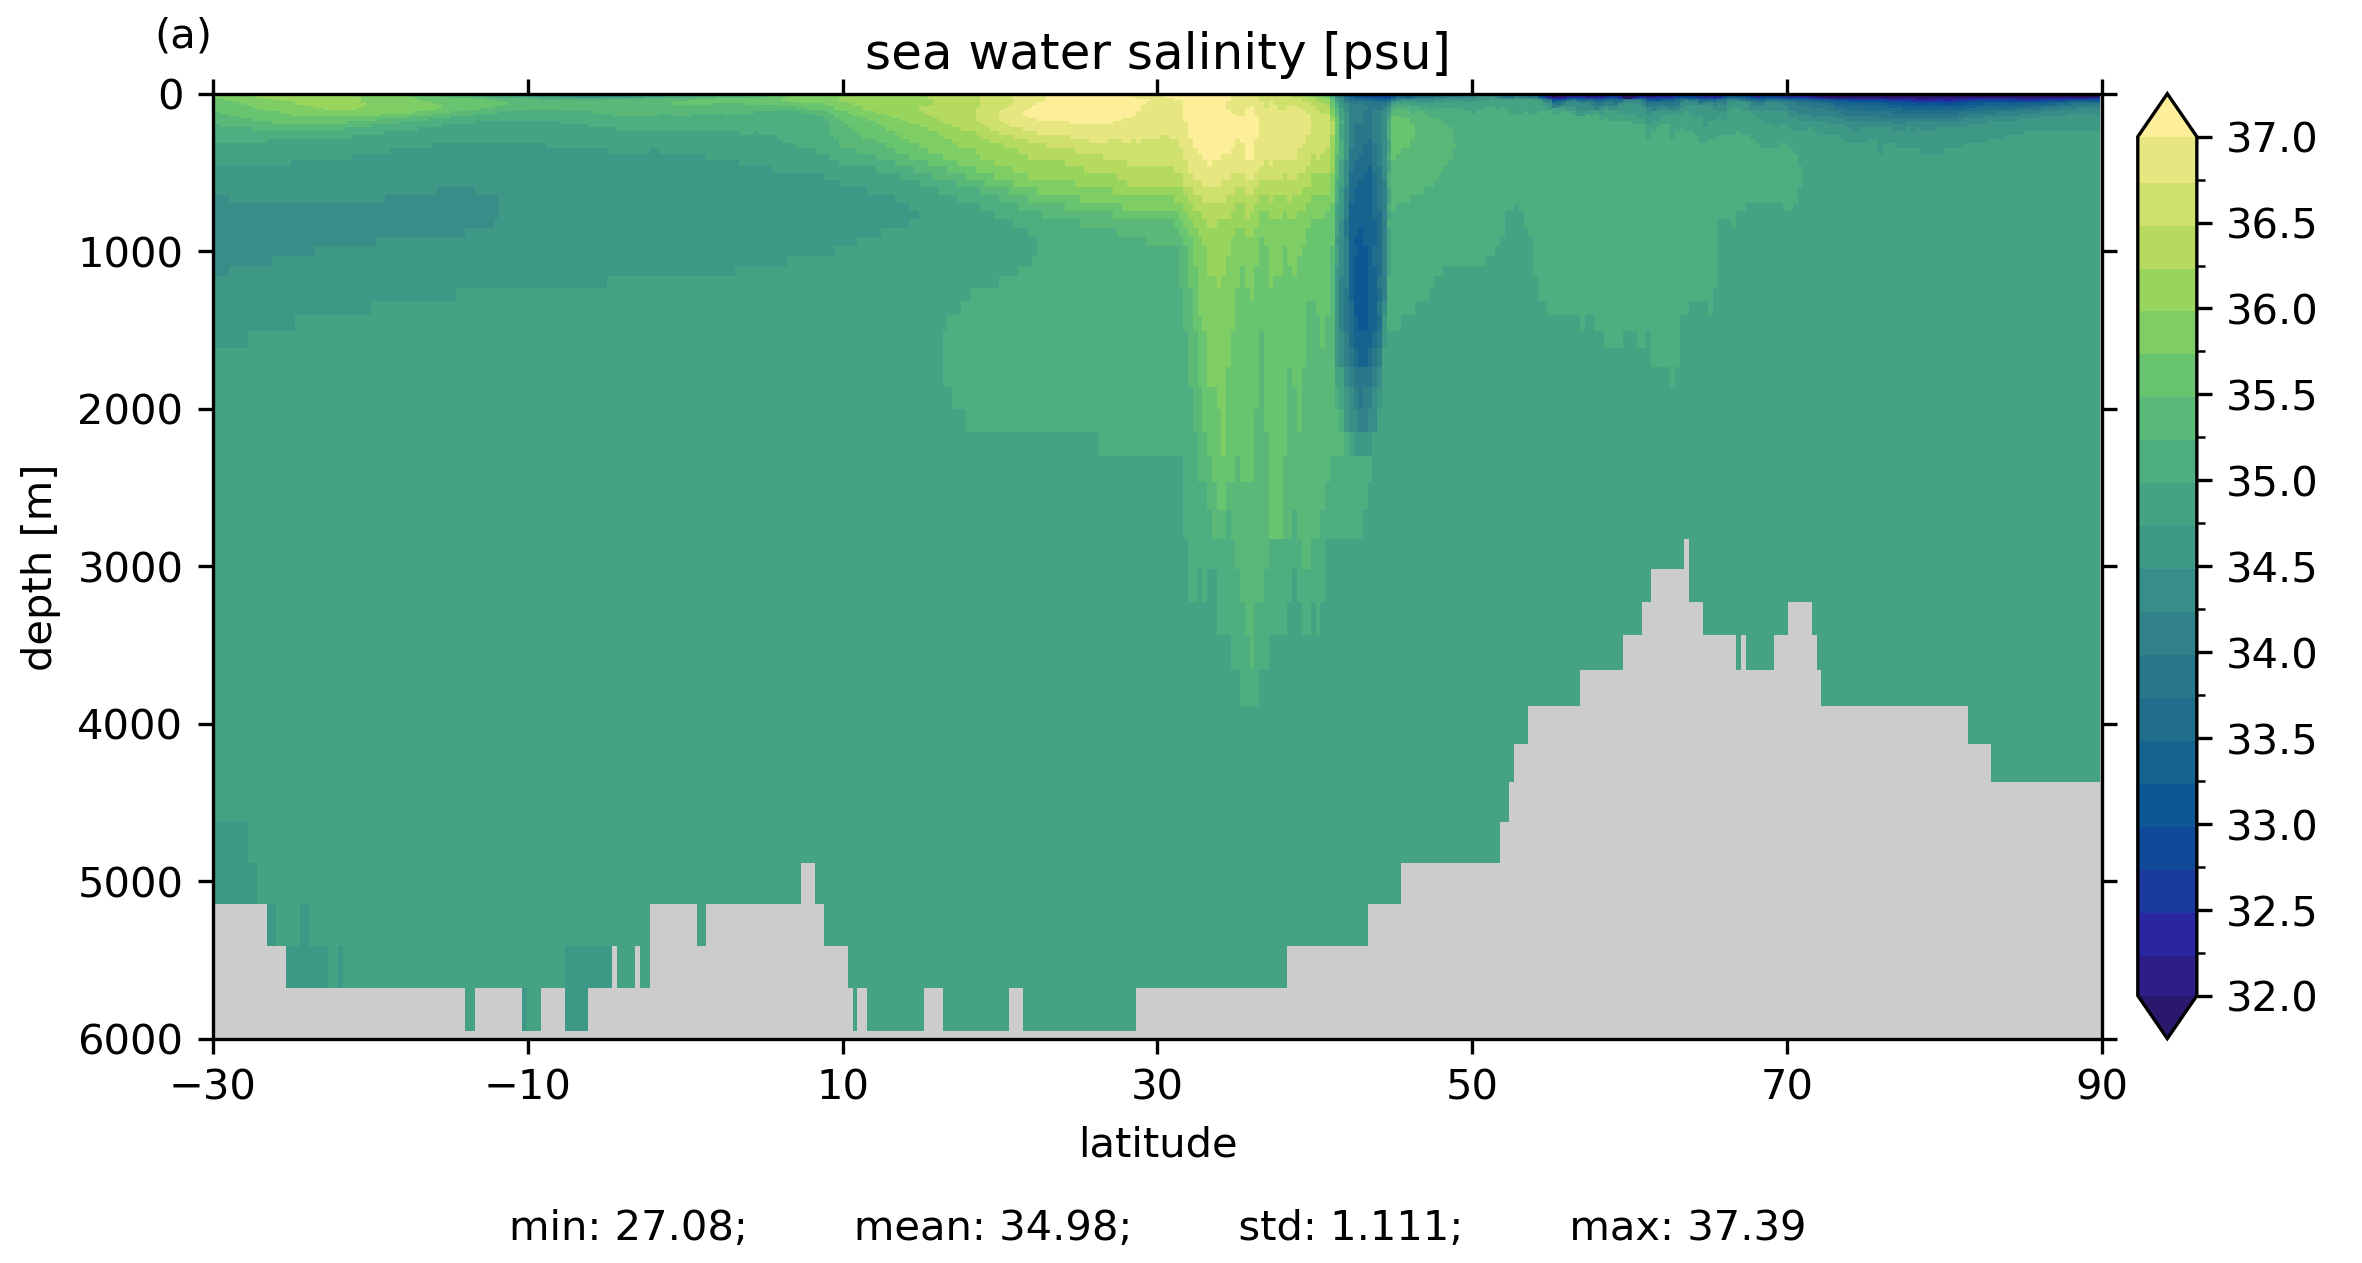
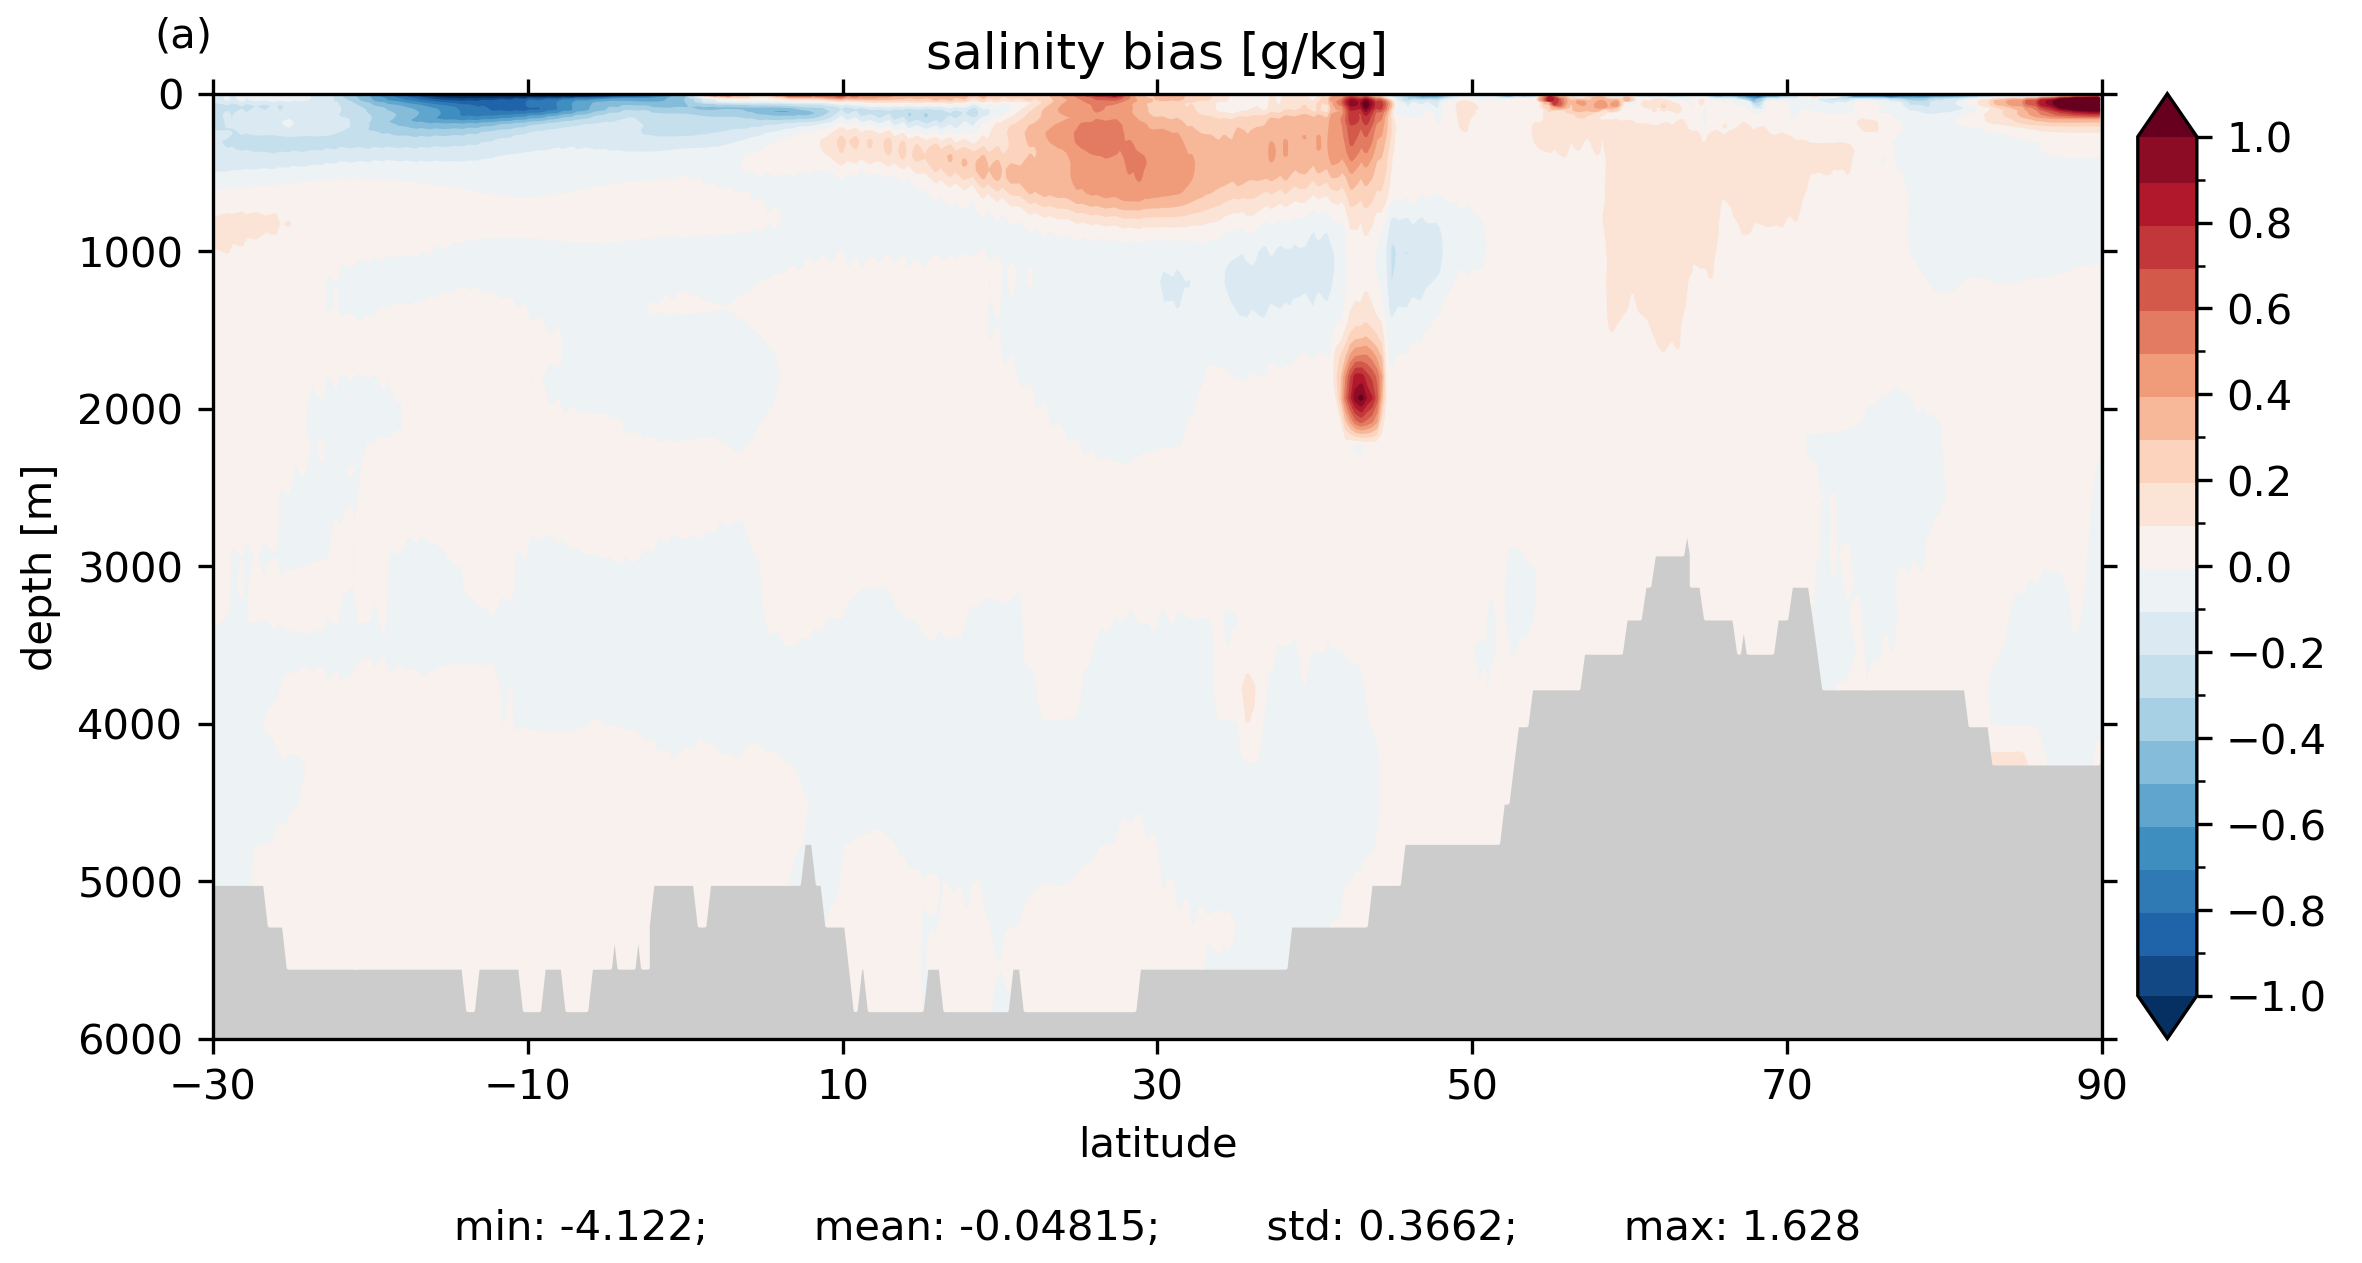
Salinity Atlantic zon. ave.
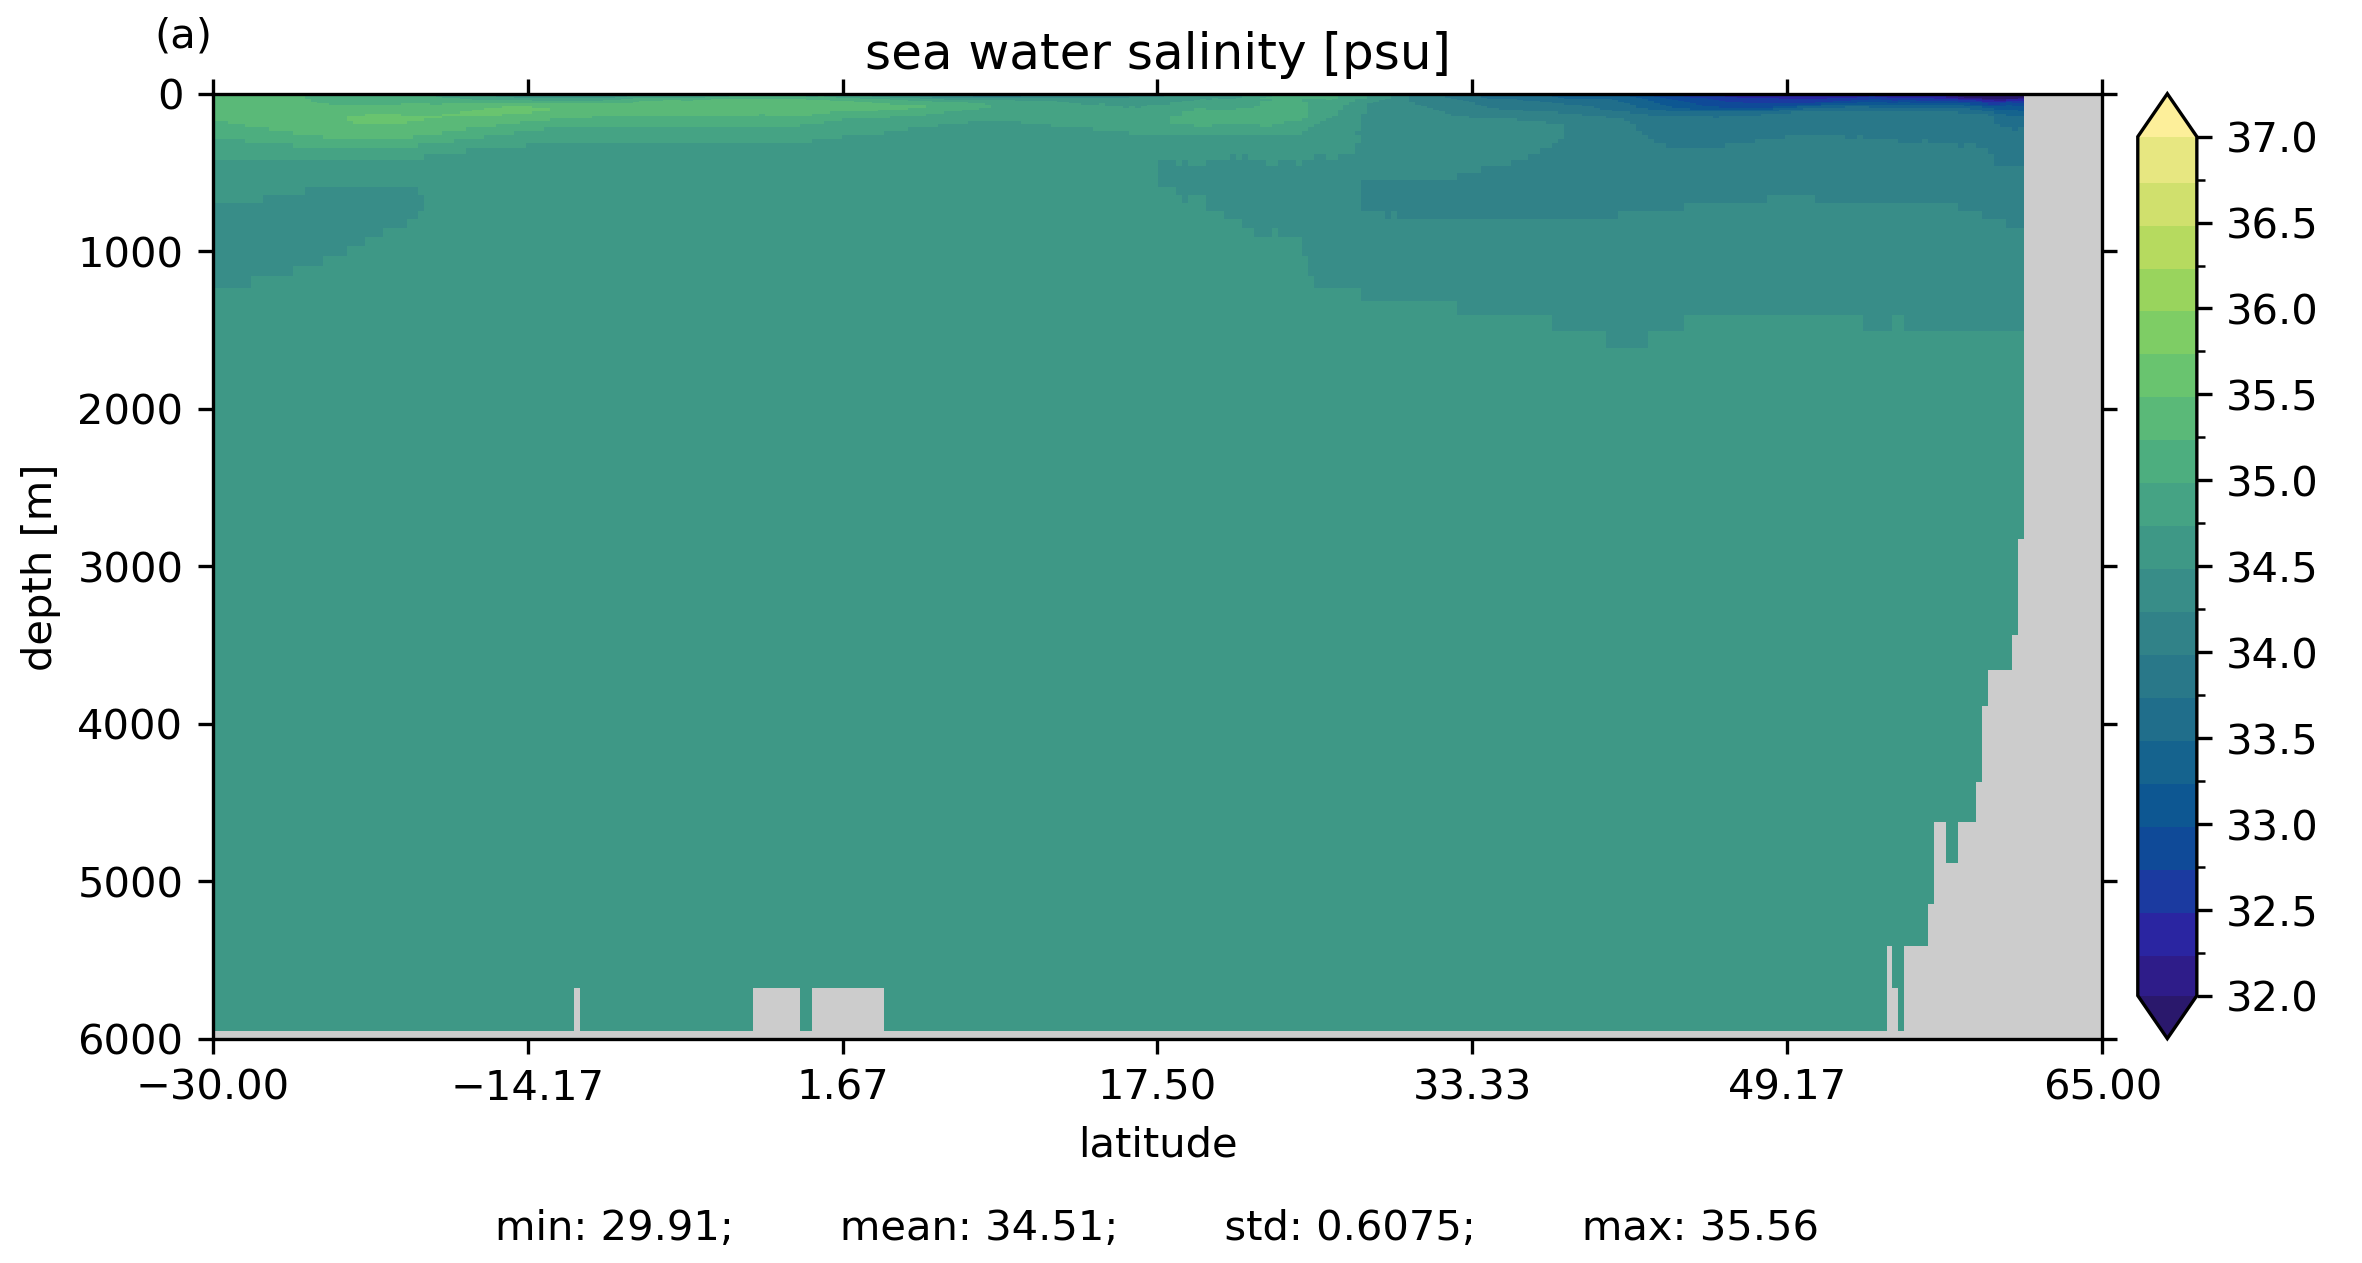
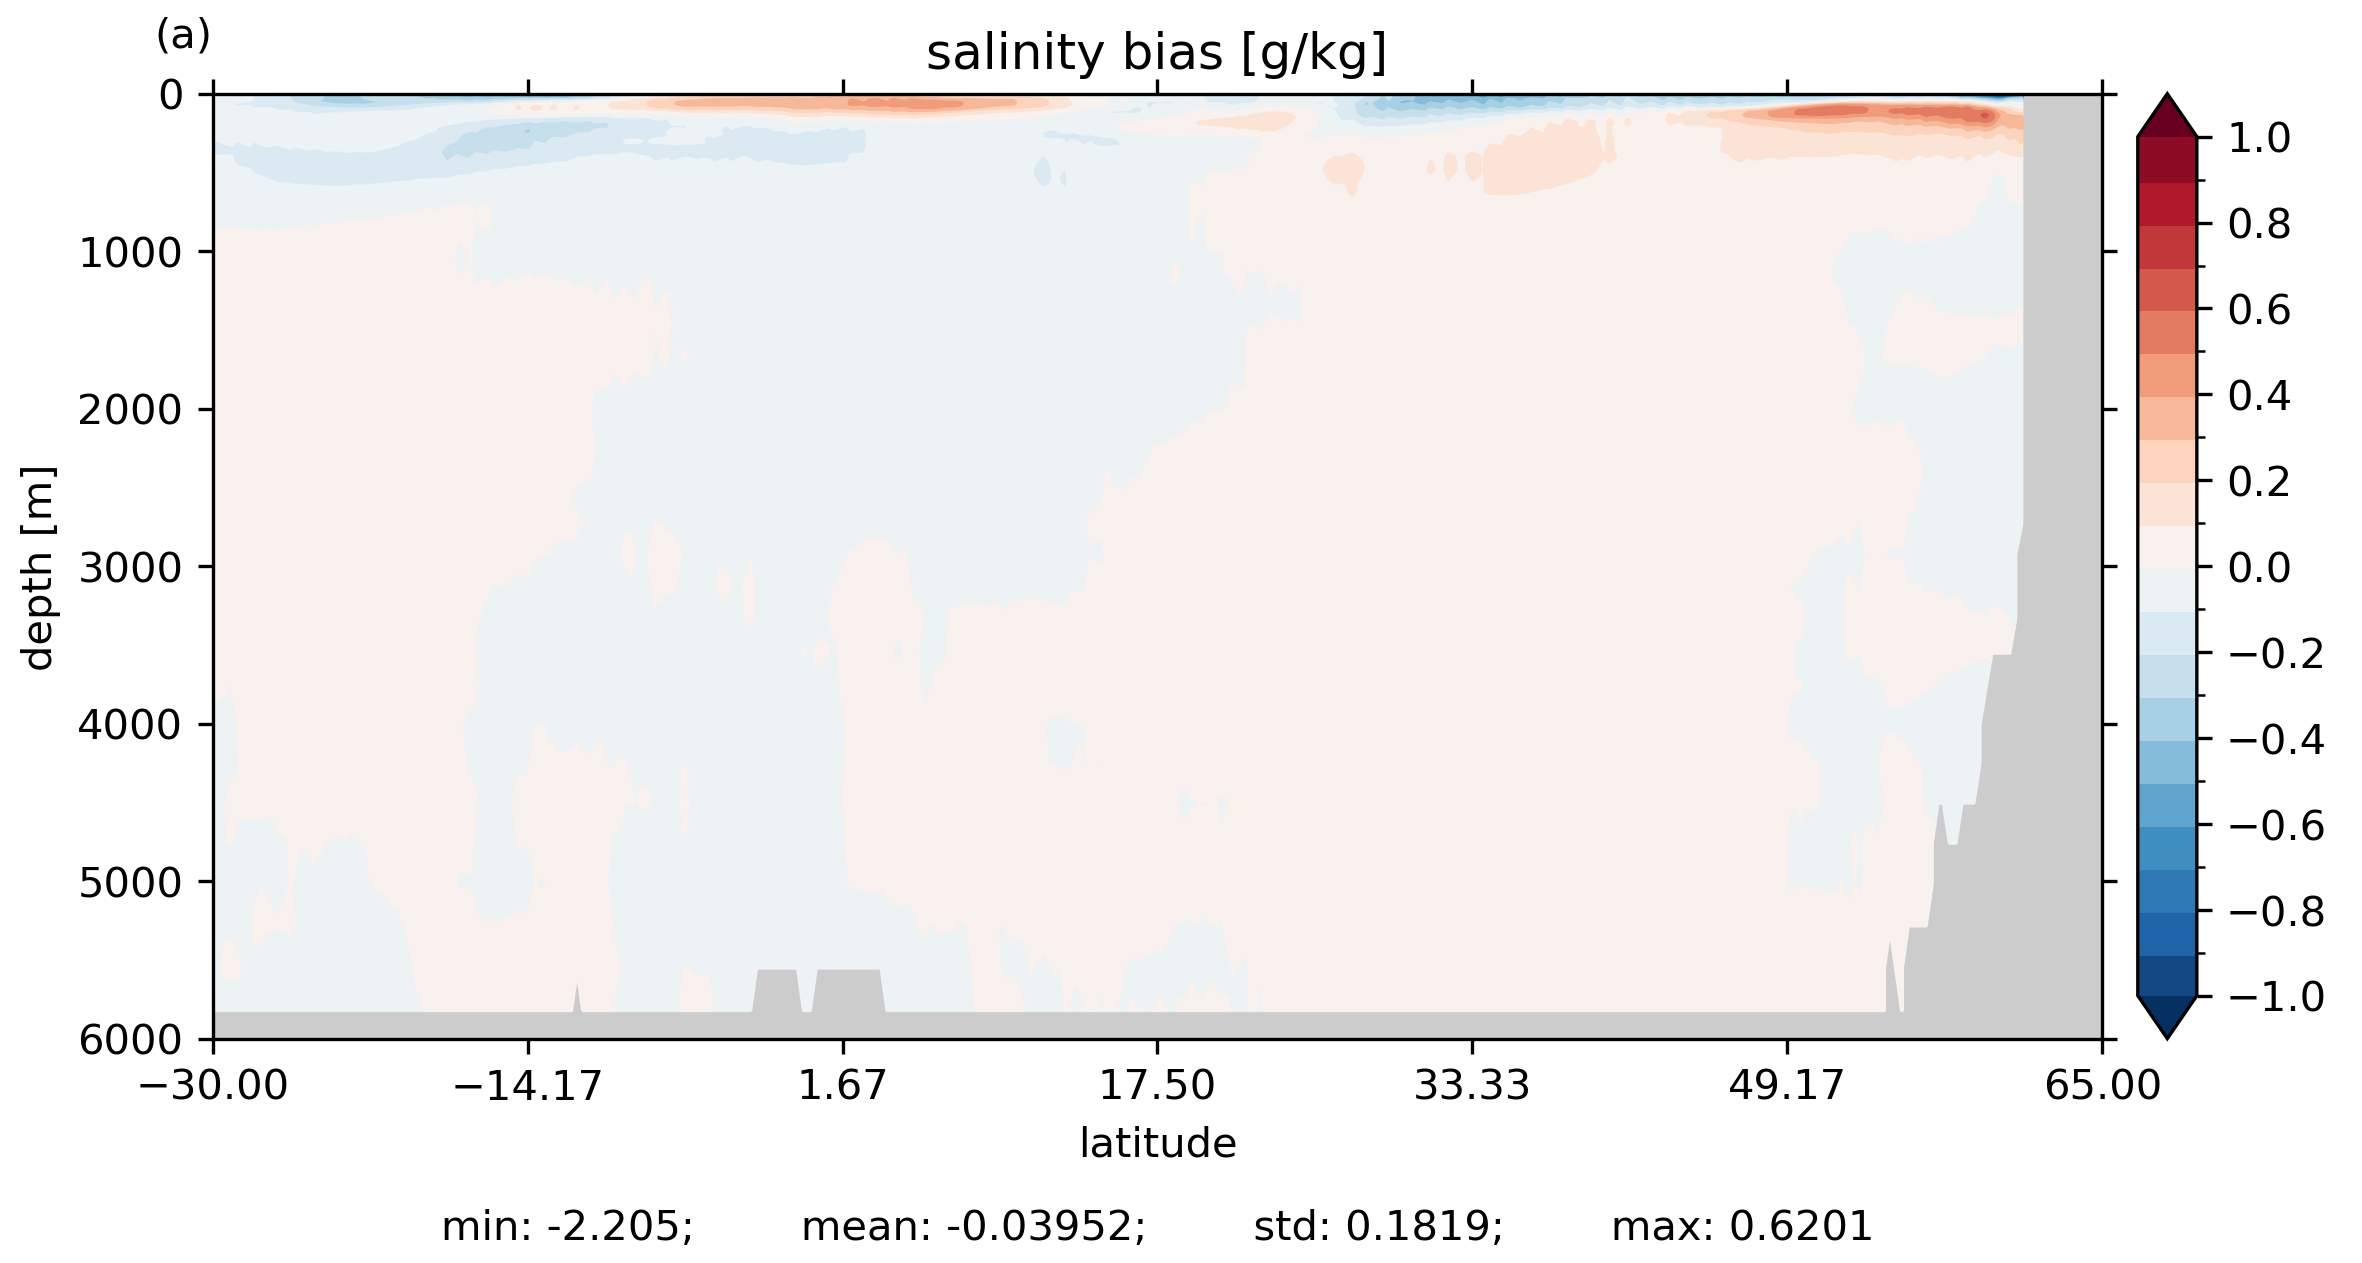
Salinity Indo-Pac. zon. ave.
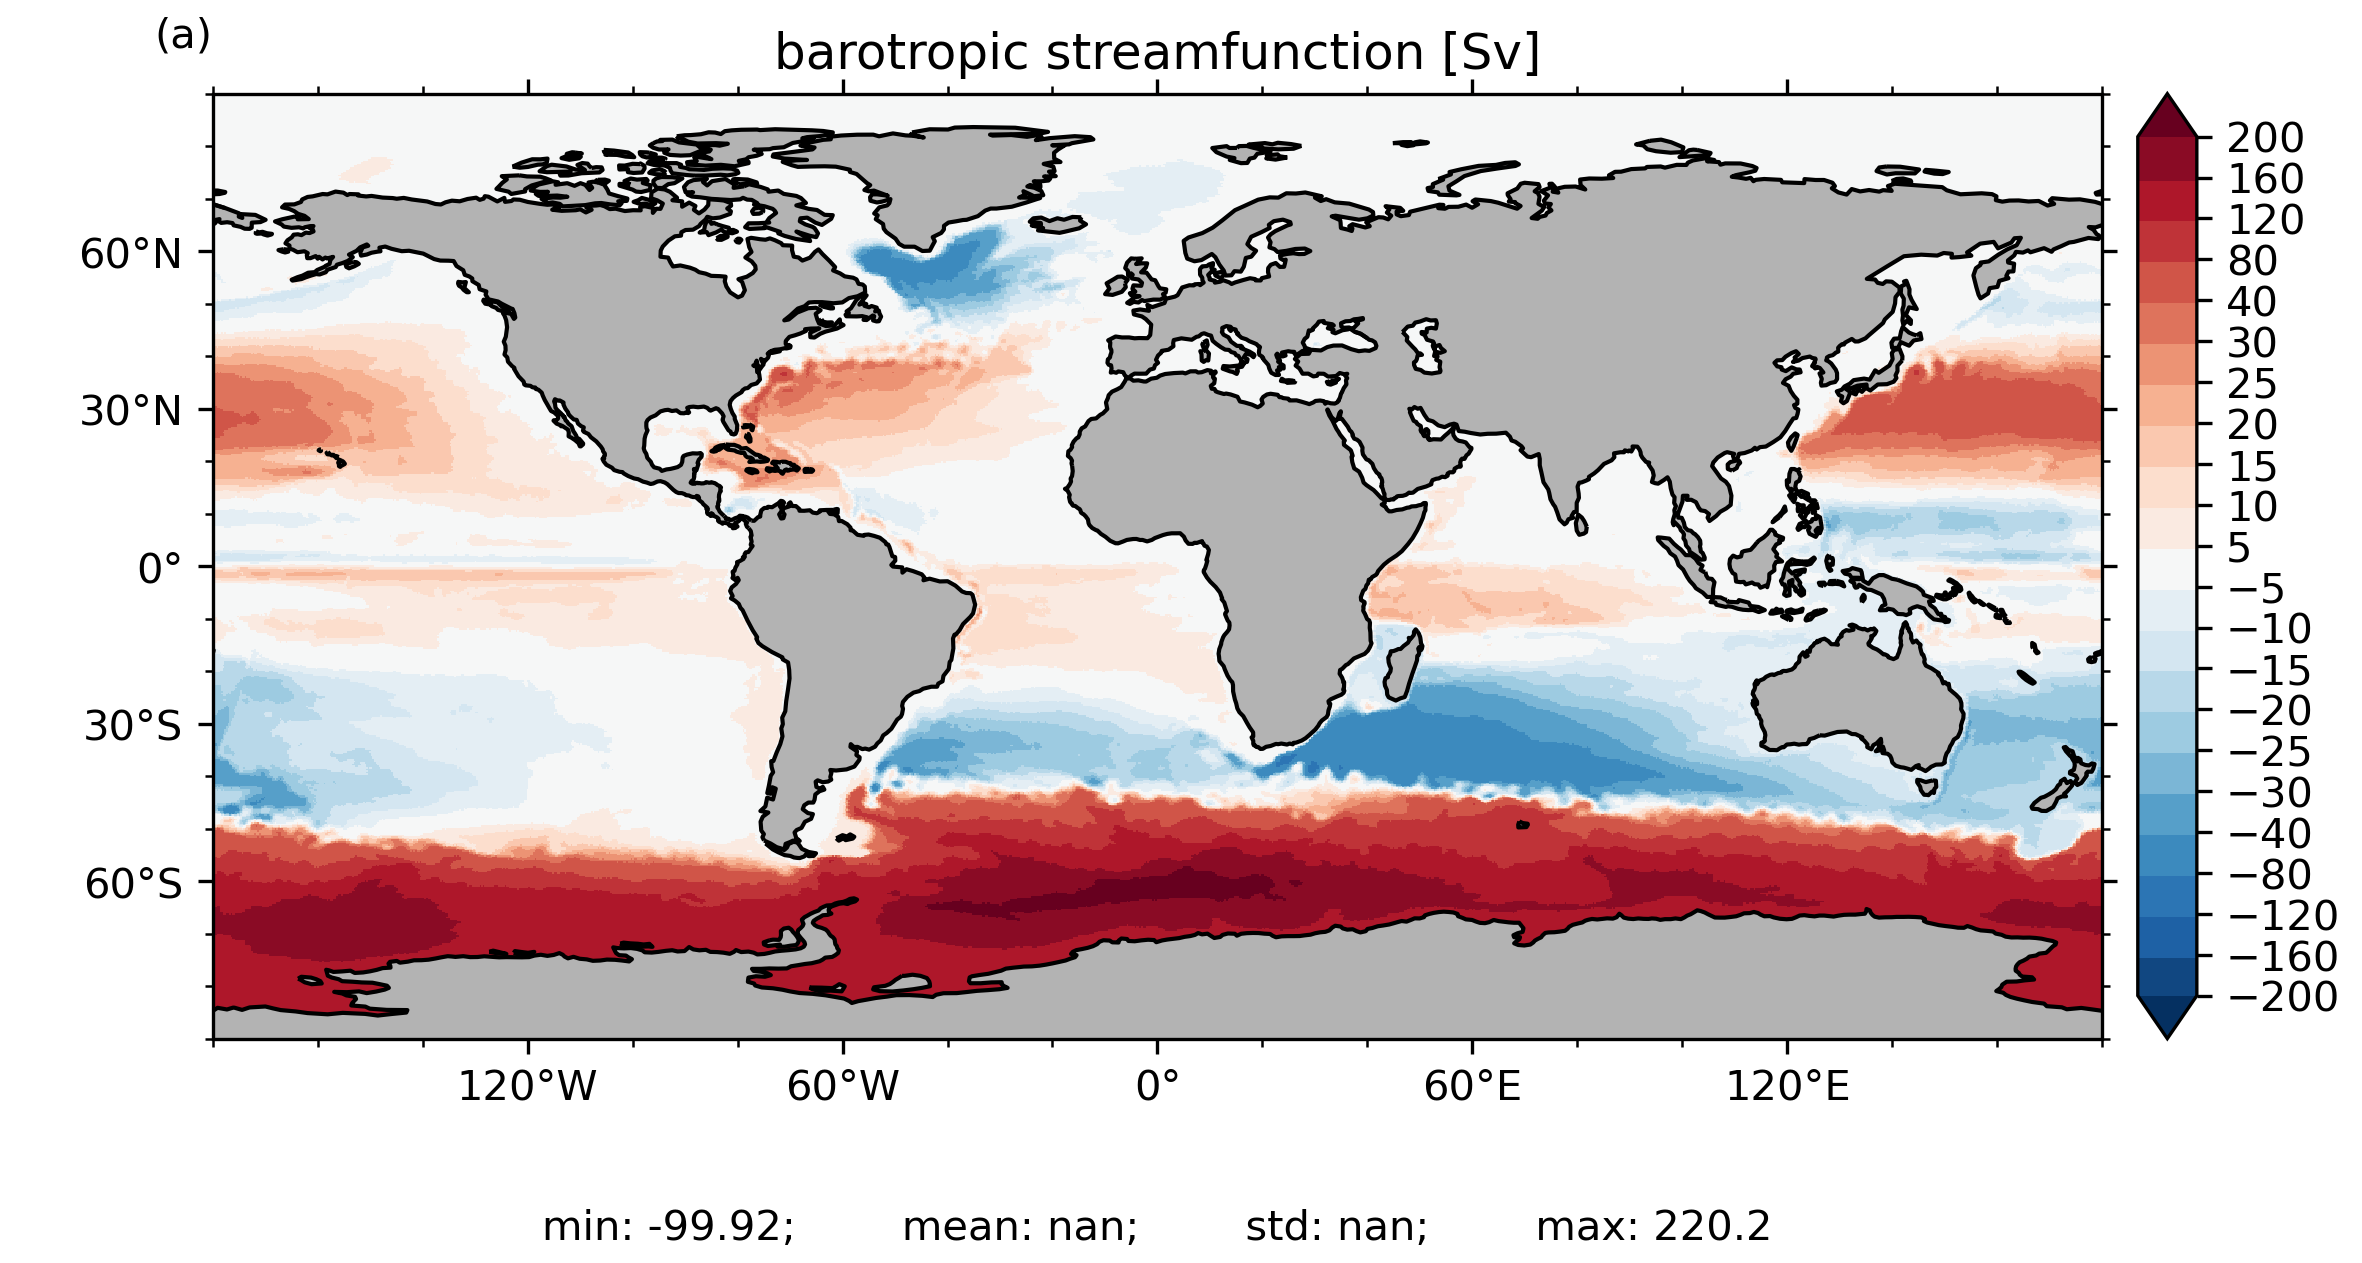
Barotropic streamfunction
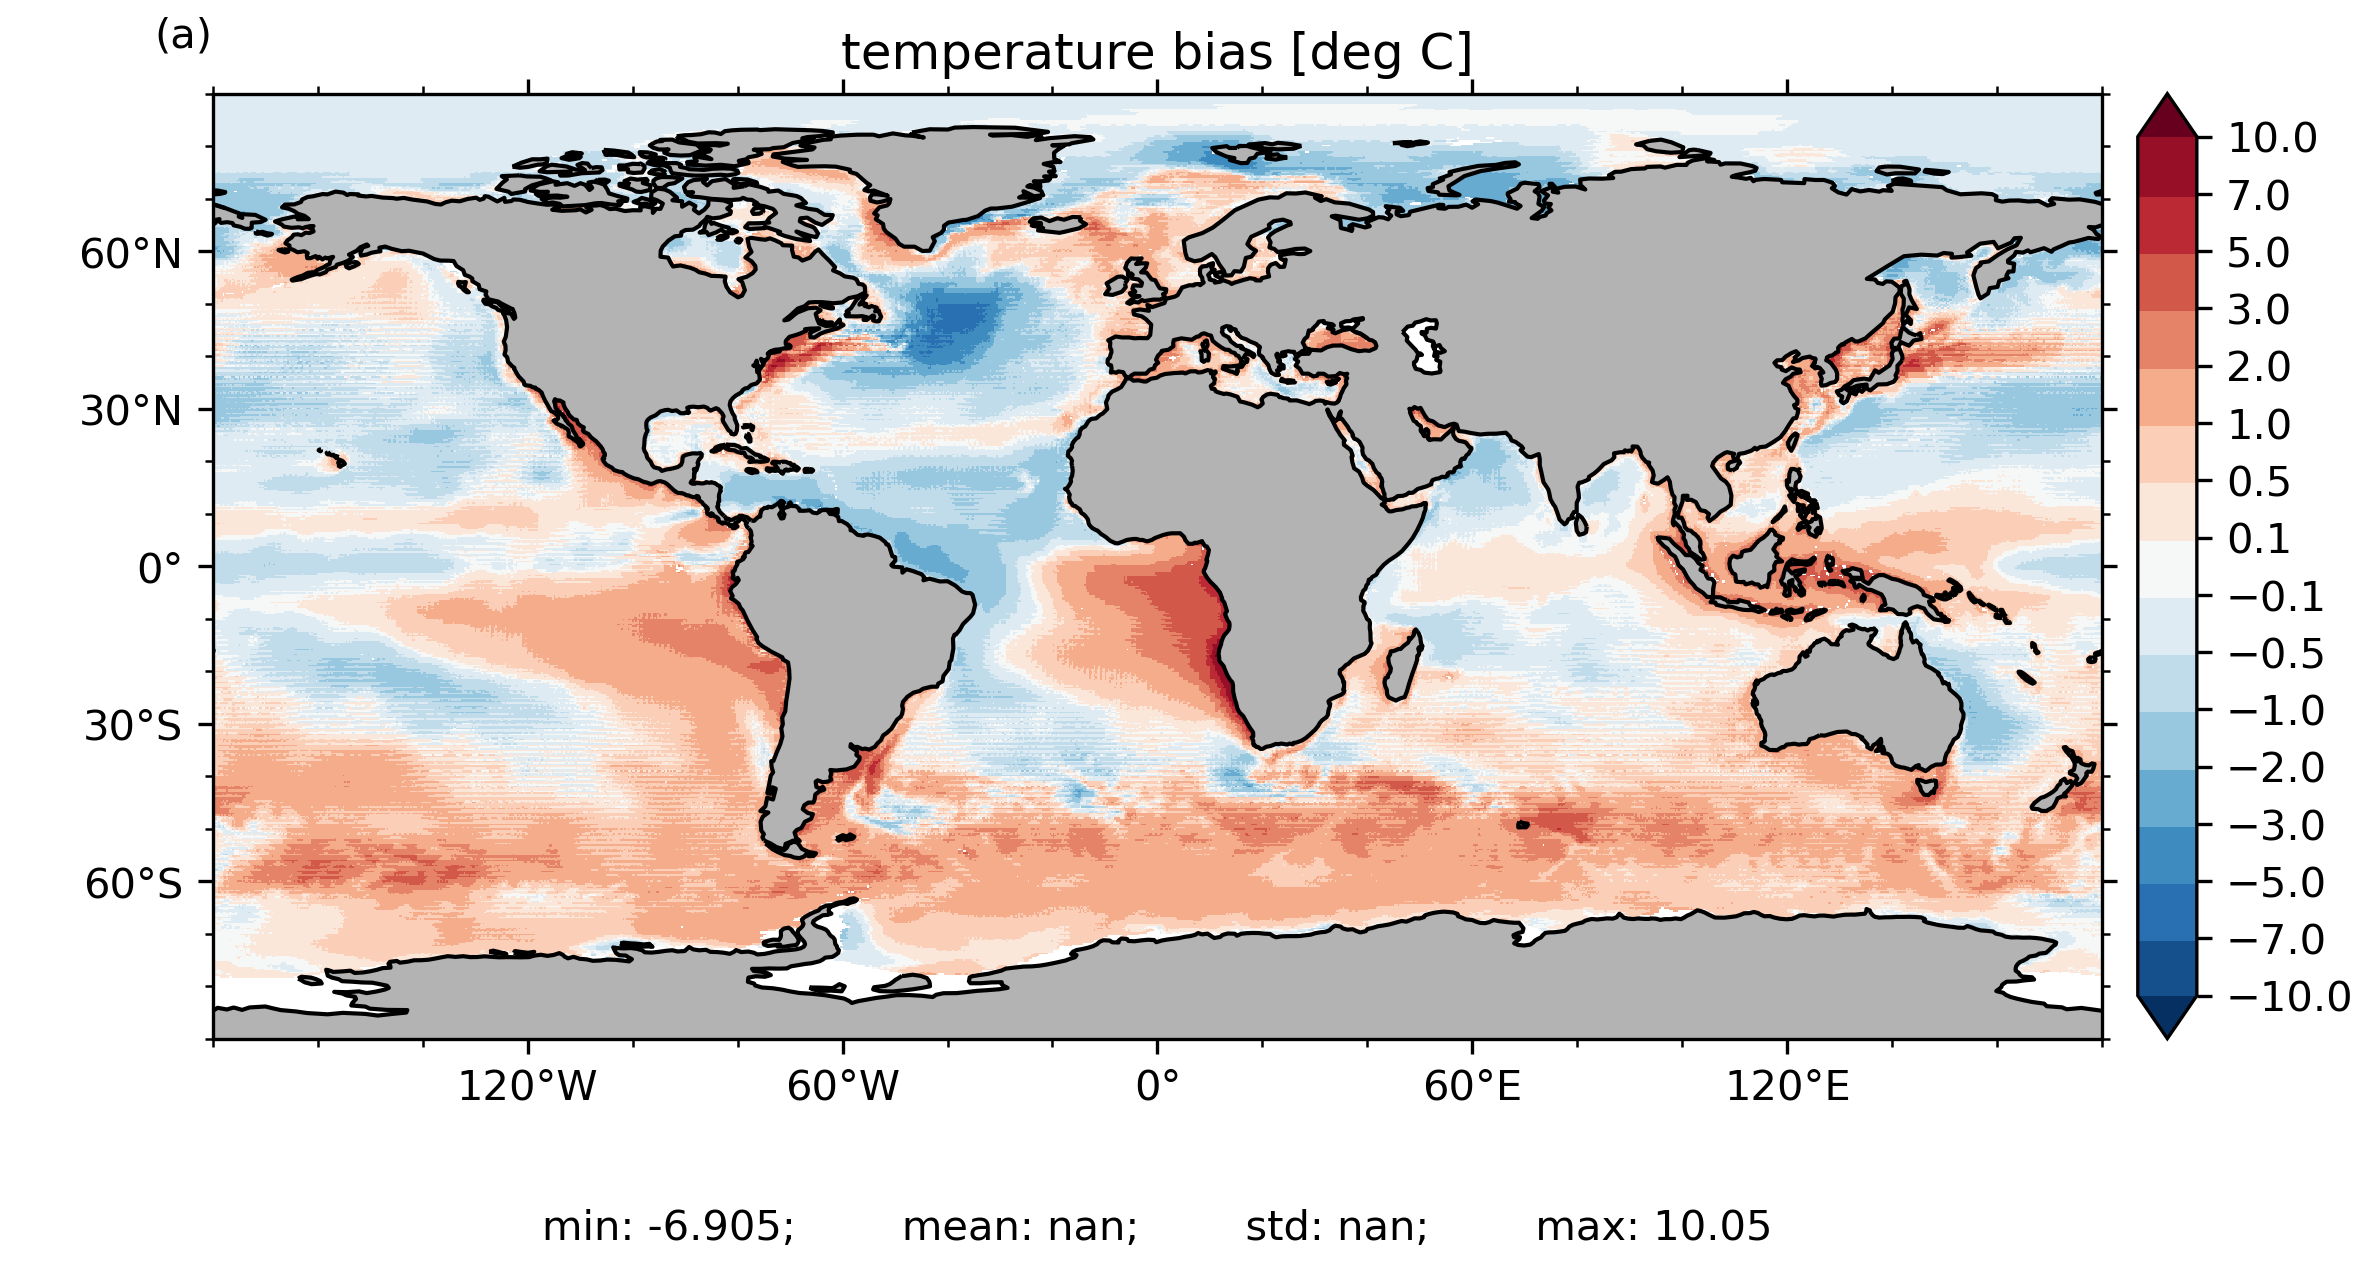
Tbias: Atlantic zon. ave.
Tbias: Indo-Pac. zon. ave.
Sbias: Atlantic zon. ave.
Sbias: Indo-Pac. zon. ave.
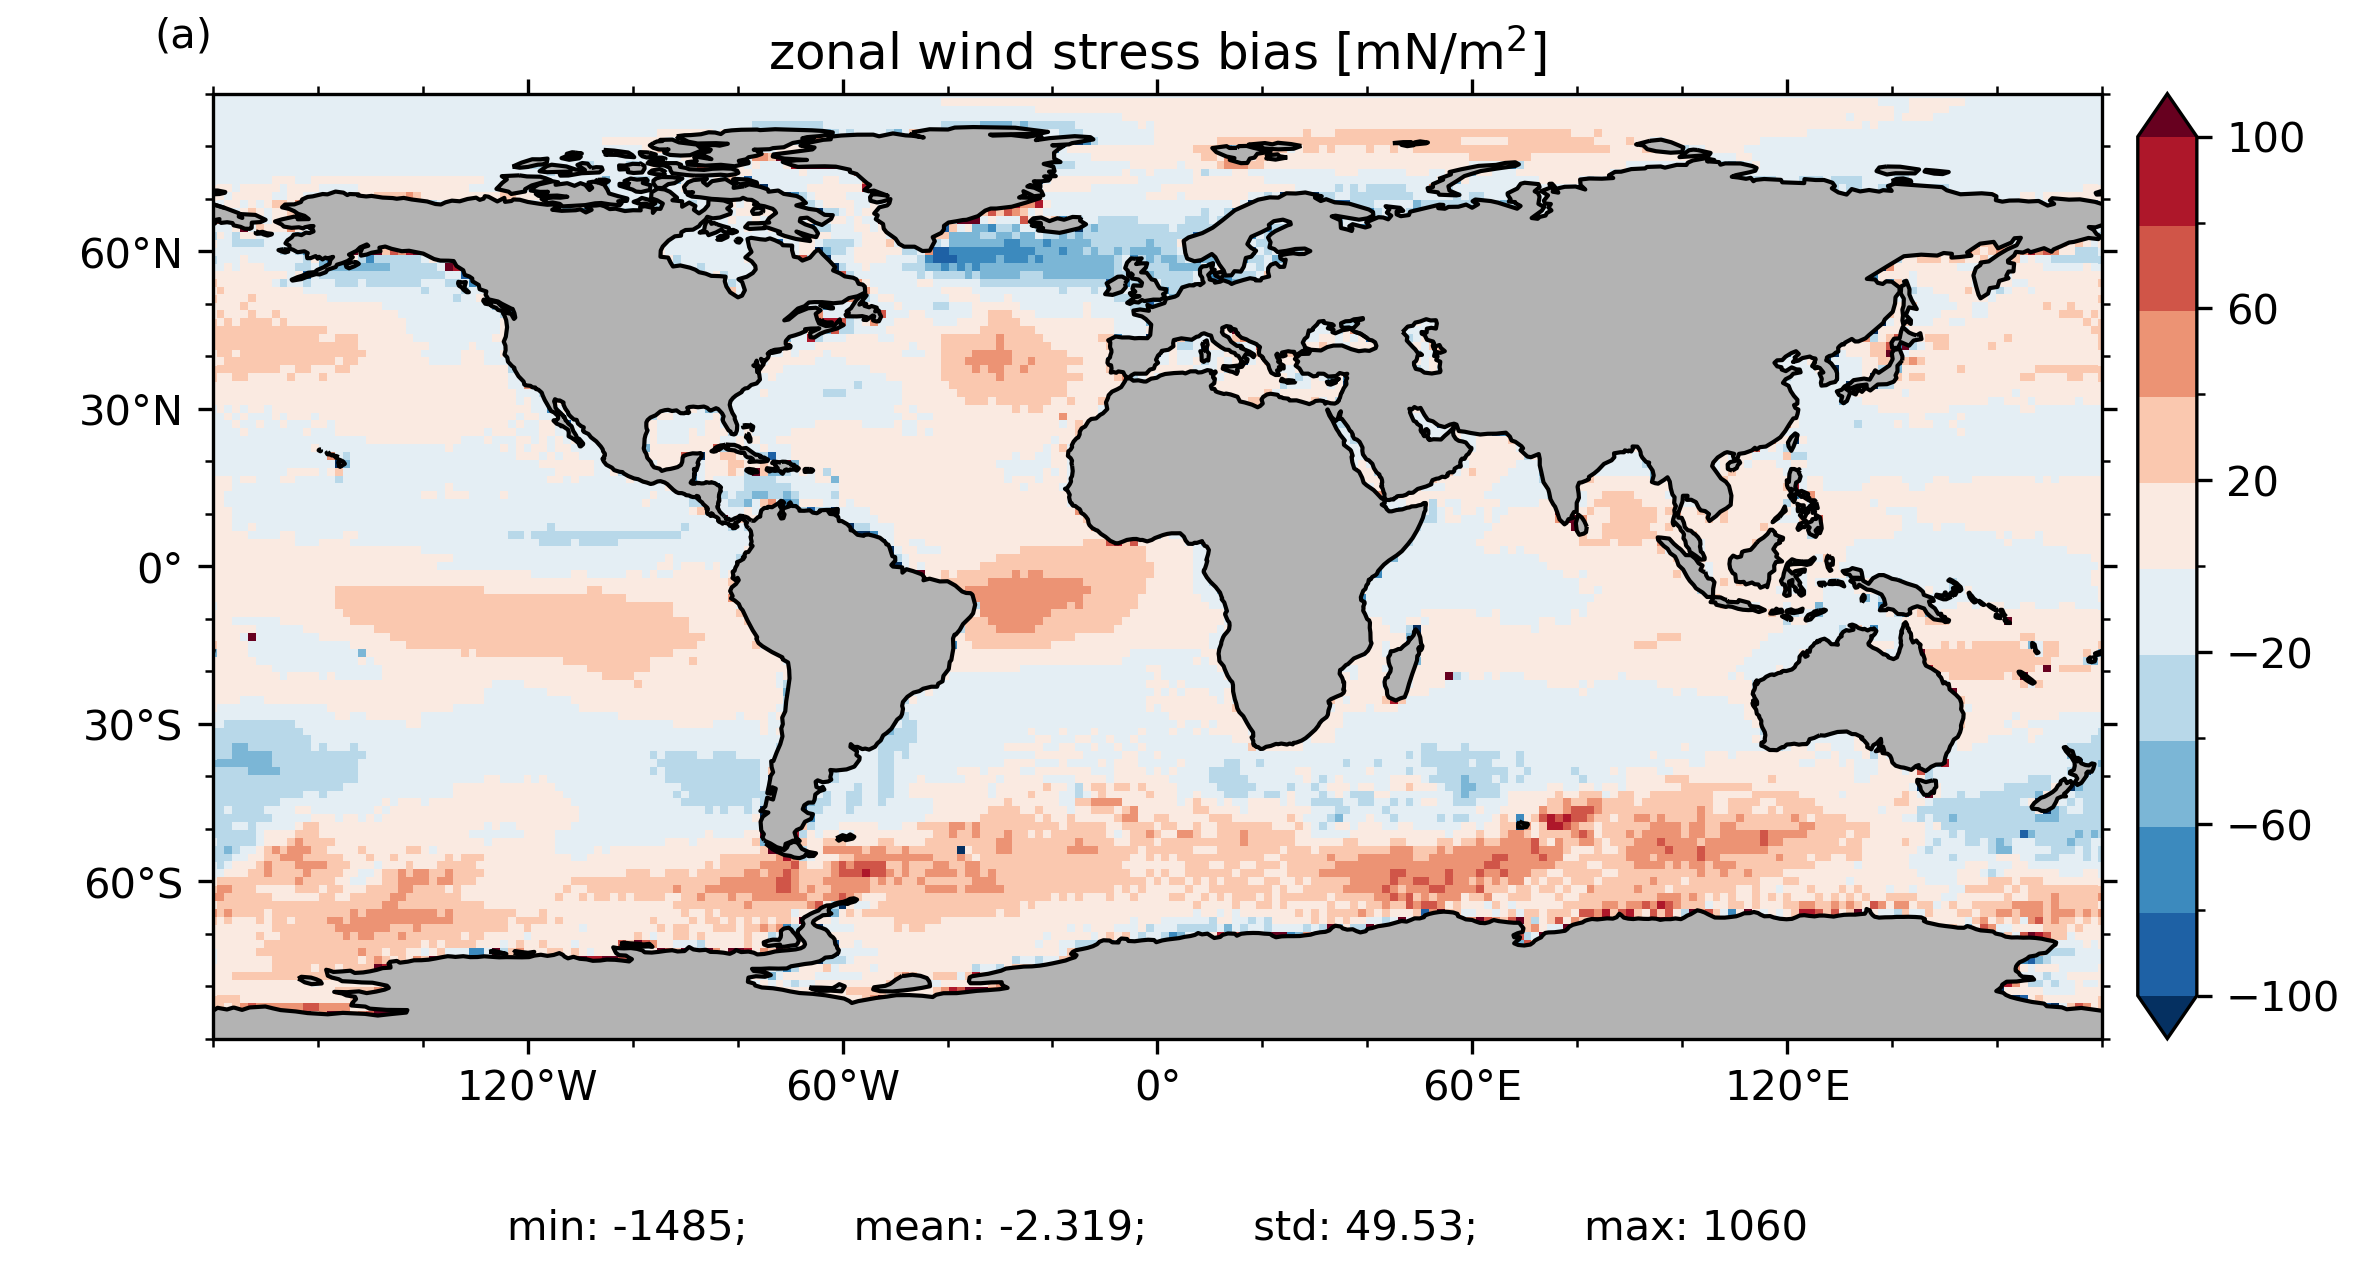
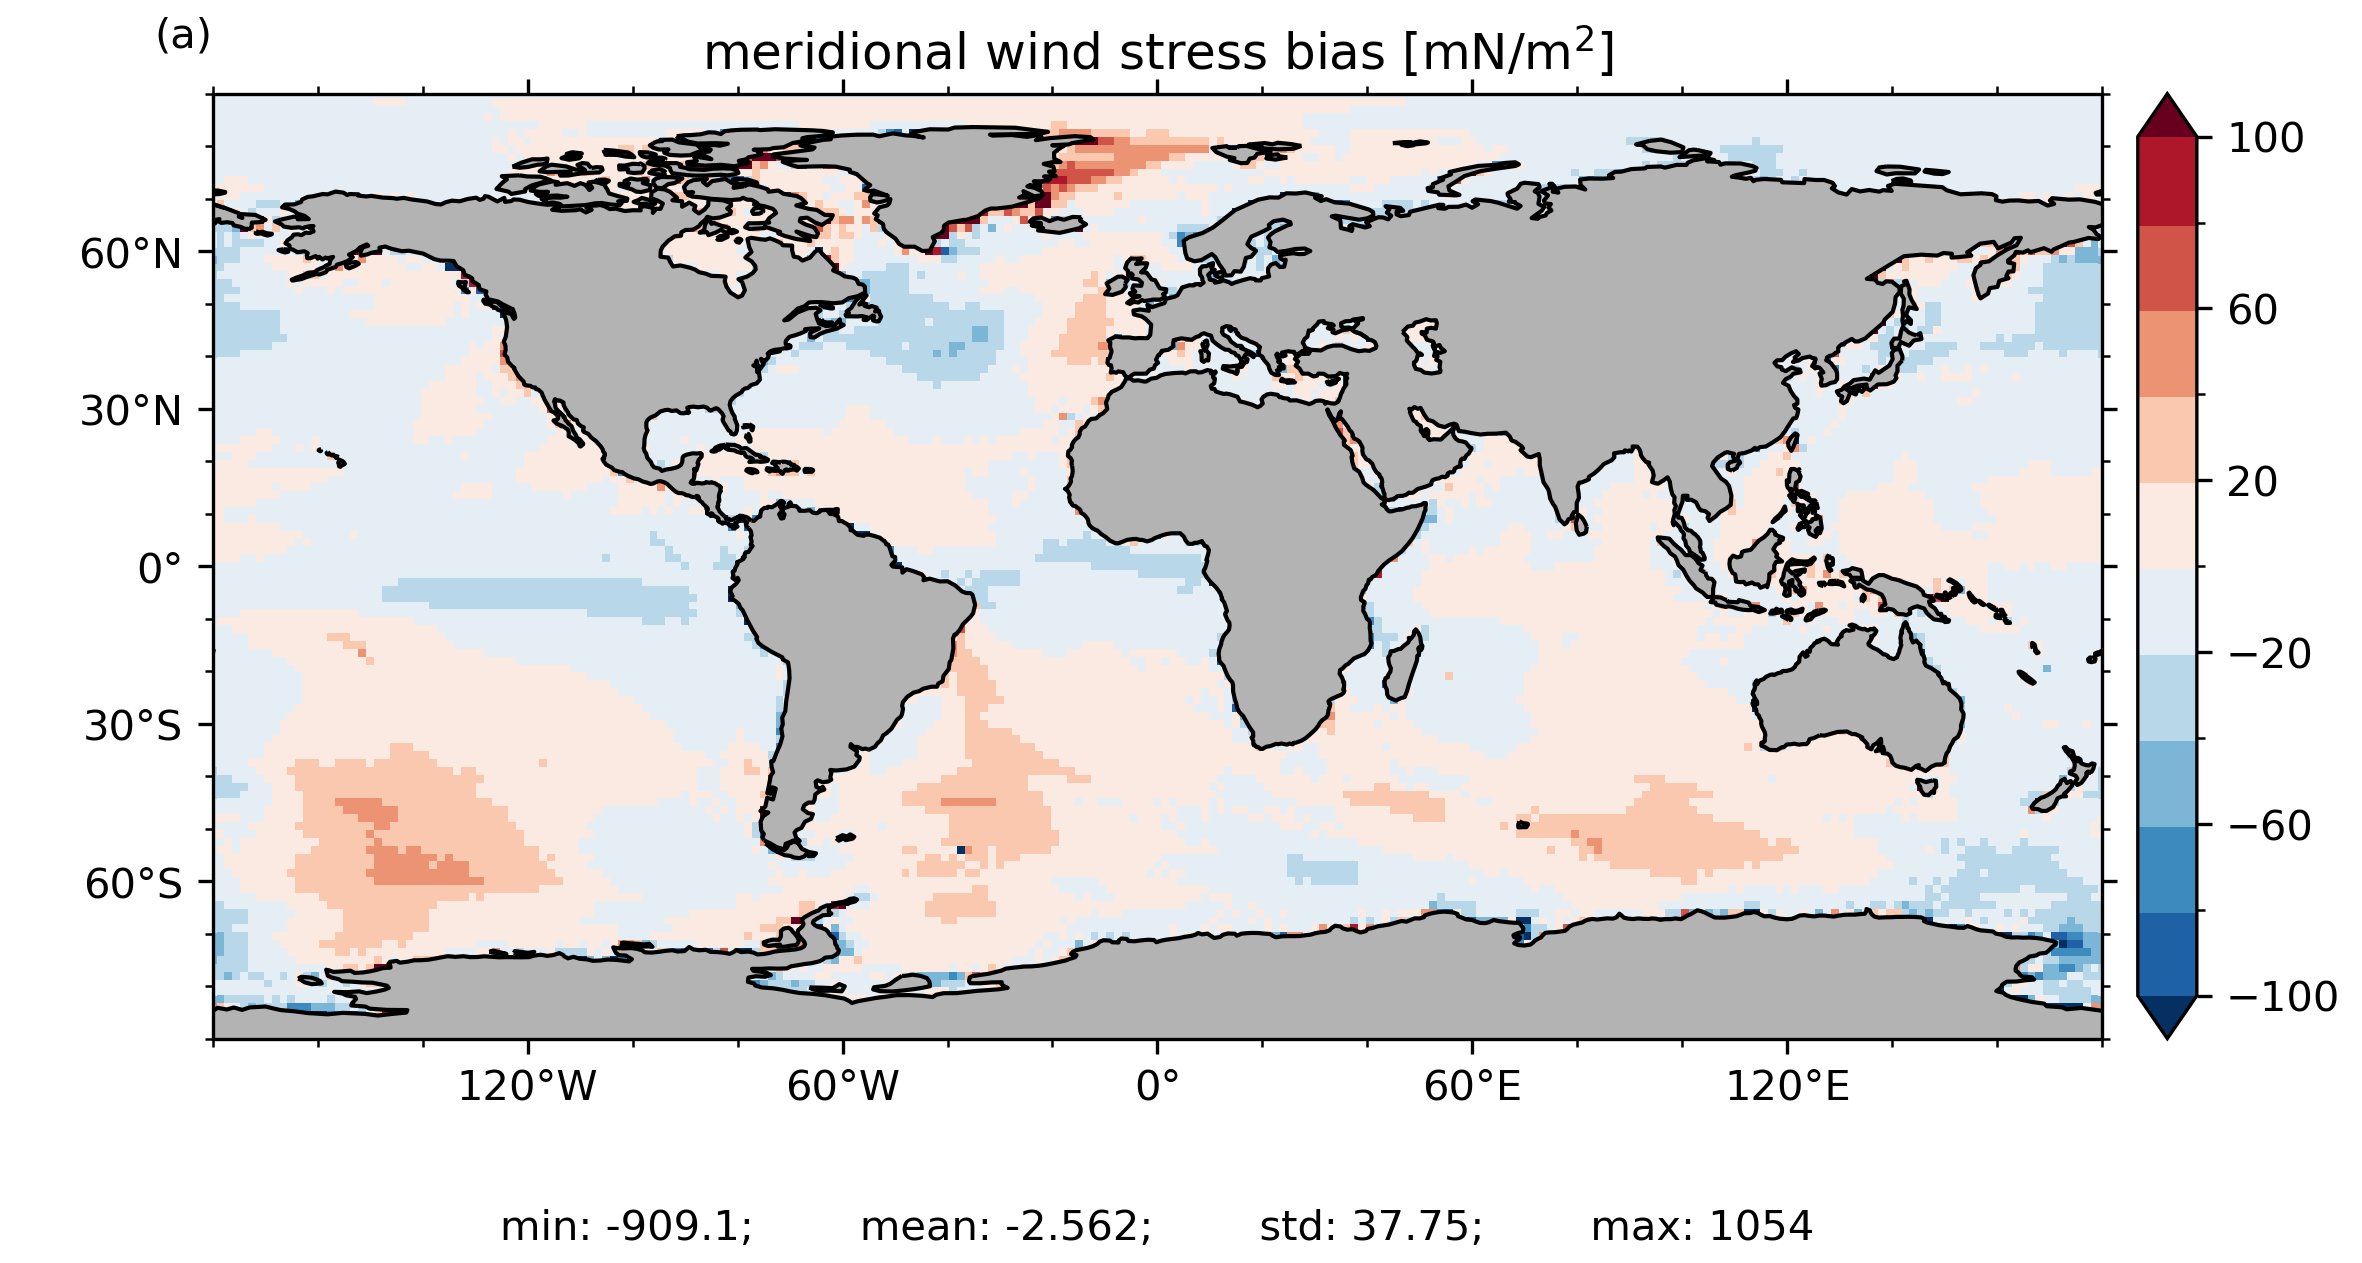
meridional wind stress bias
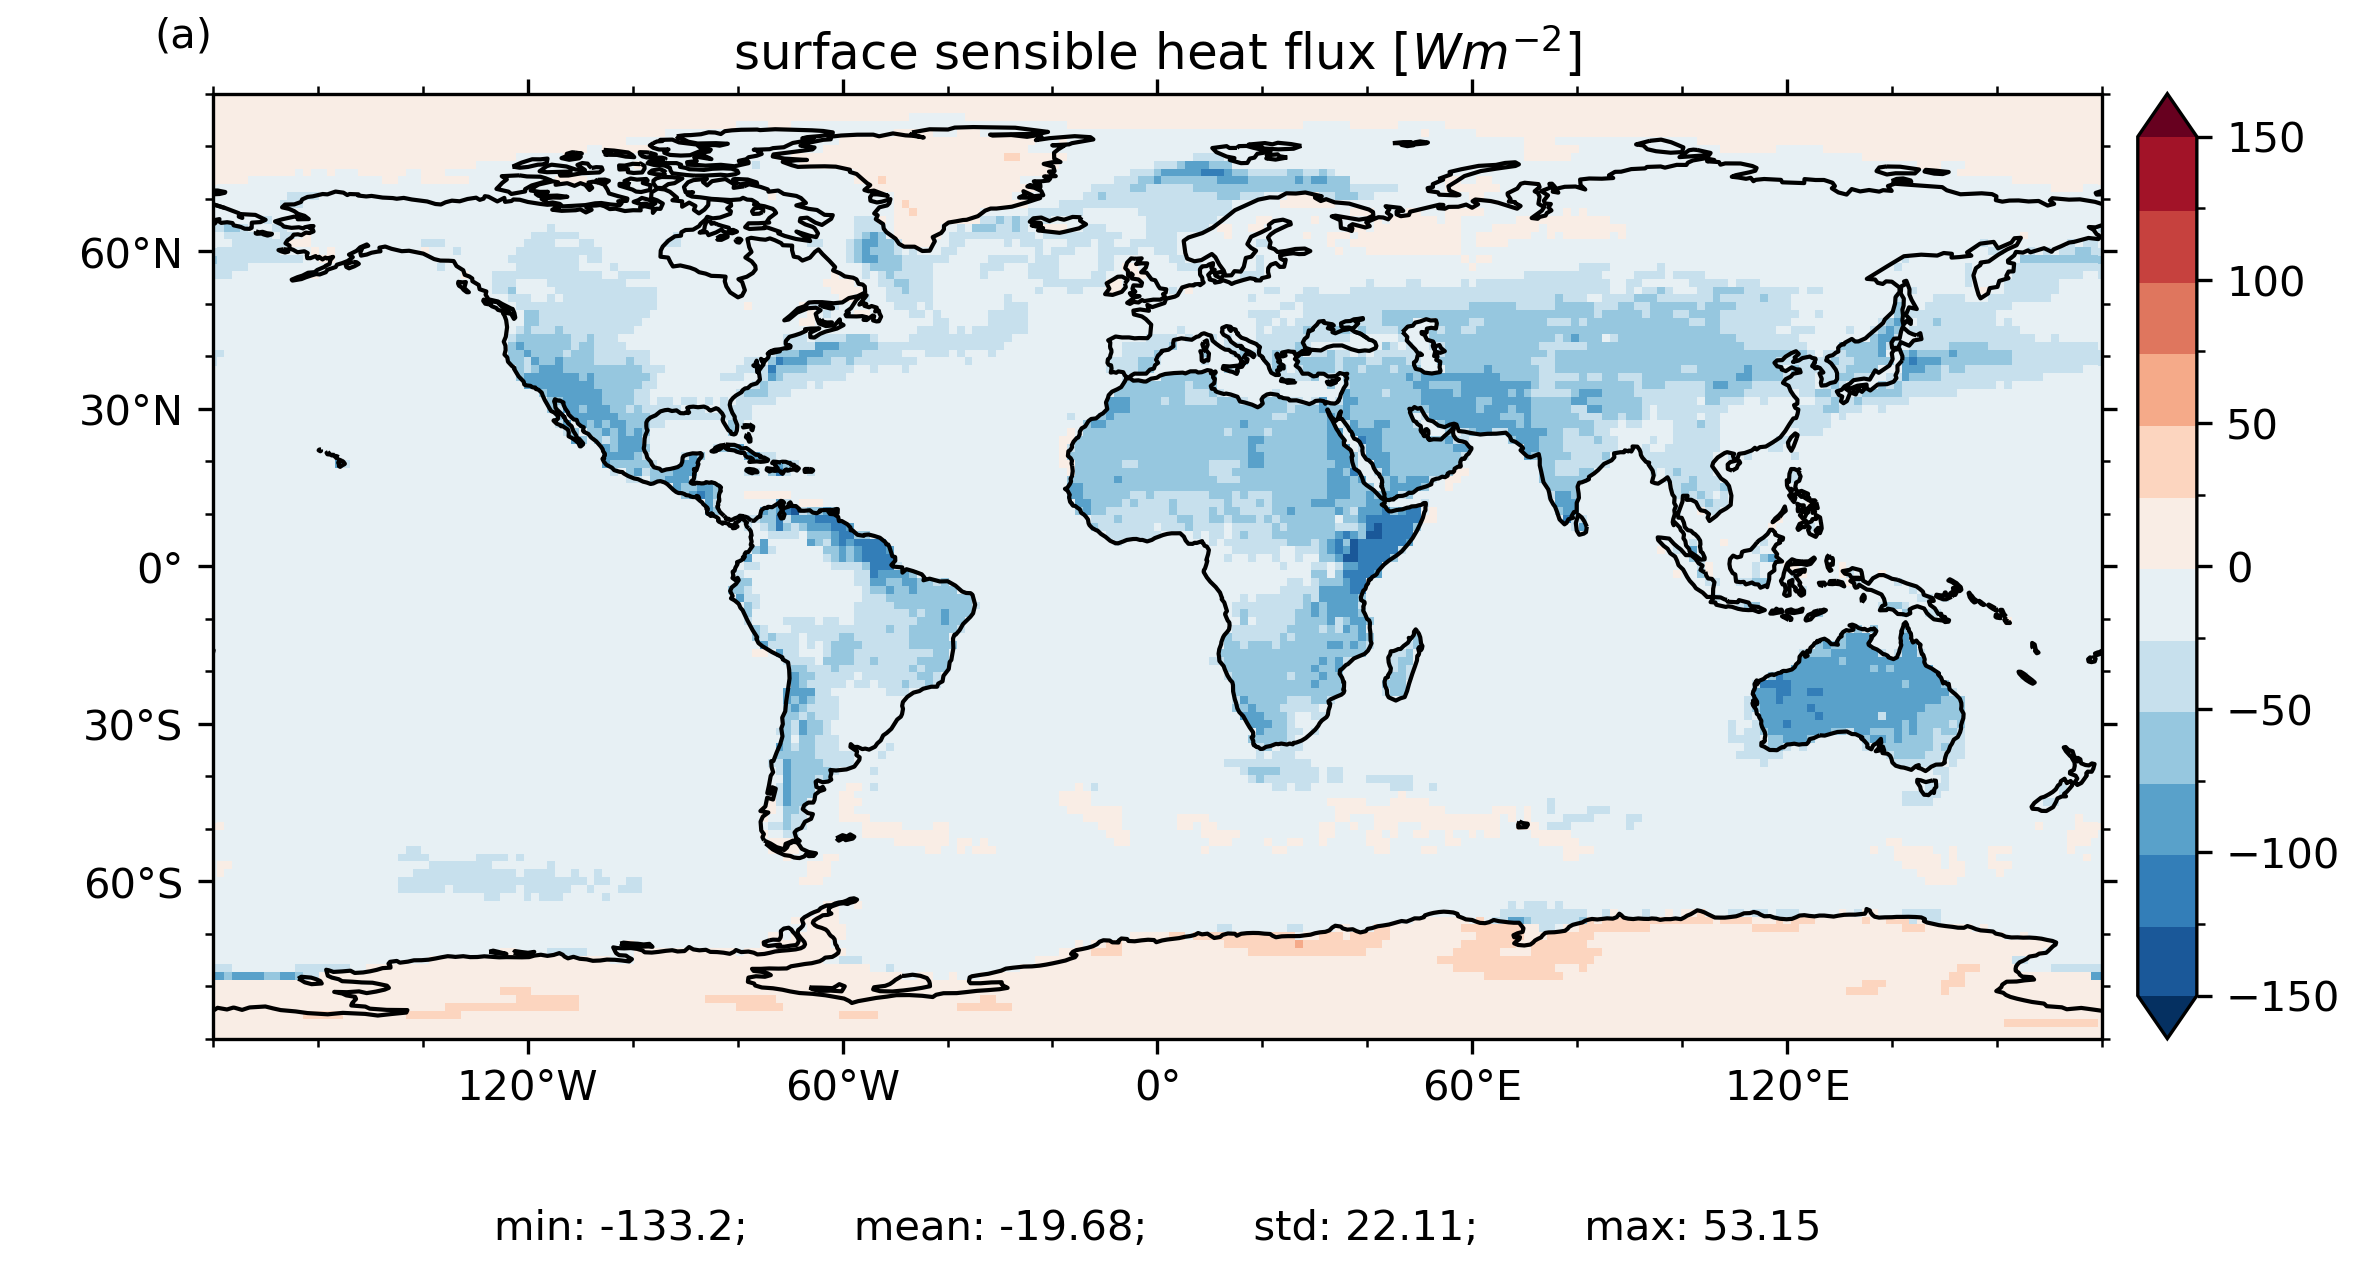
surface sensible heat flux
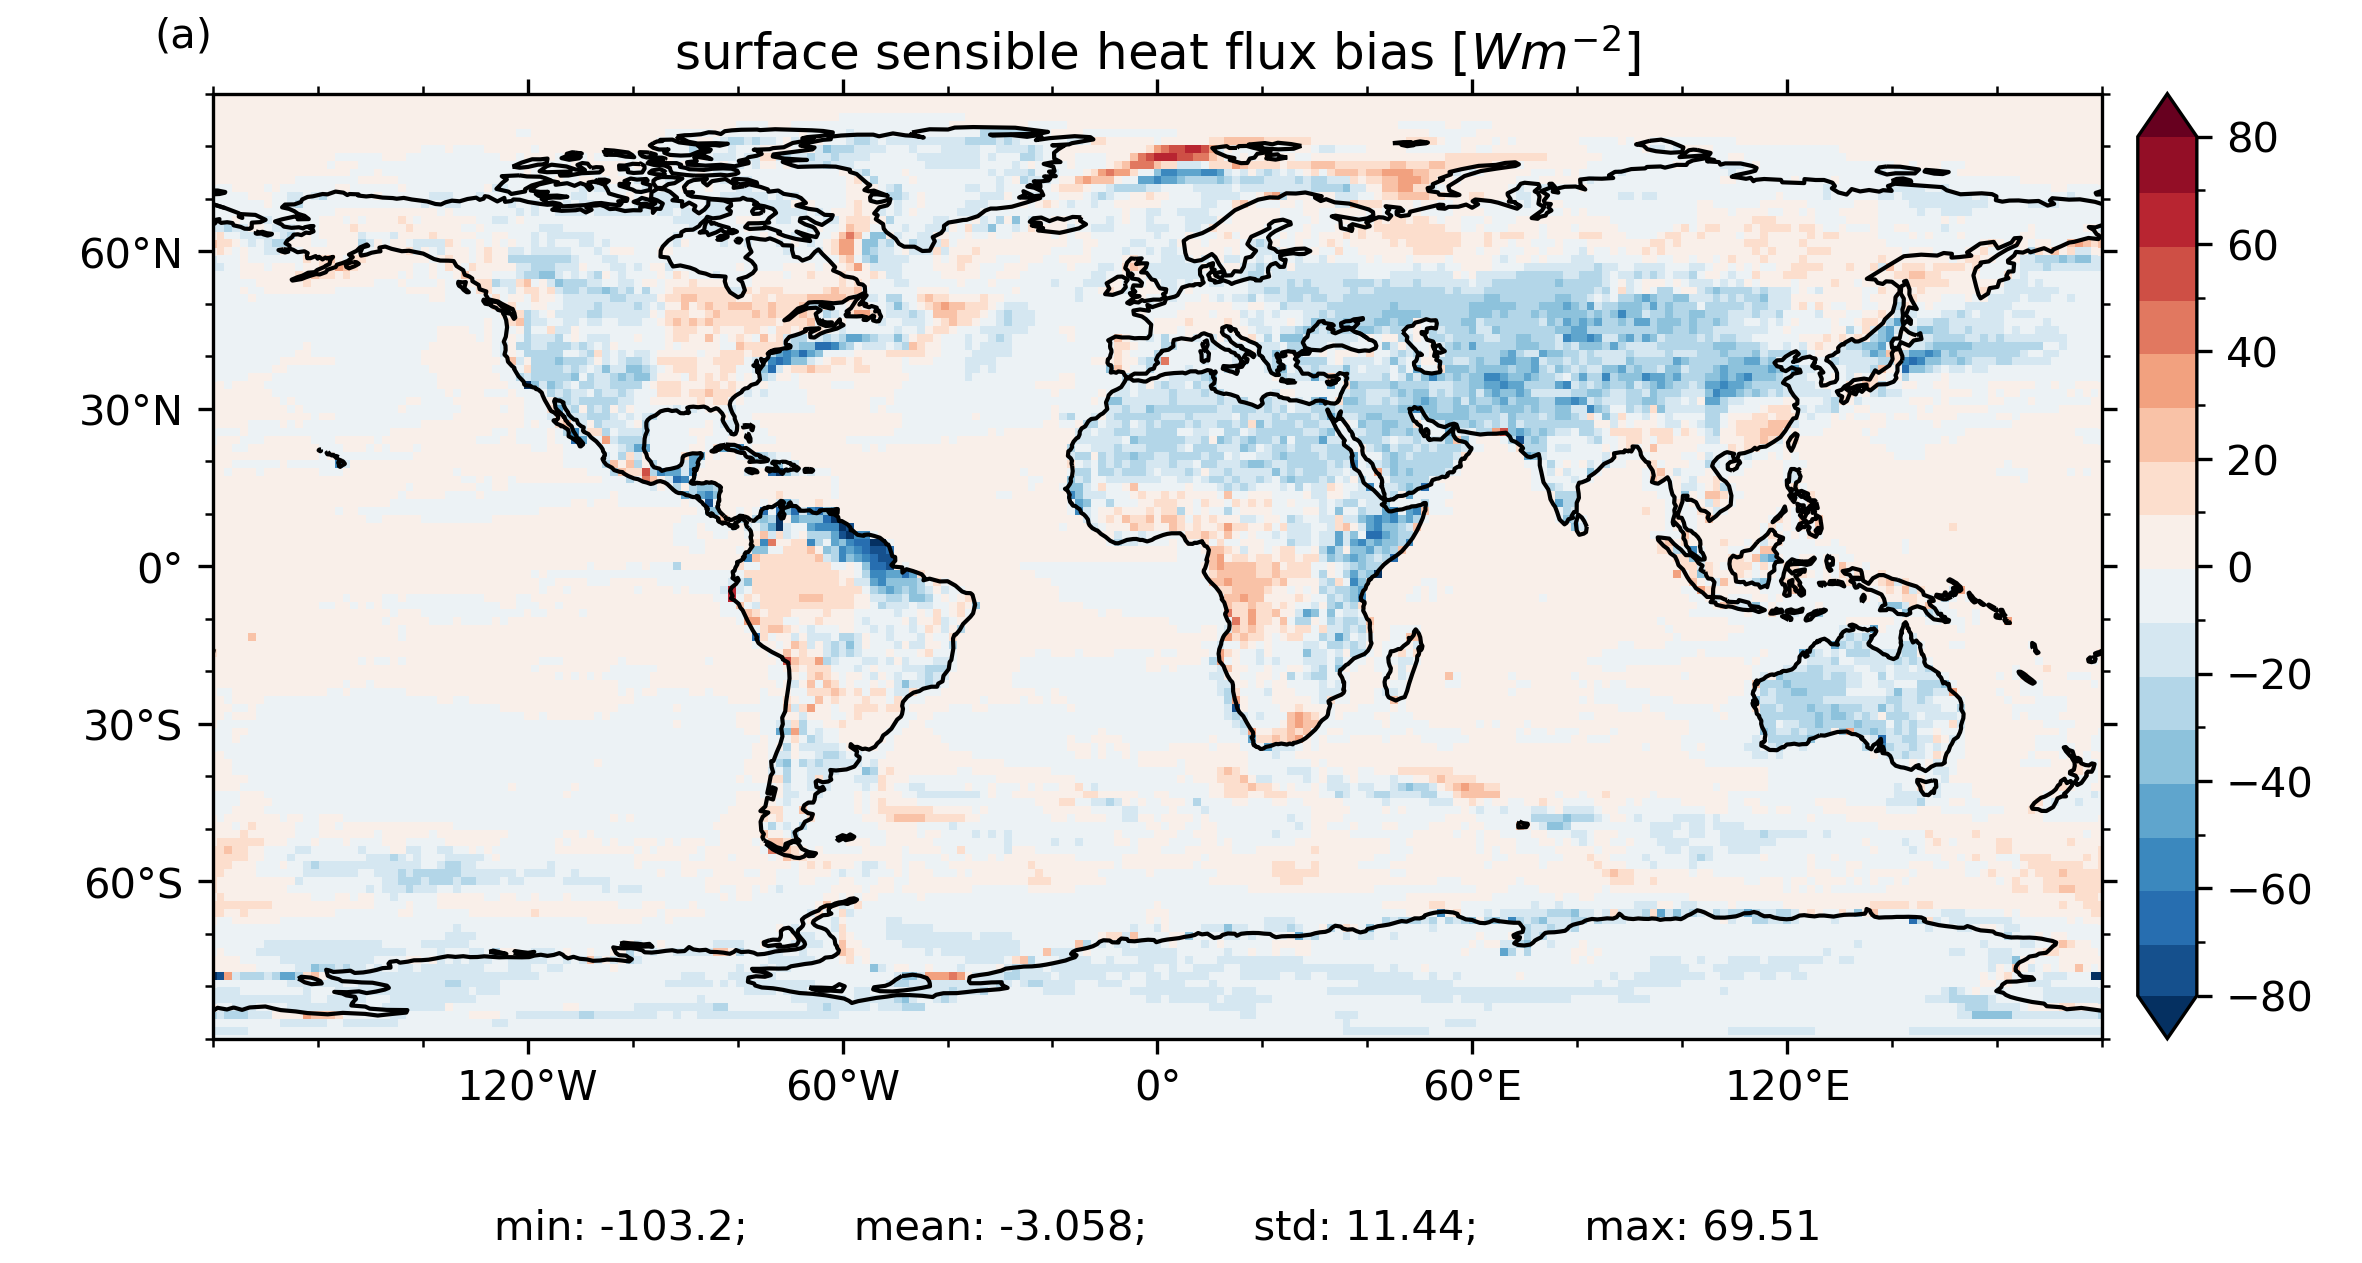
surface sensible heat flux bias
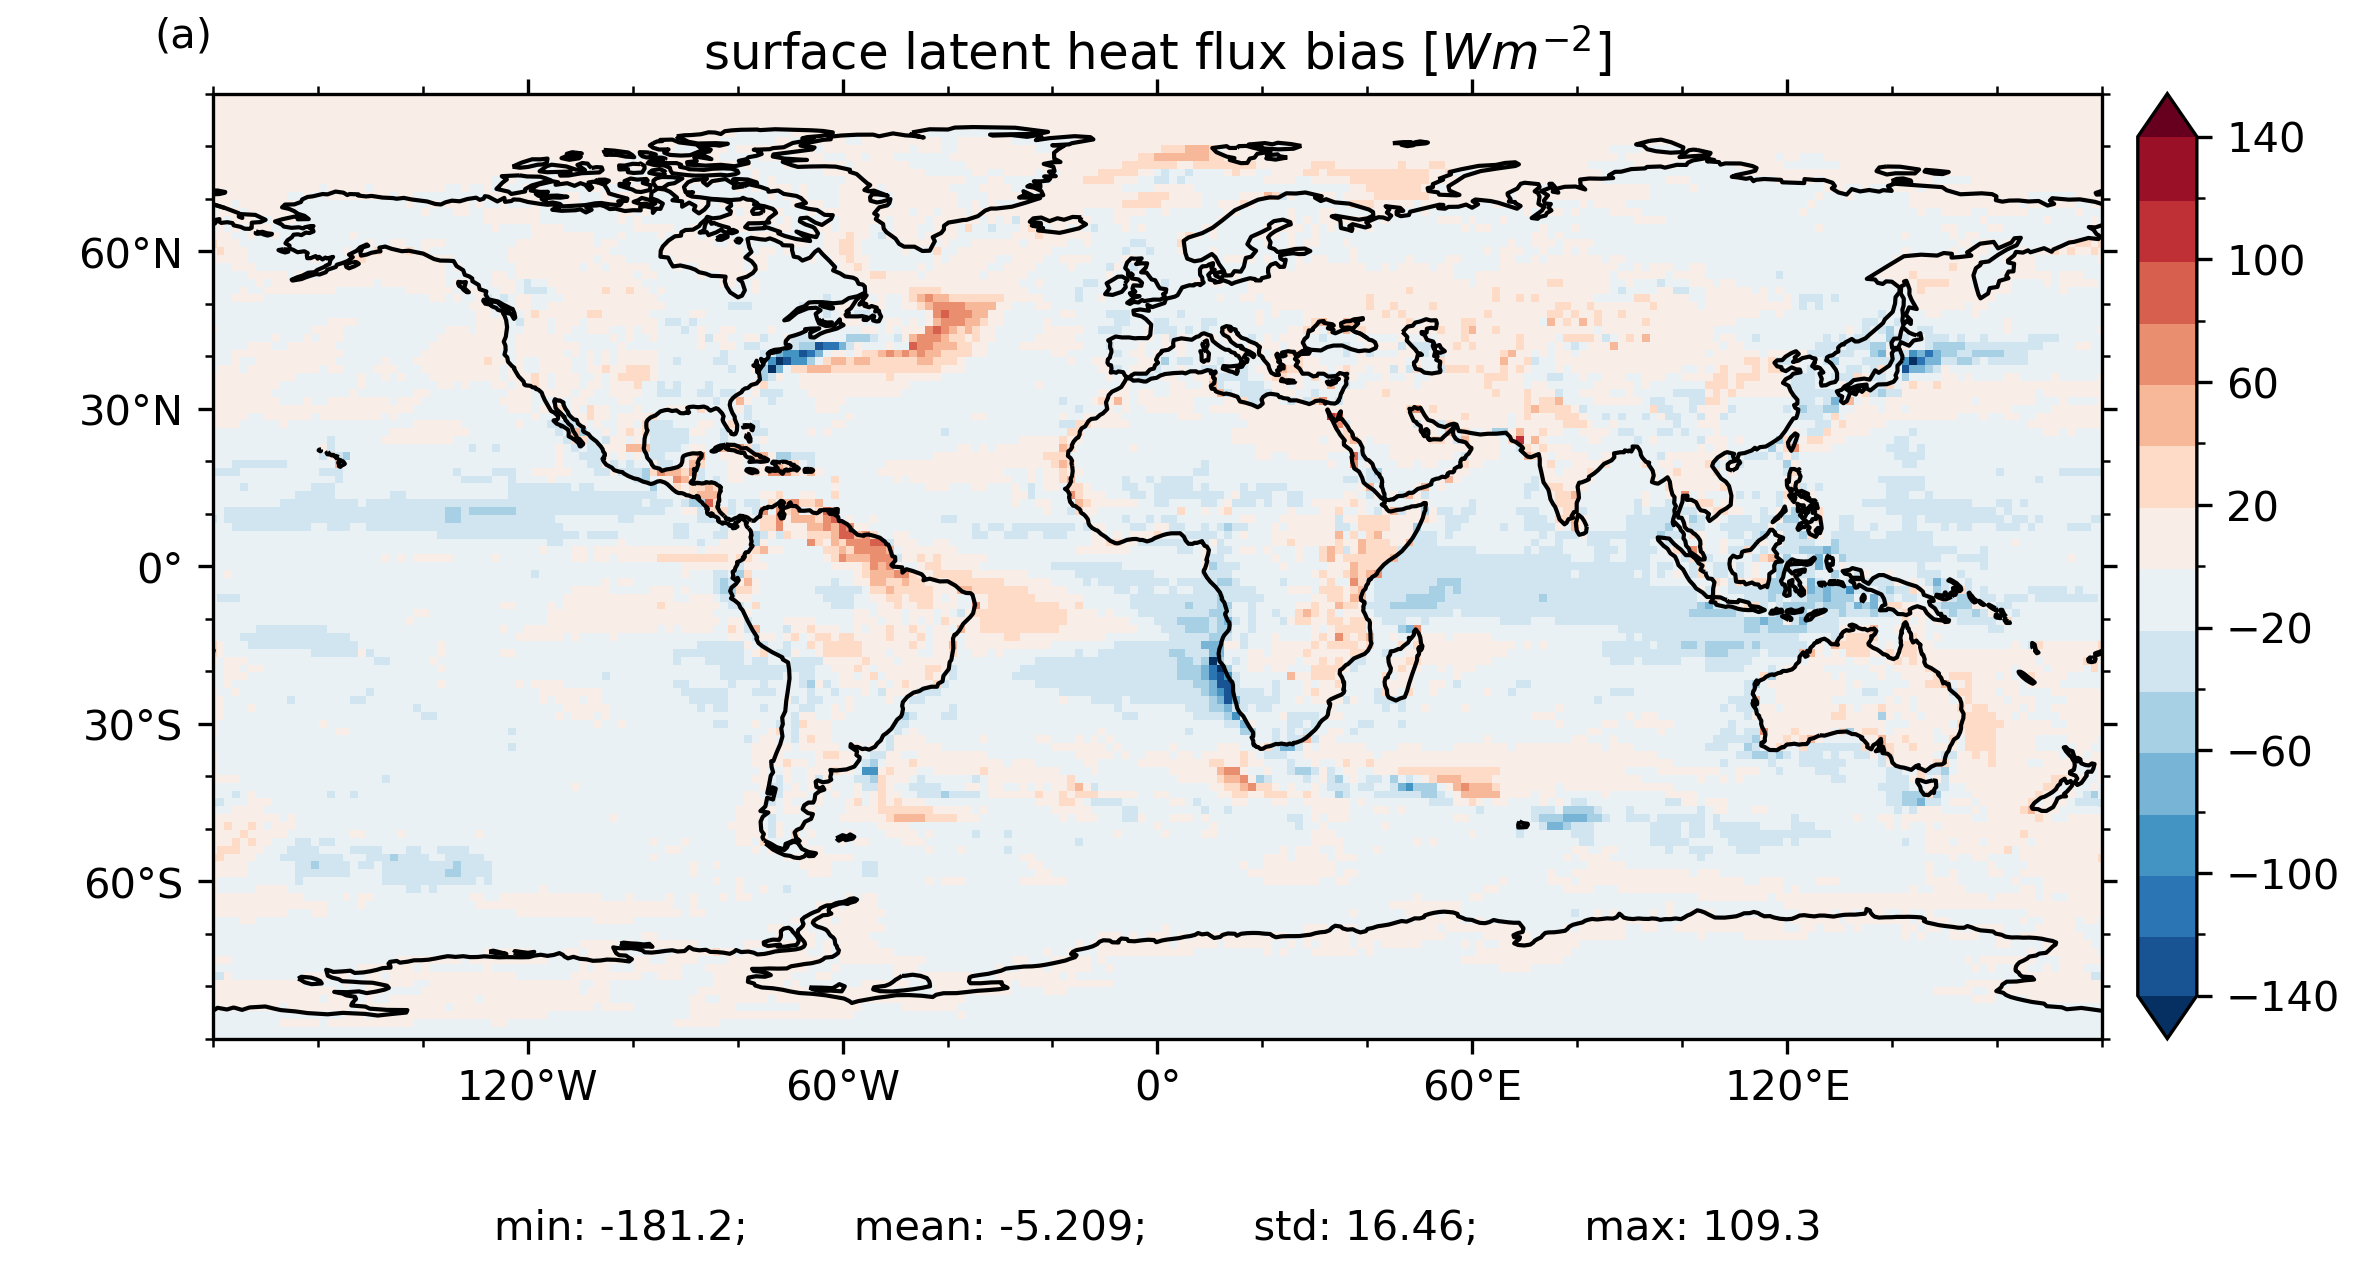
surface latent heat flux bias
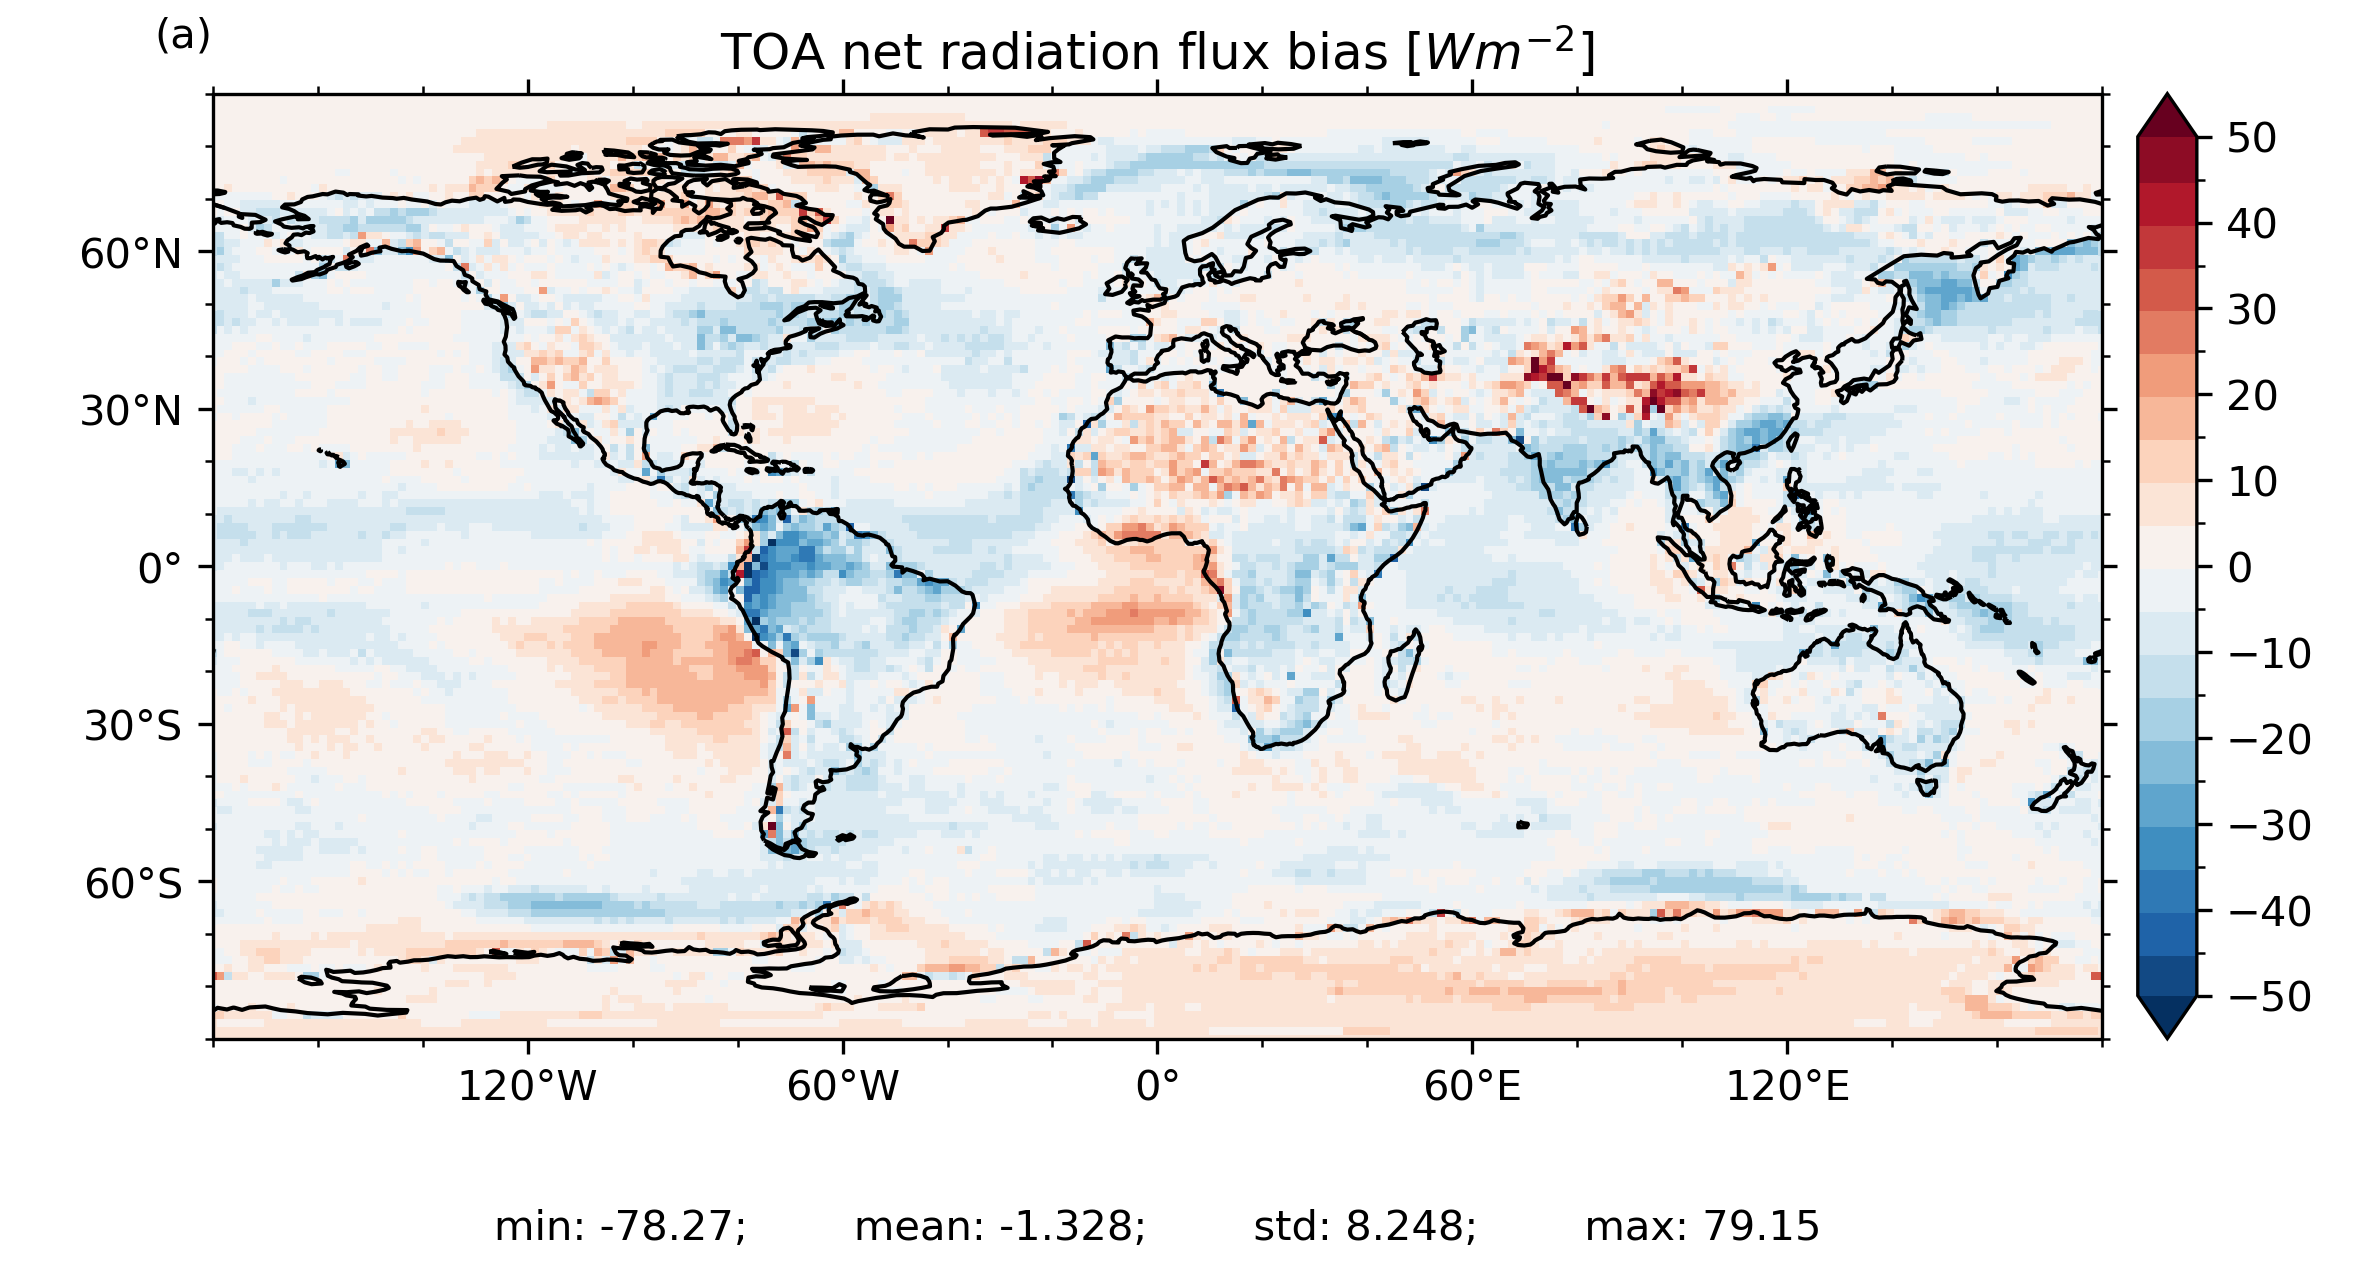
TOA net radiation flux bias
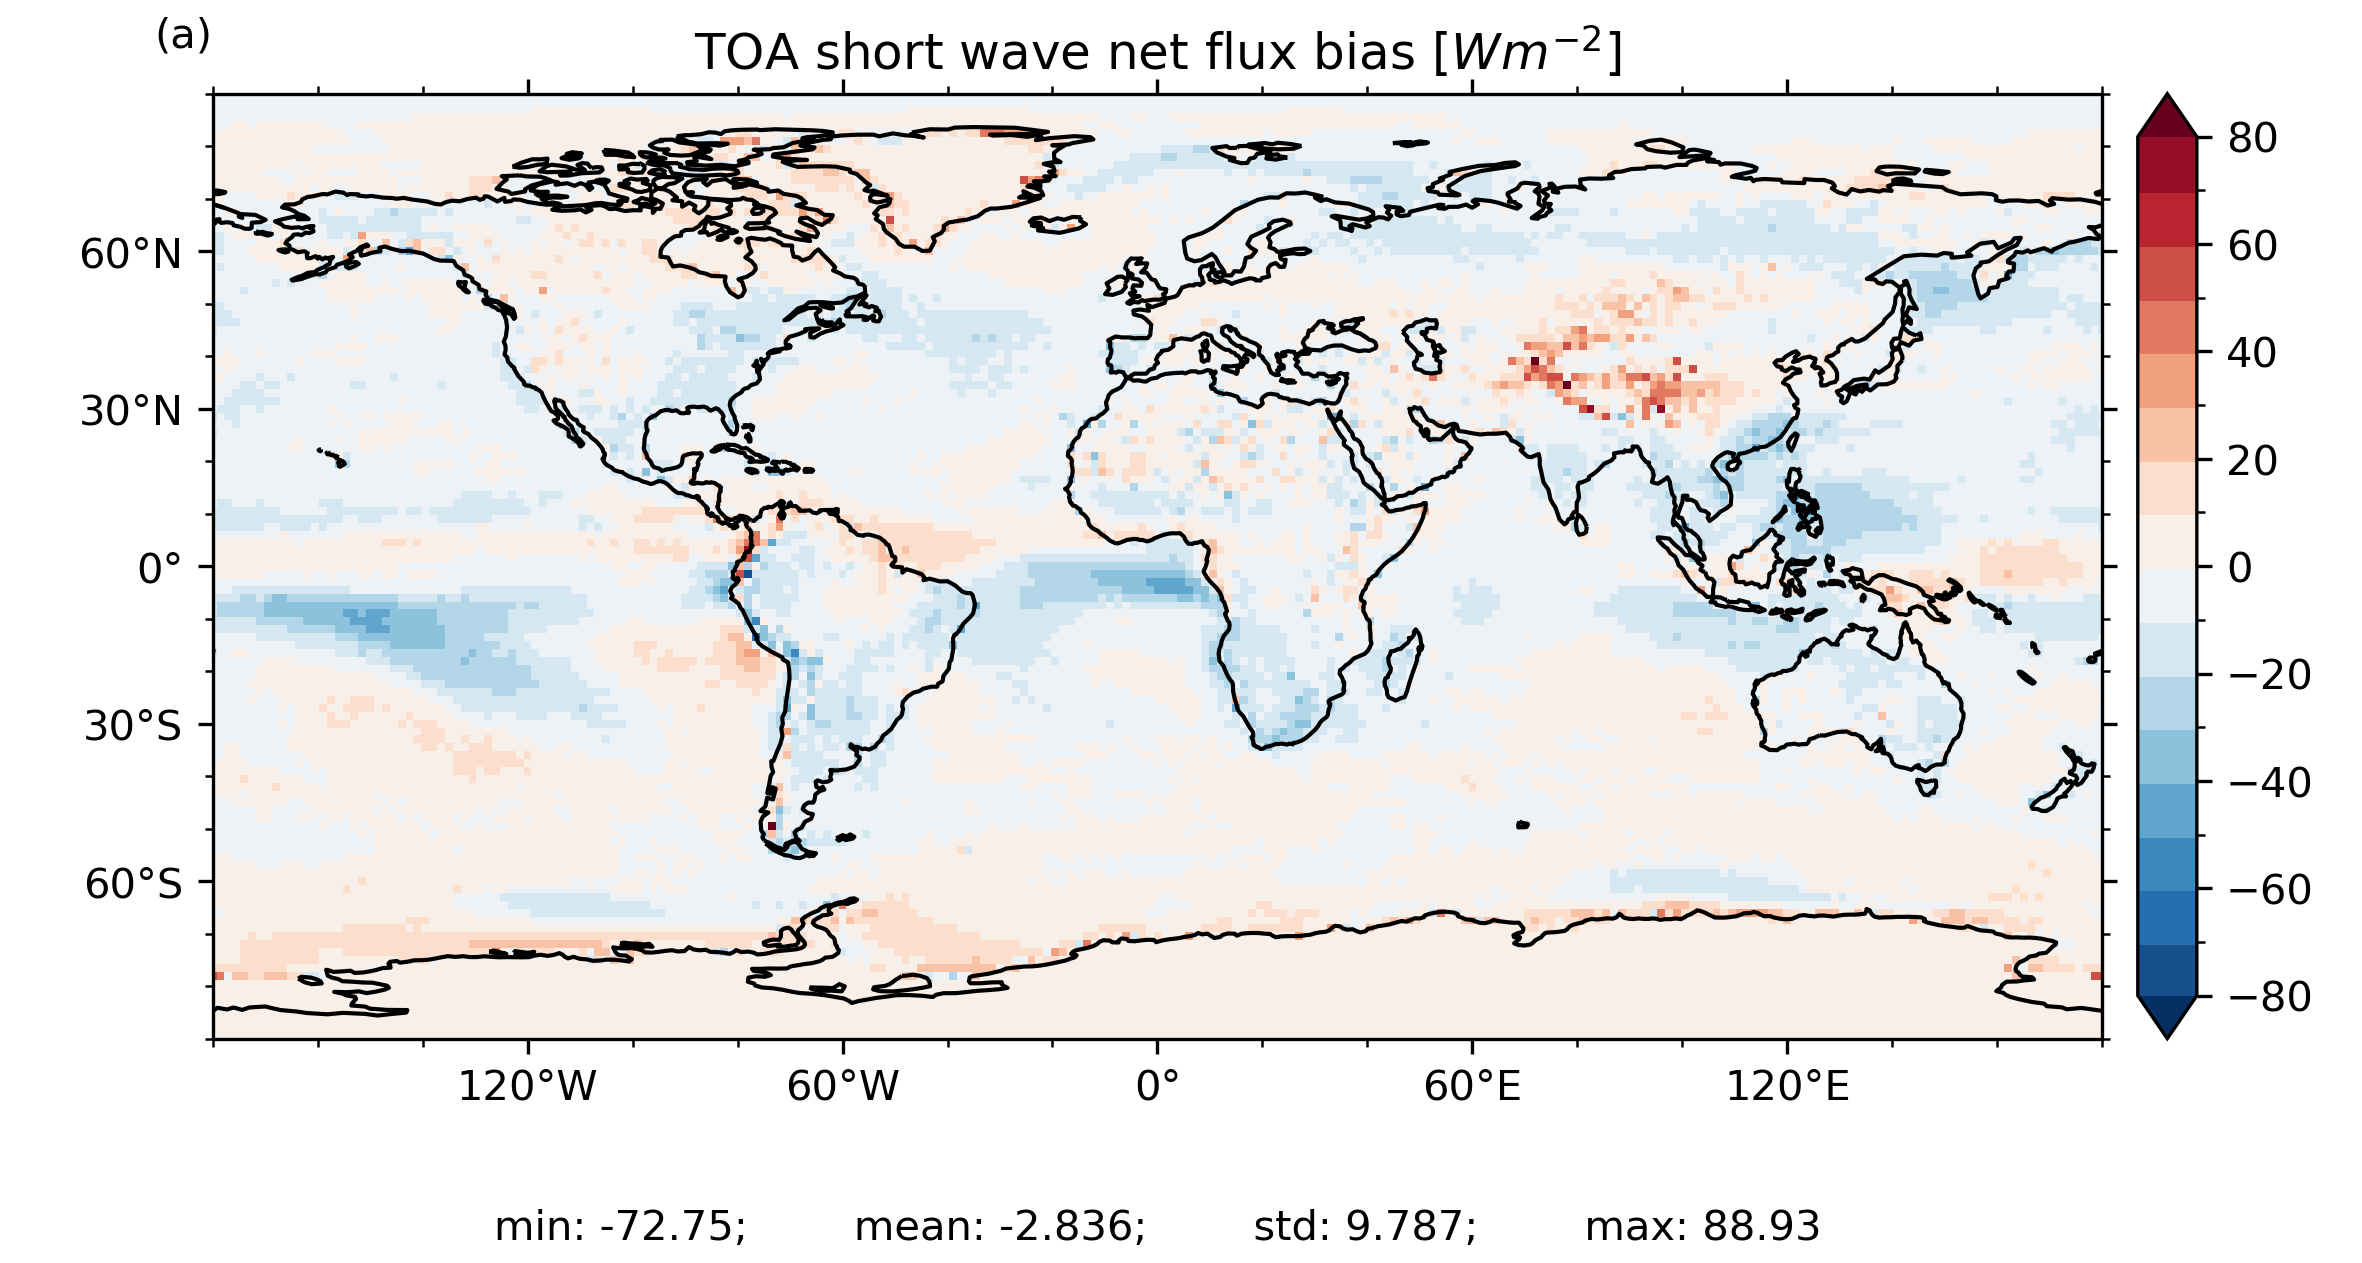
TOA short wave net flux bias
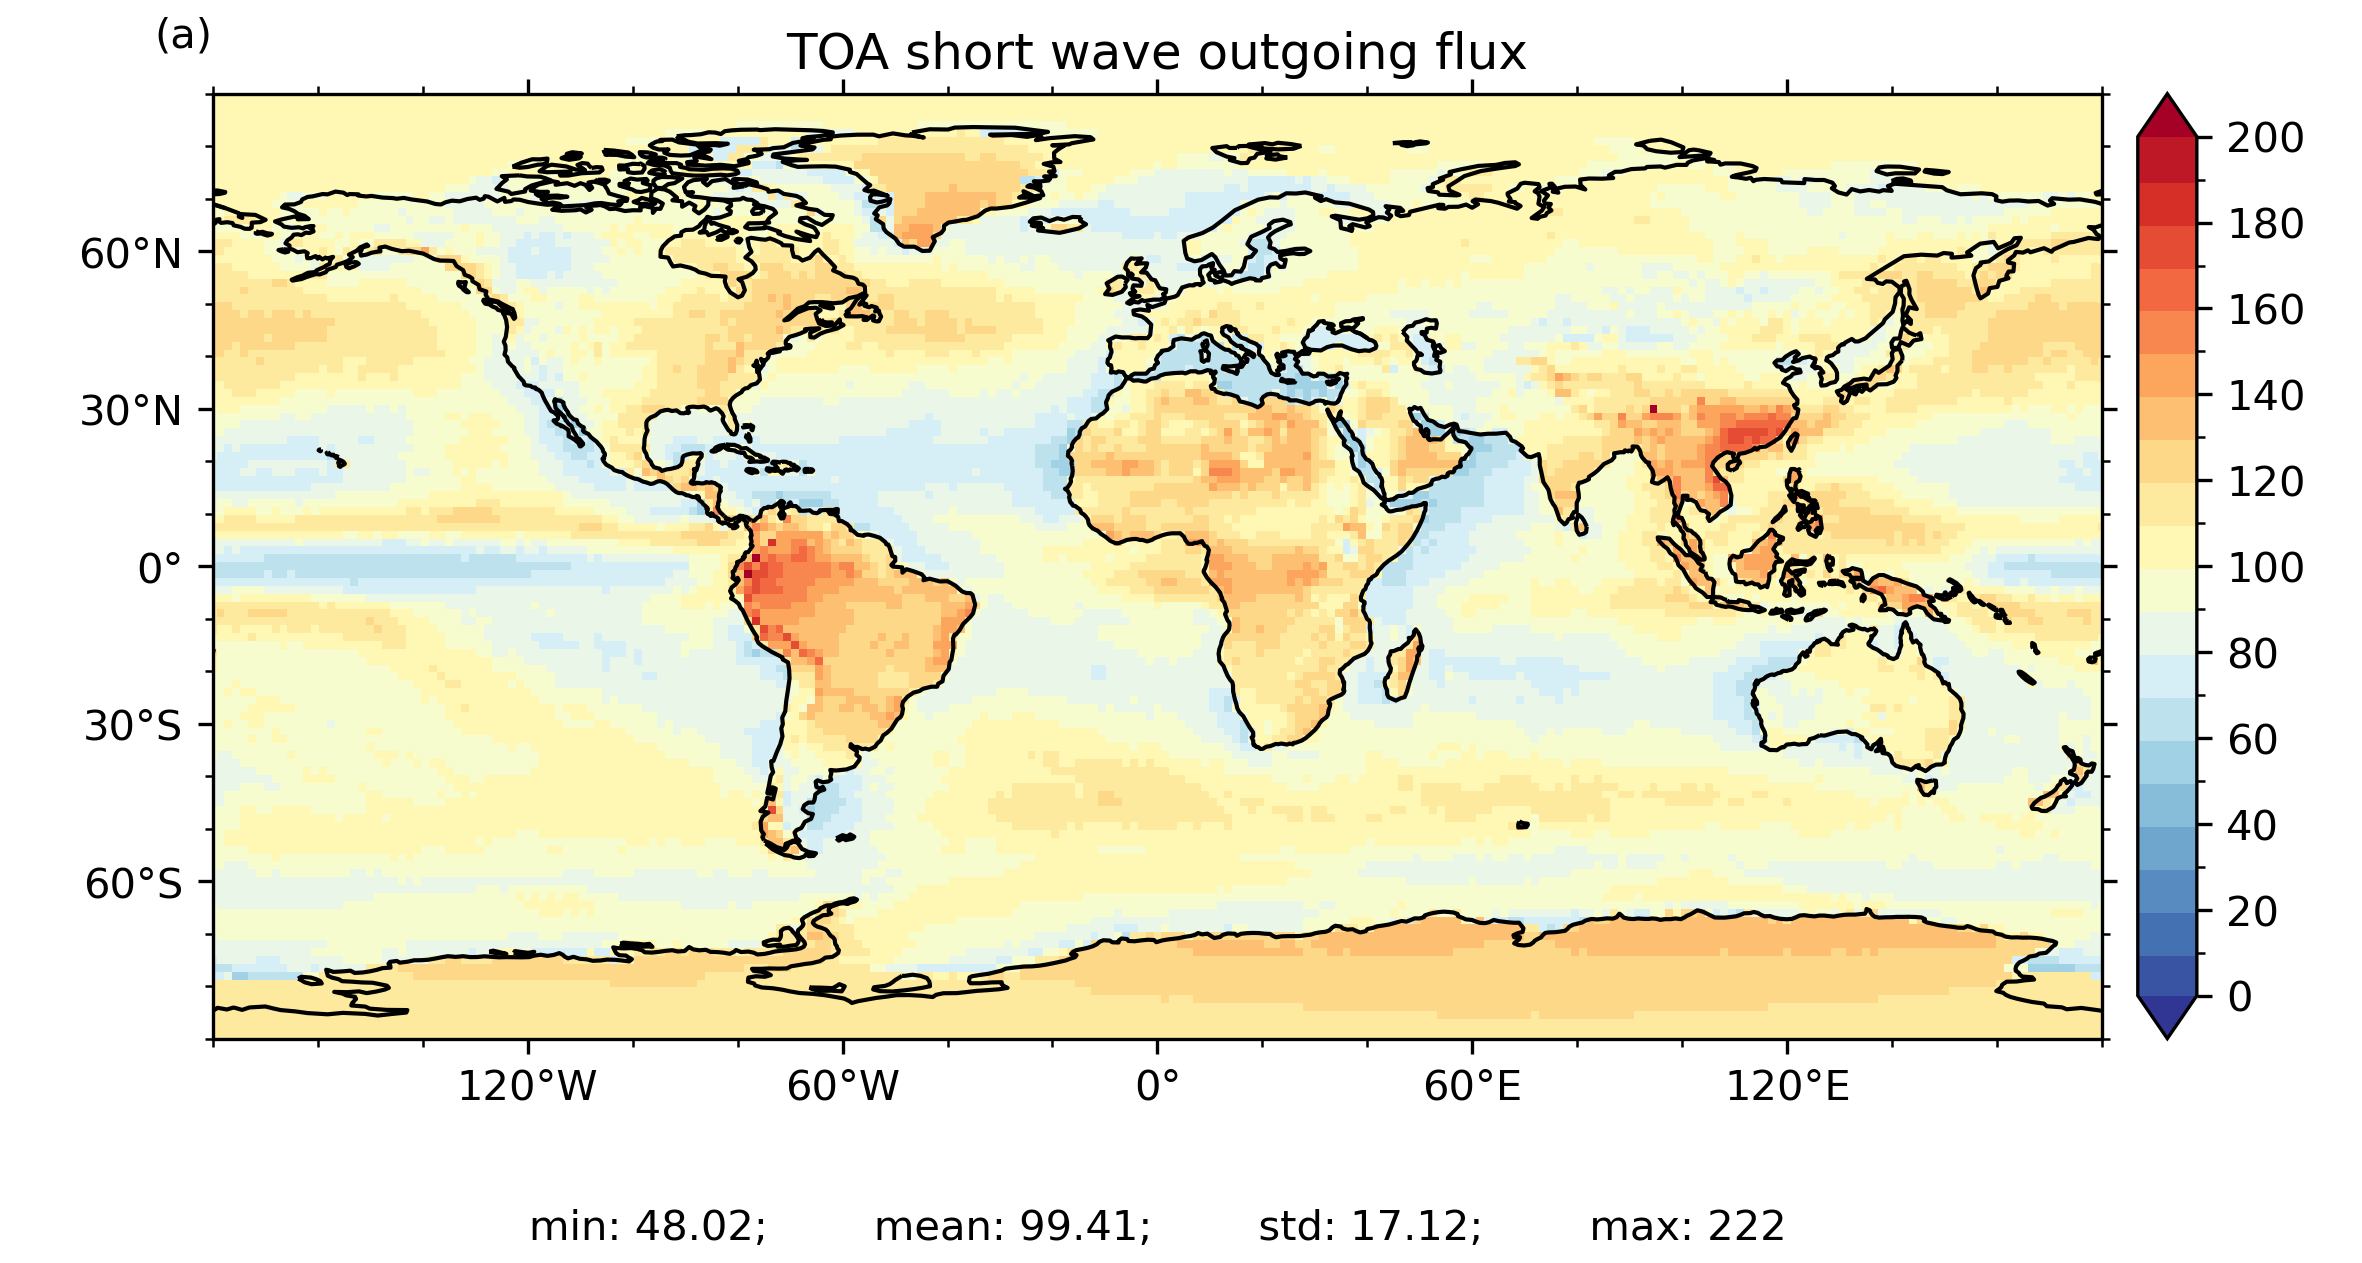
TOA short wave outgoing flux
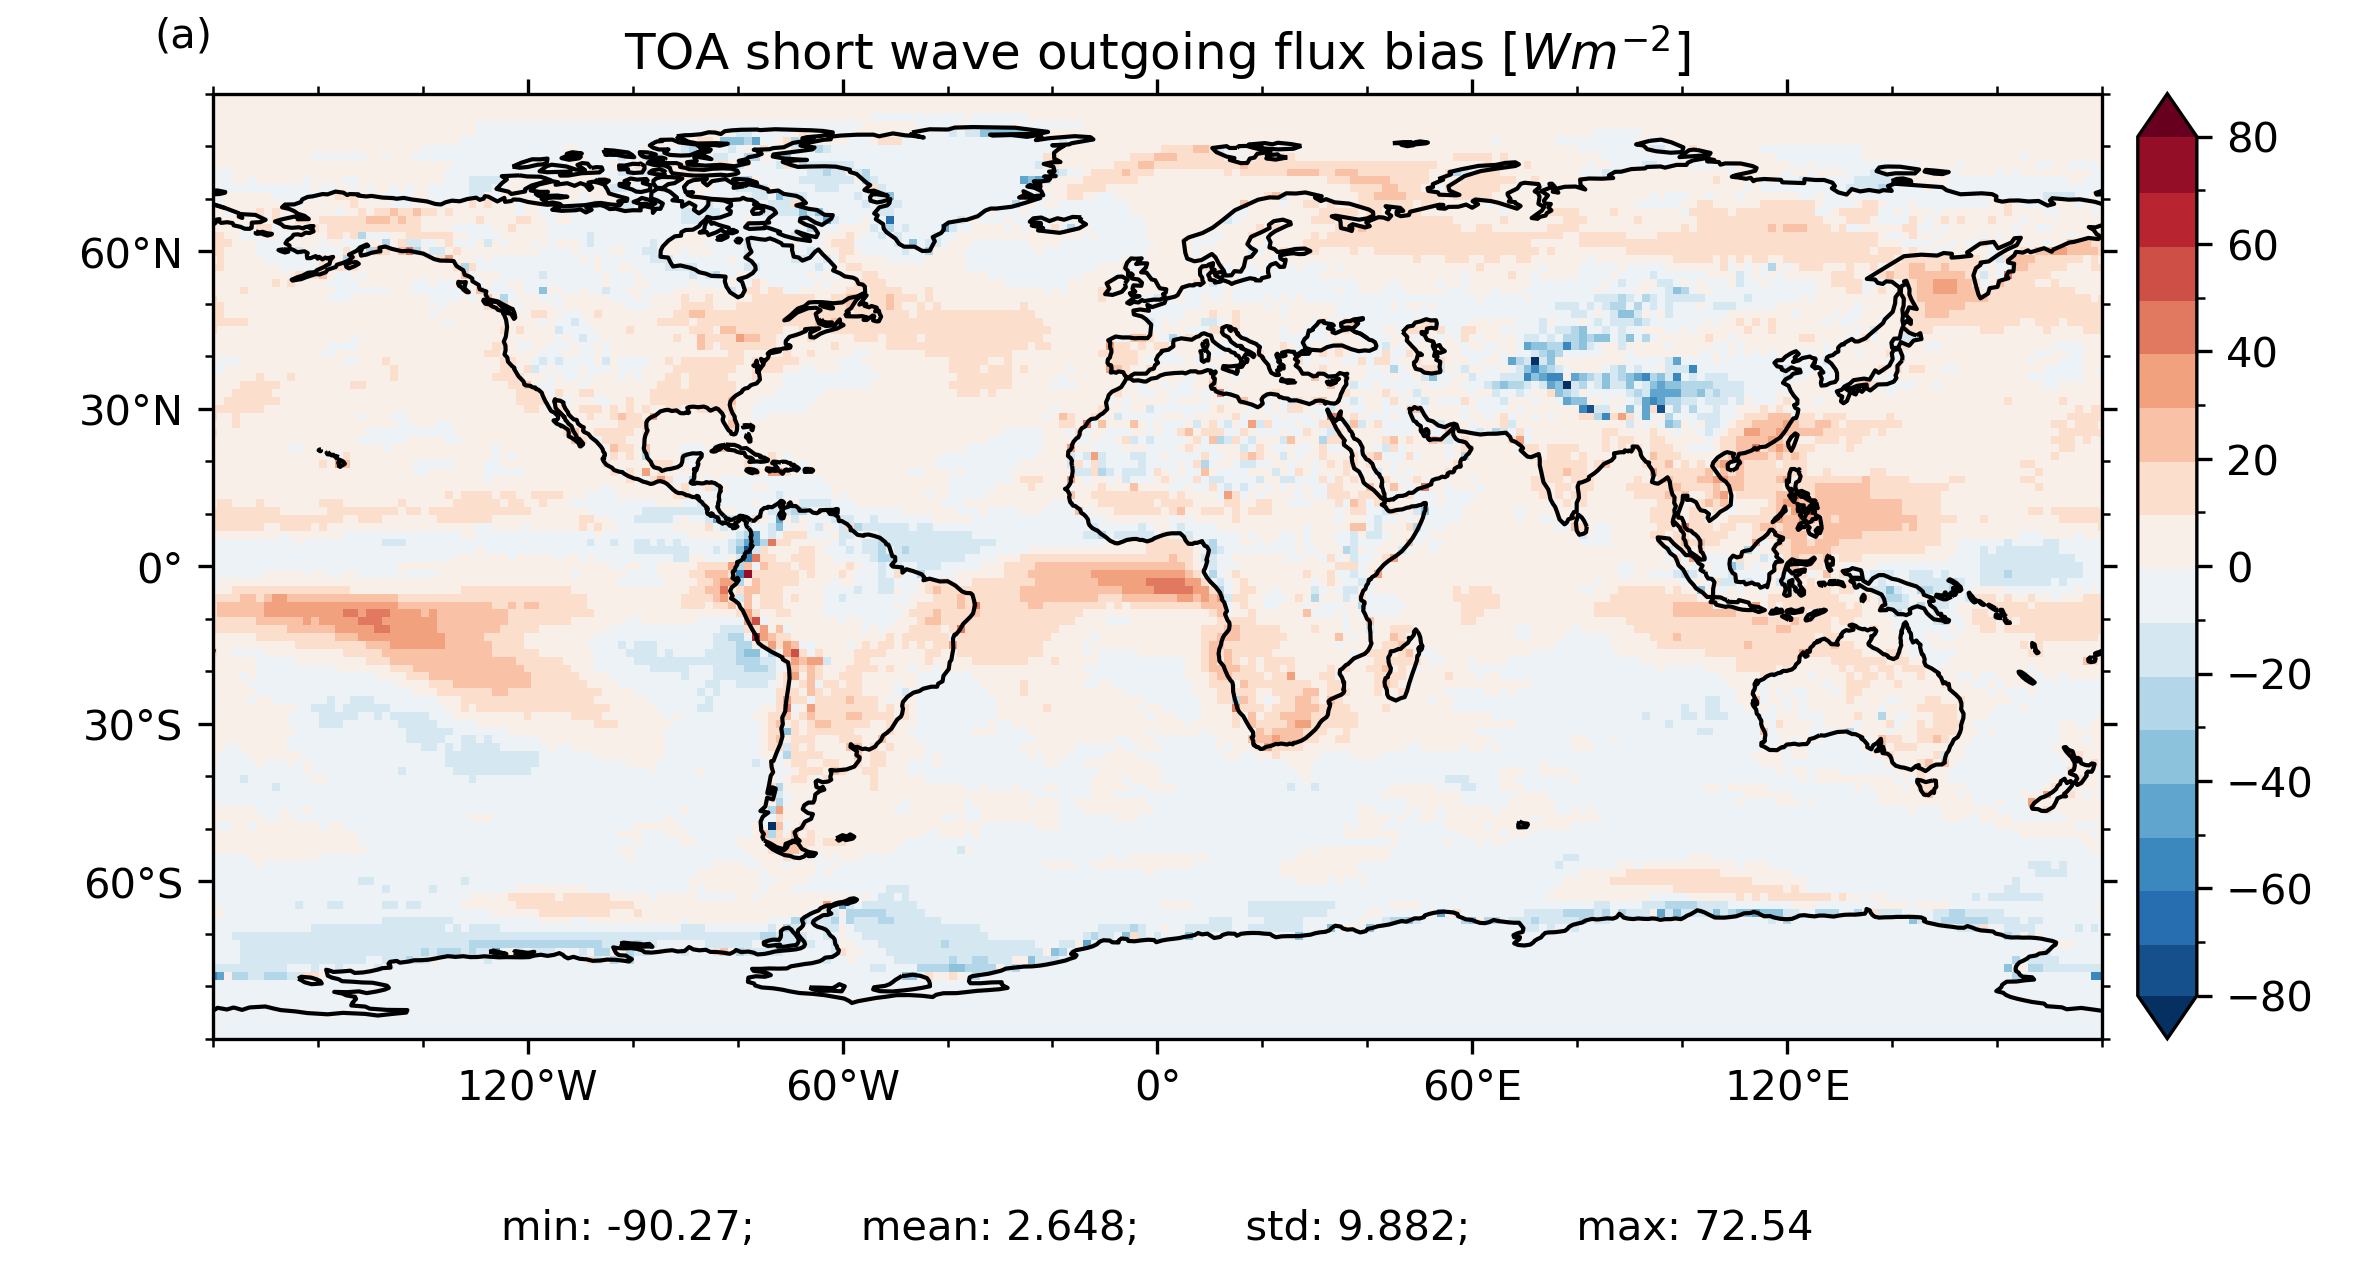
TOA short wave outgoing flux bias
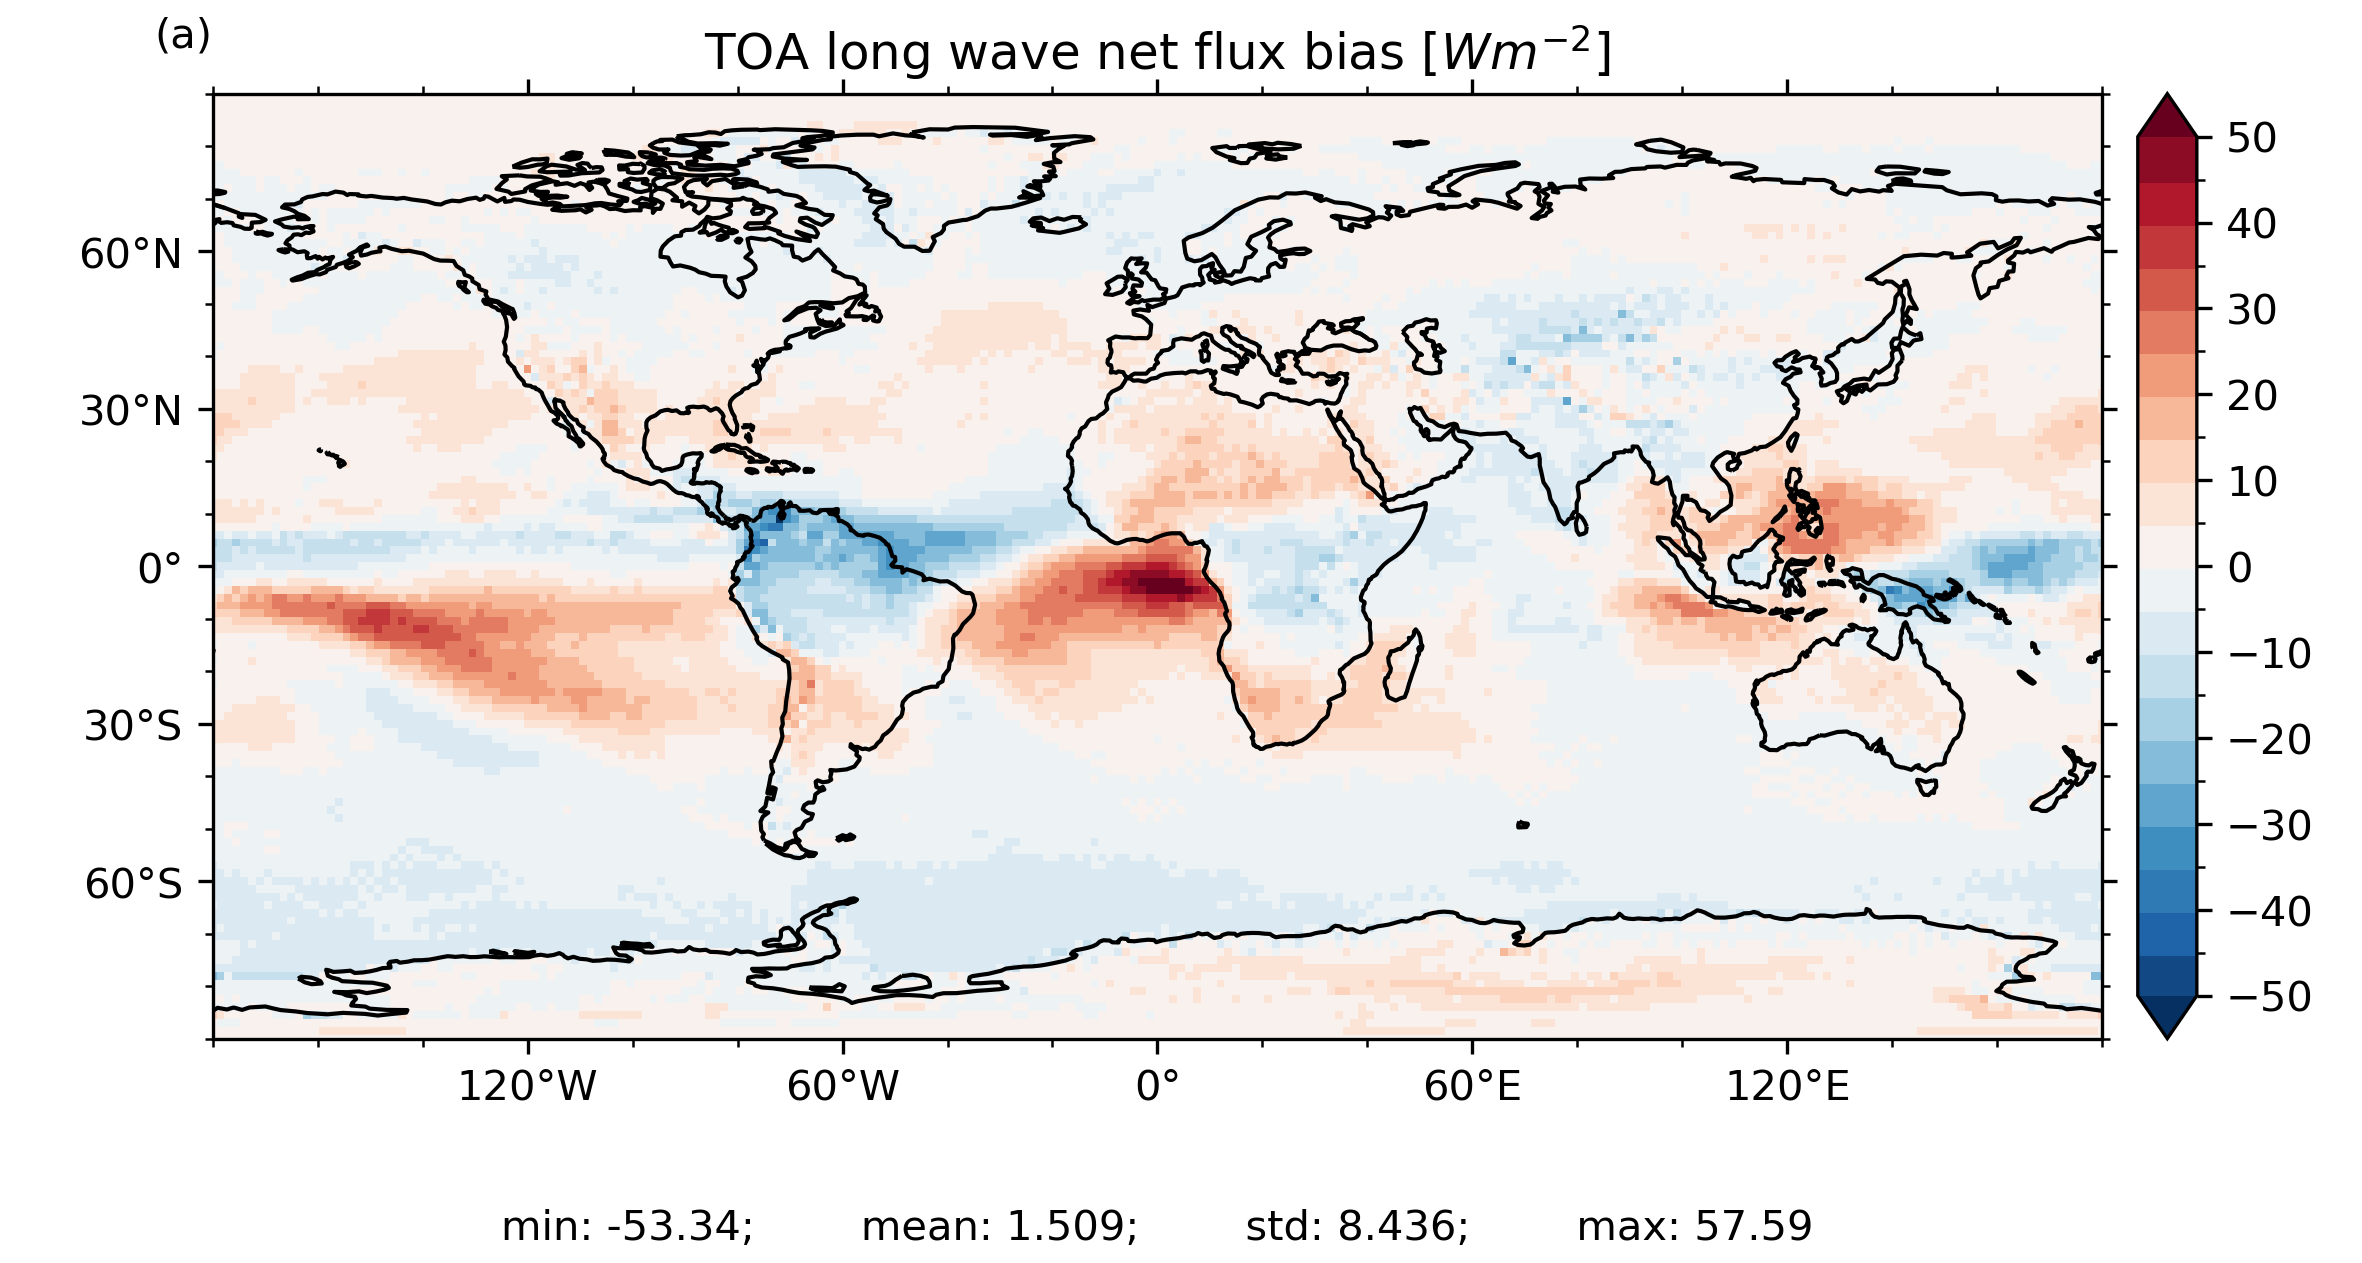
TOA long wave net flux bias
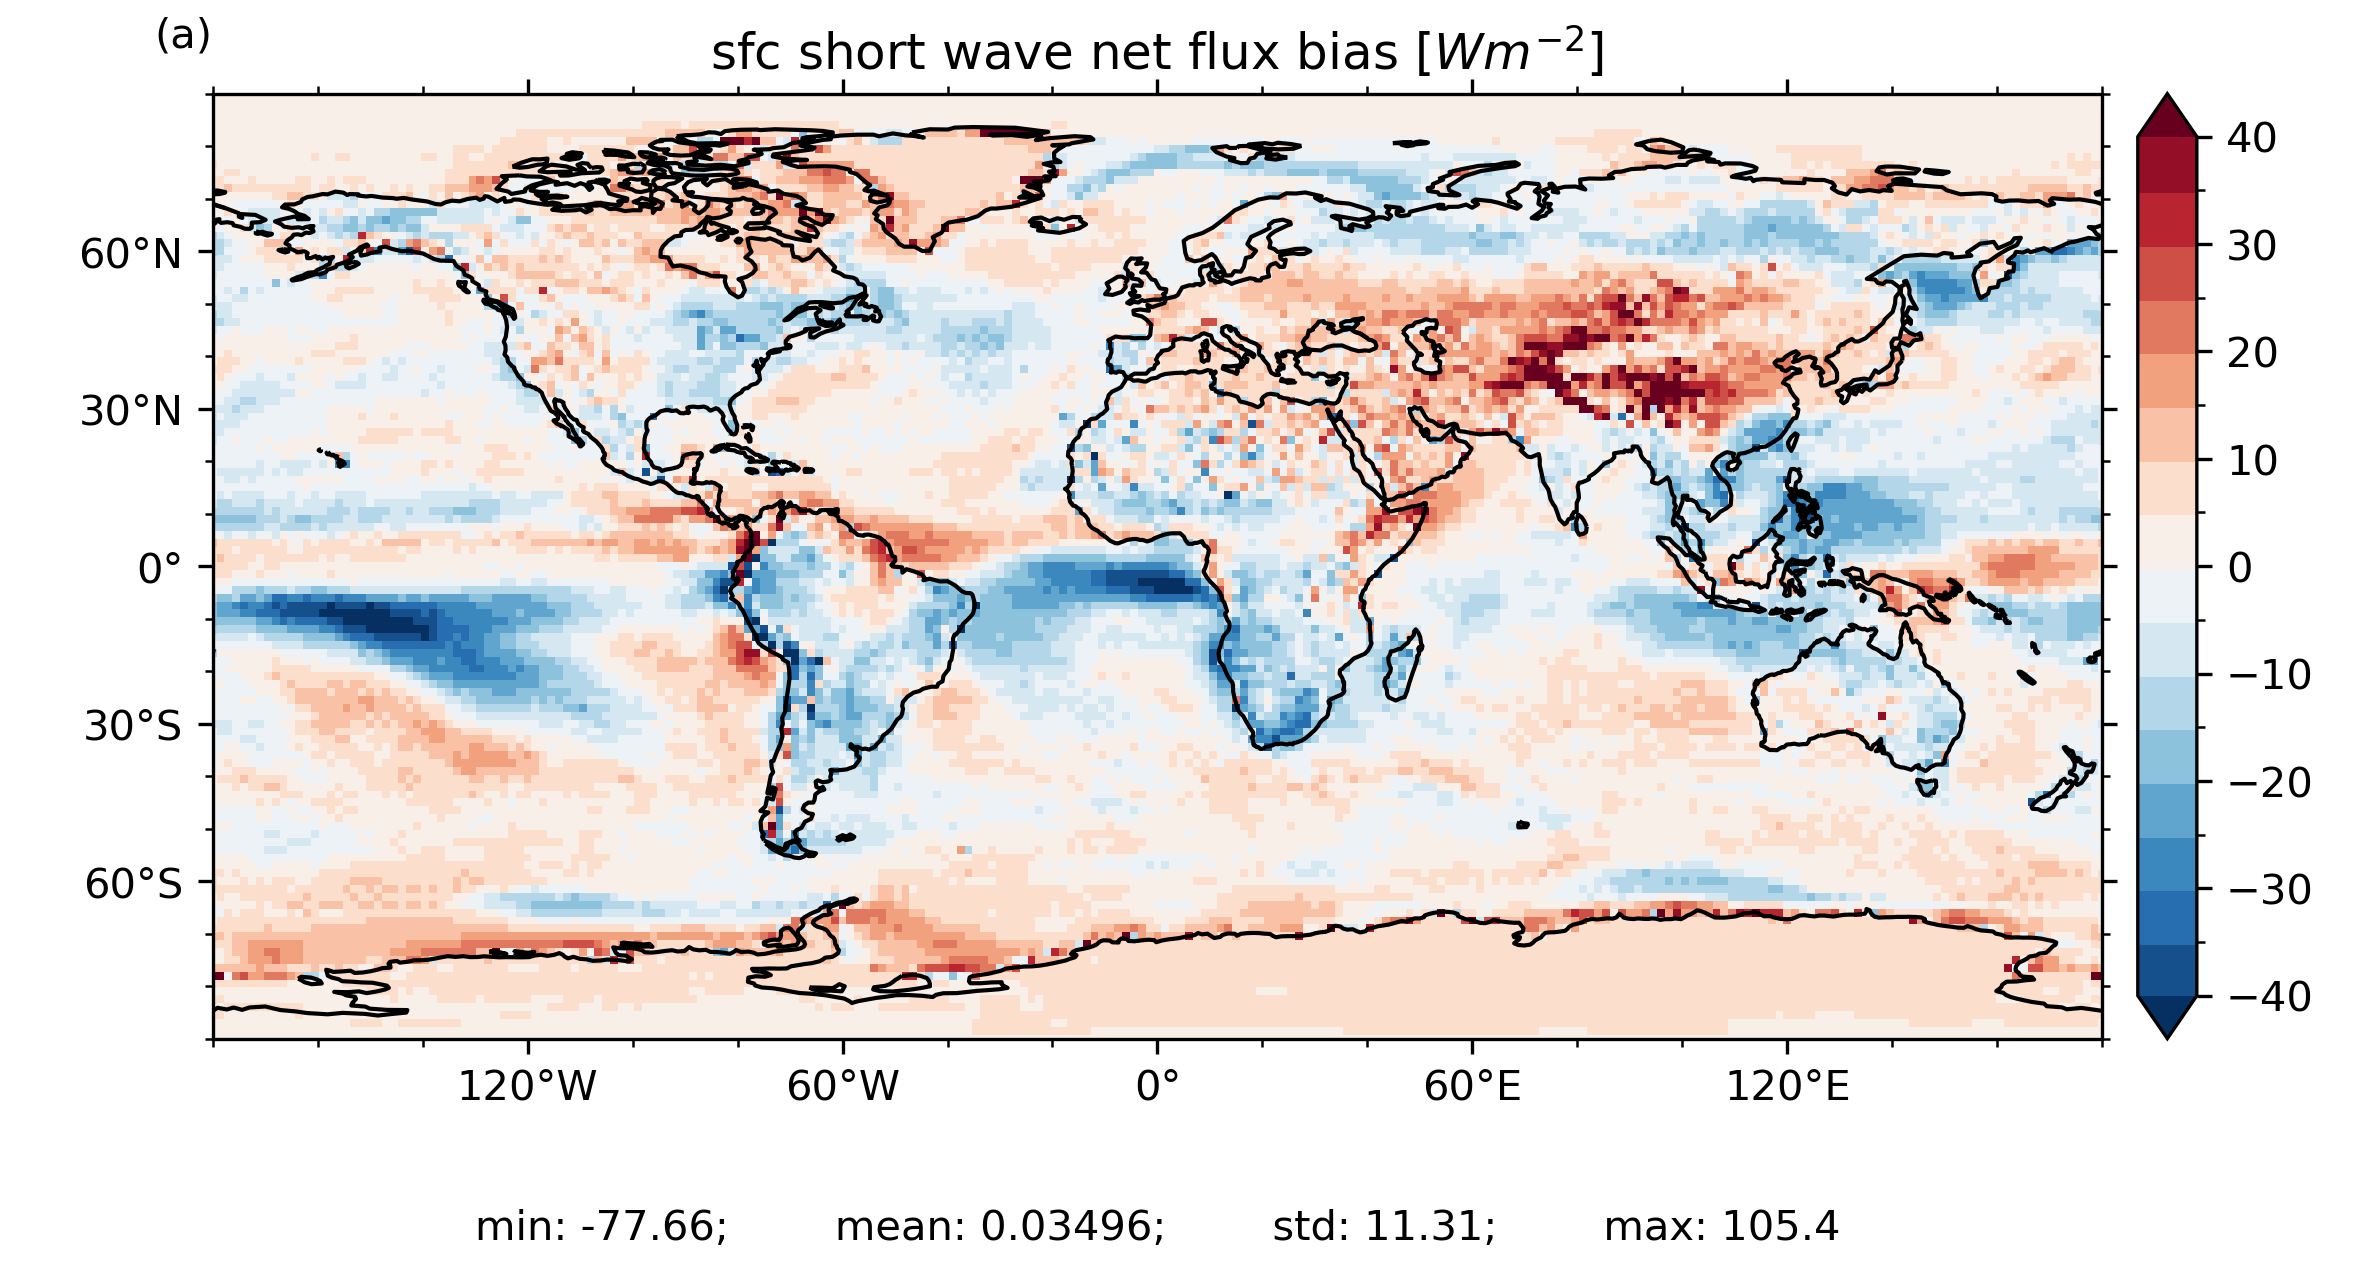
sfc short wave net flux bias
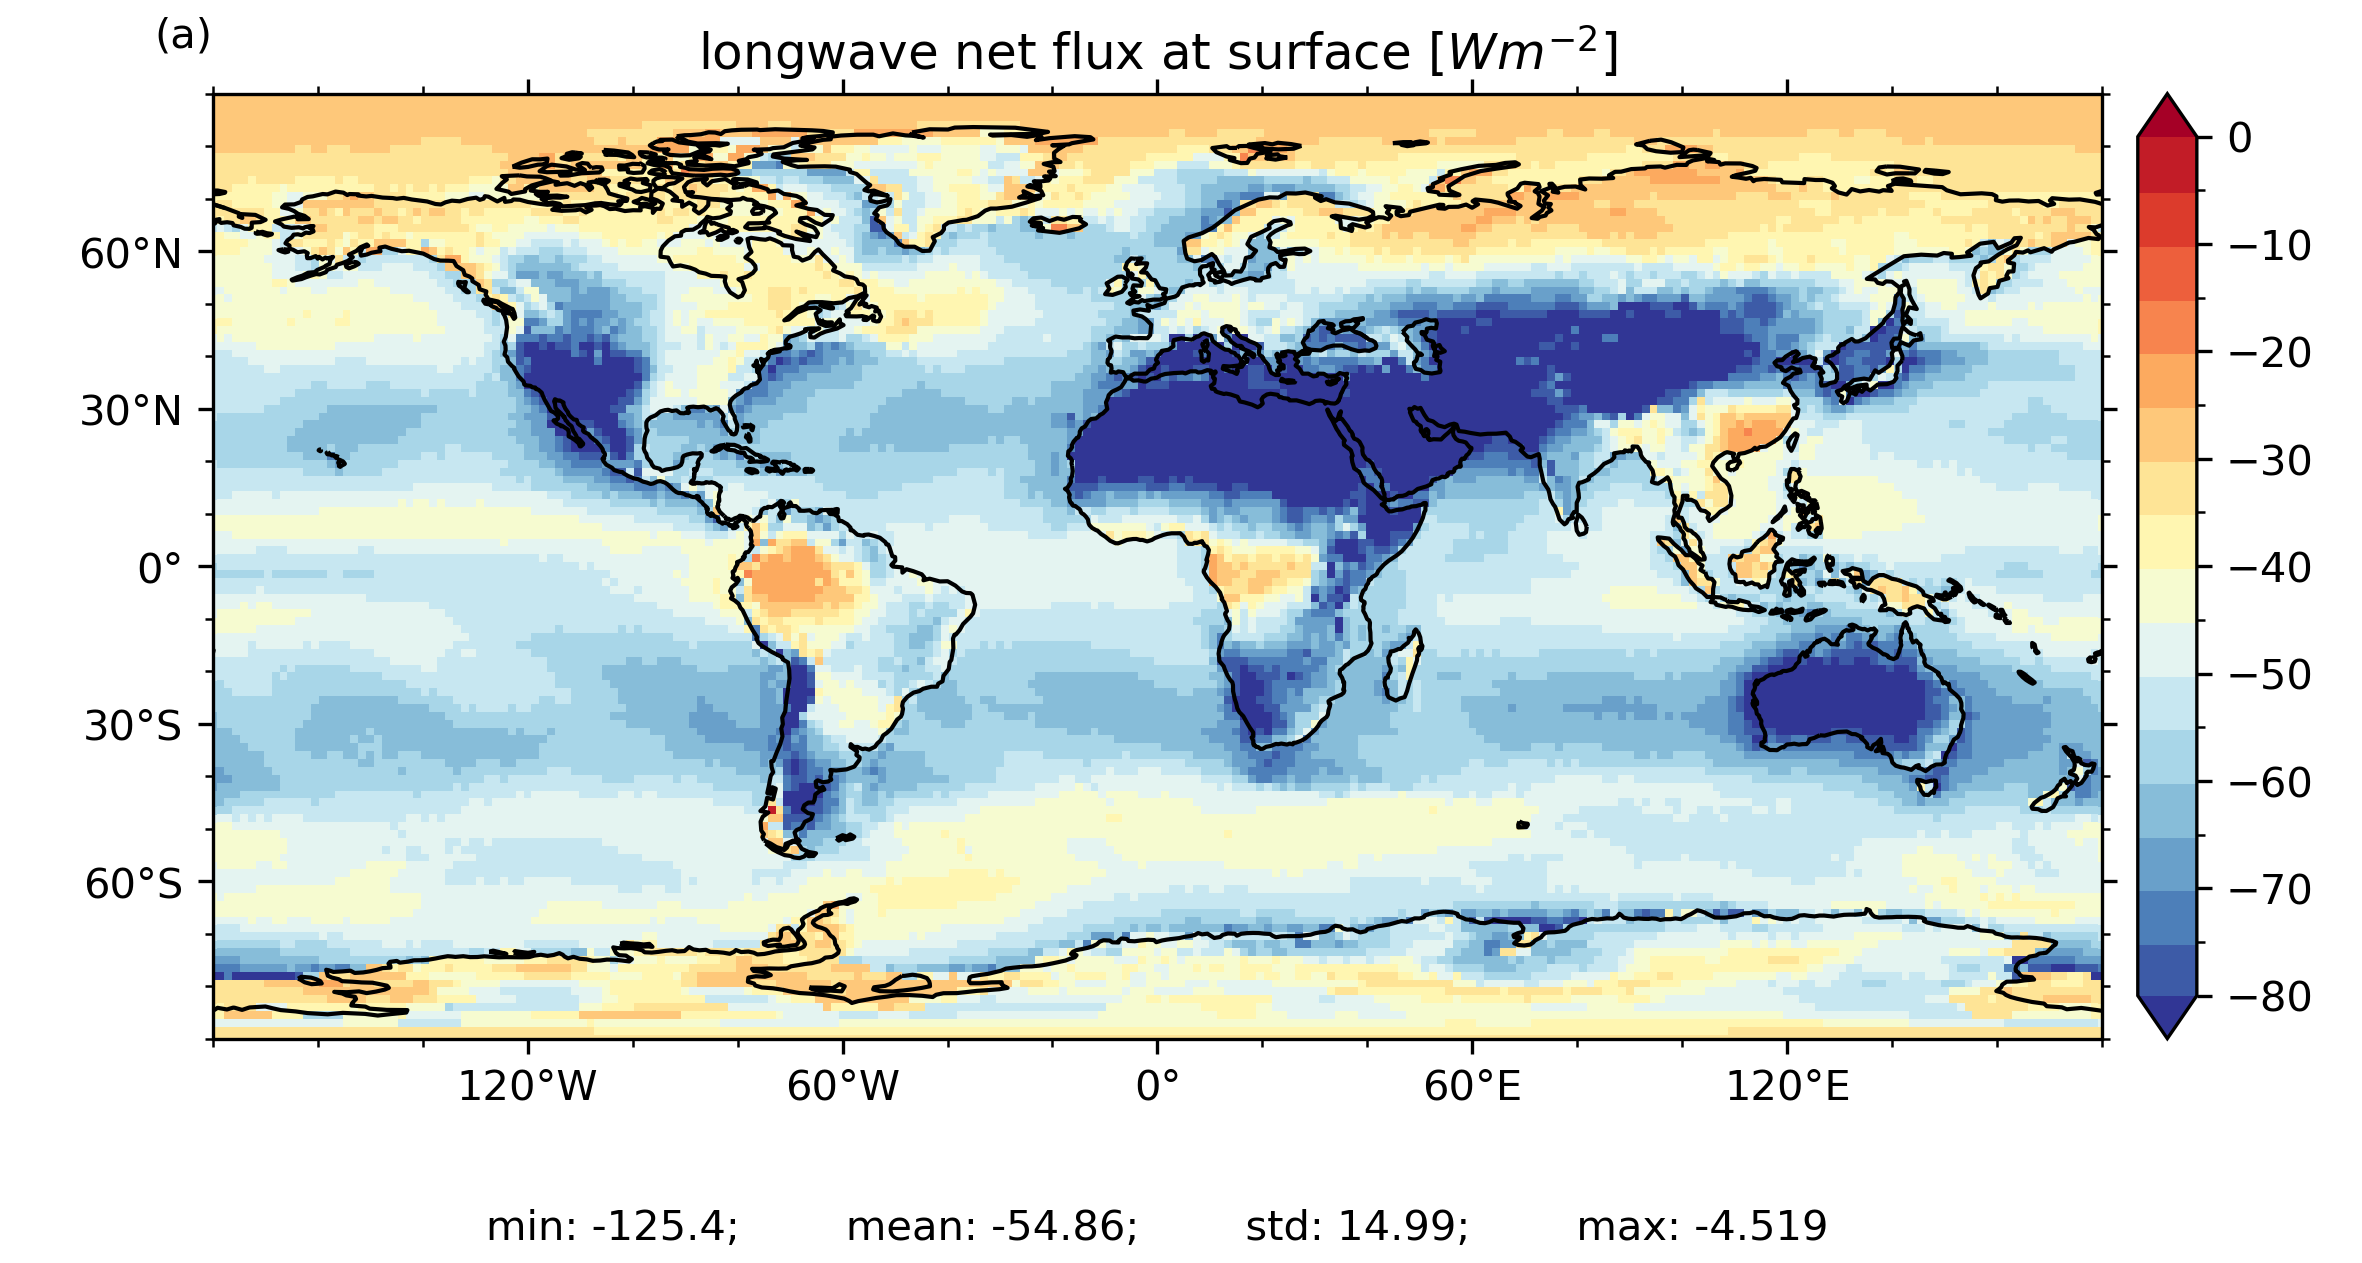
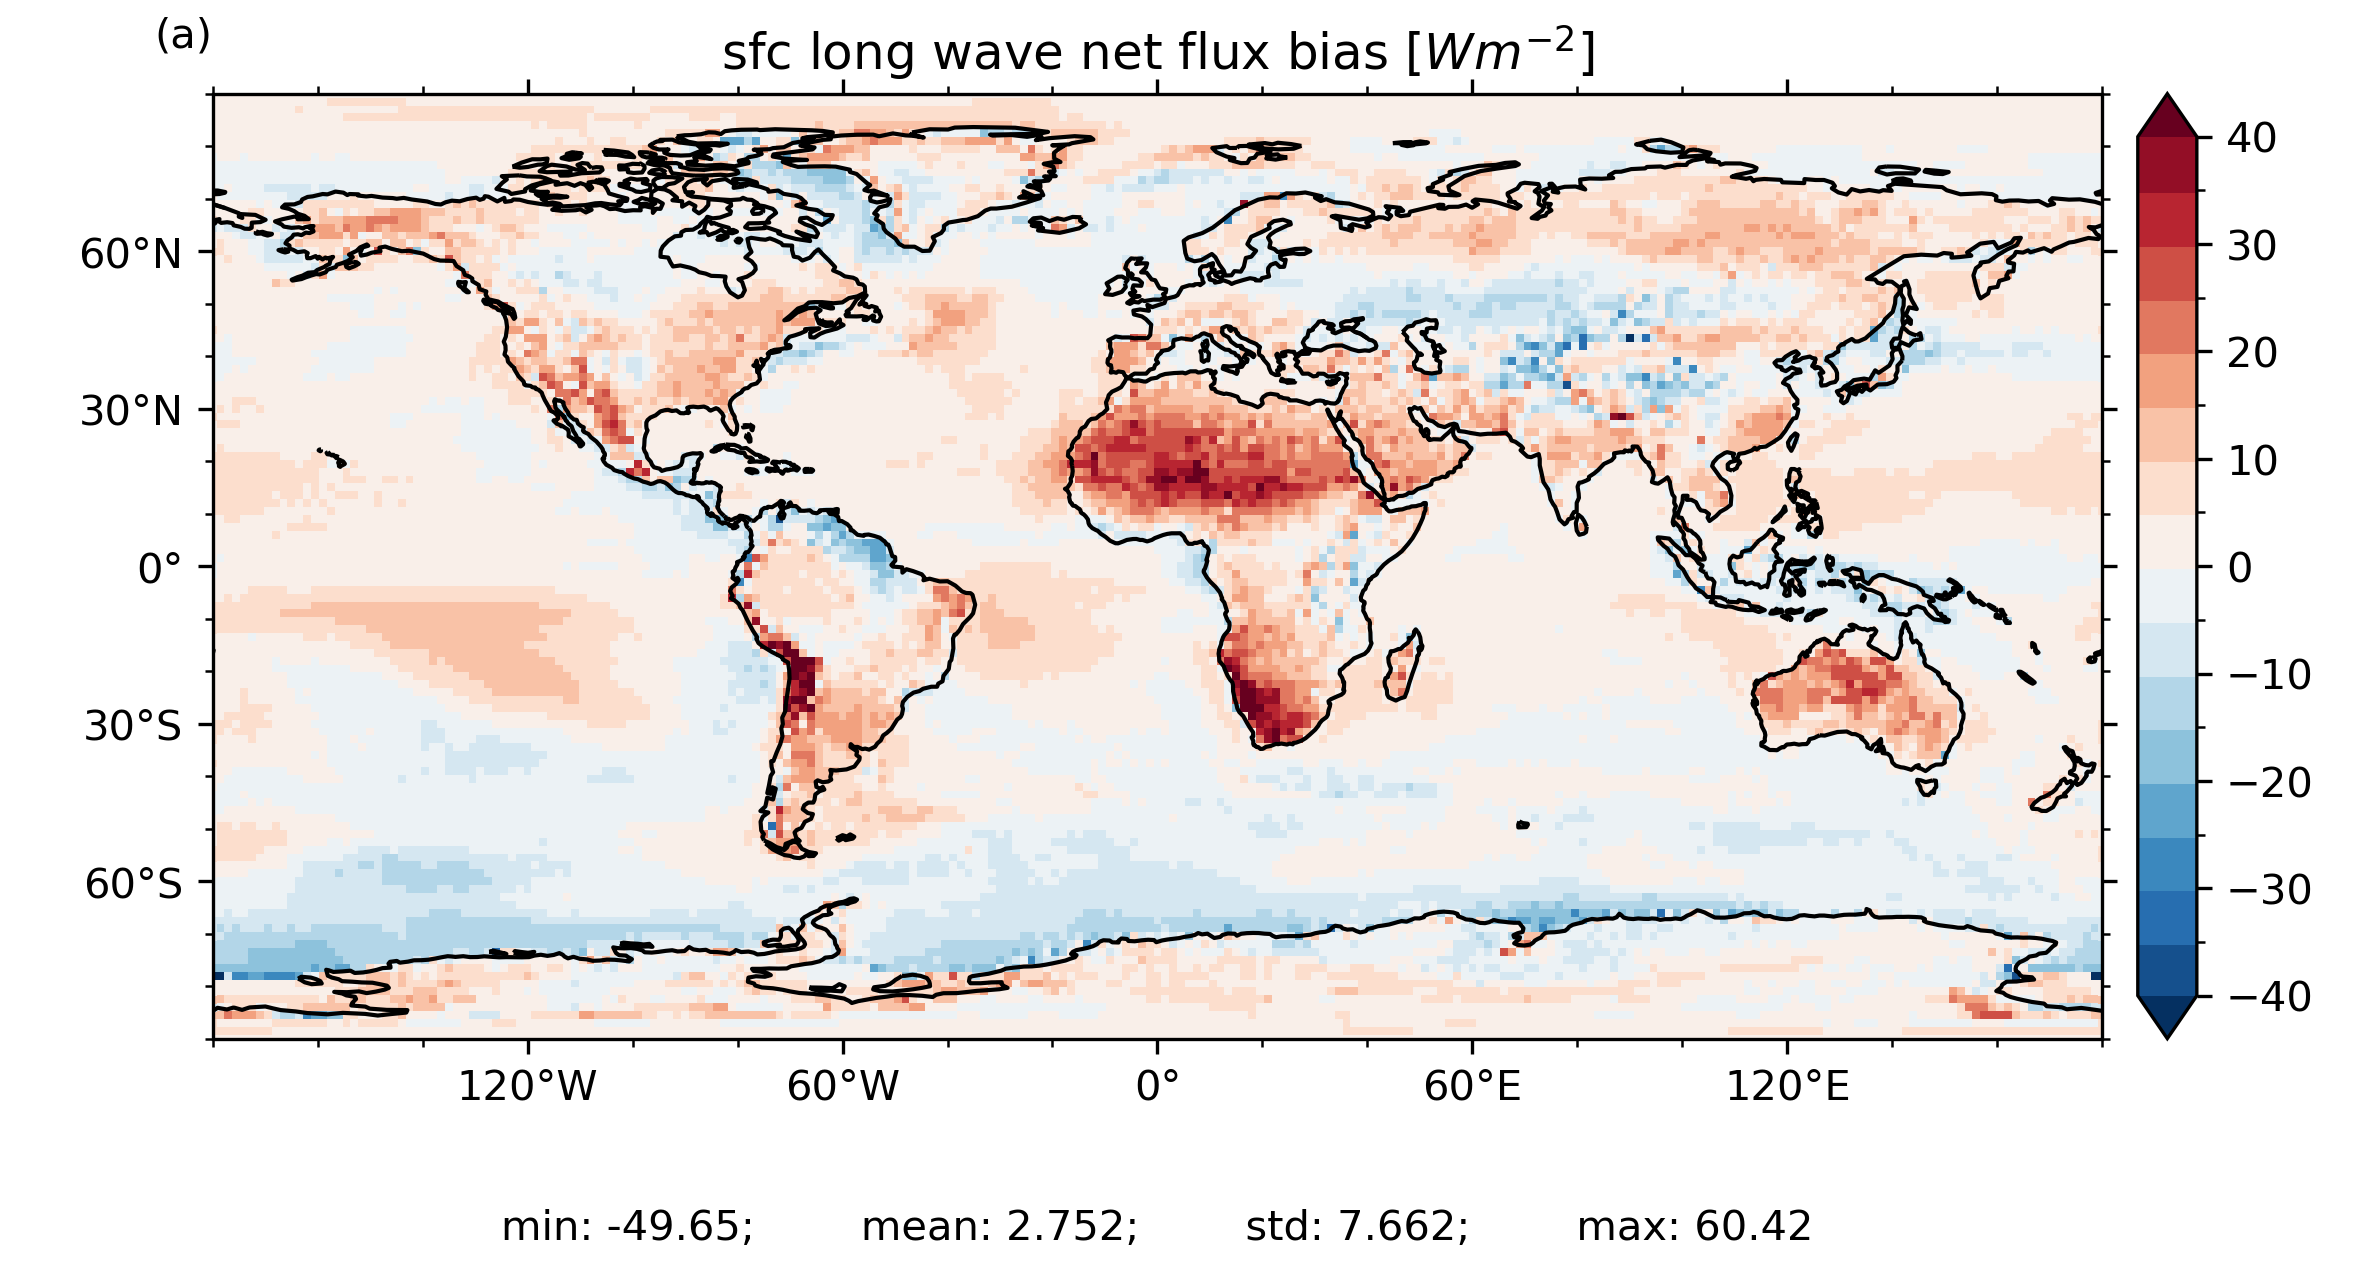
sfc long wave net flux bias
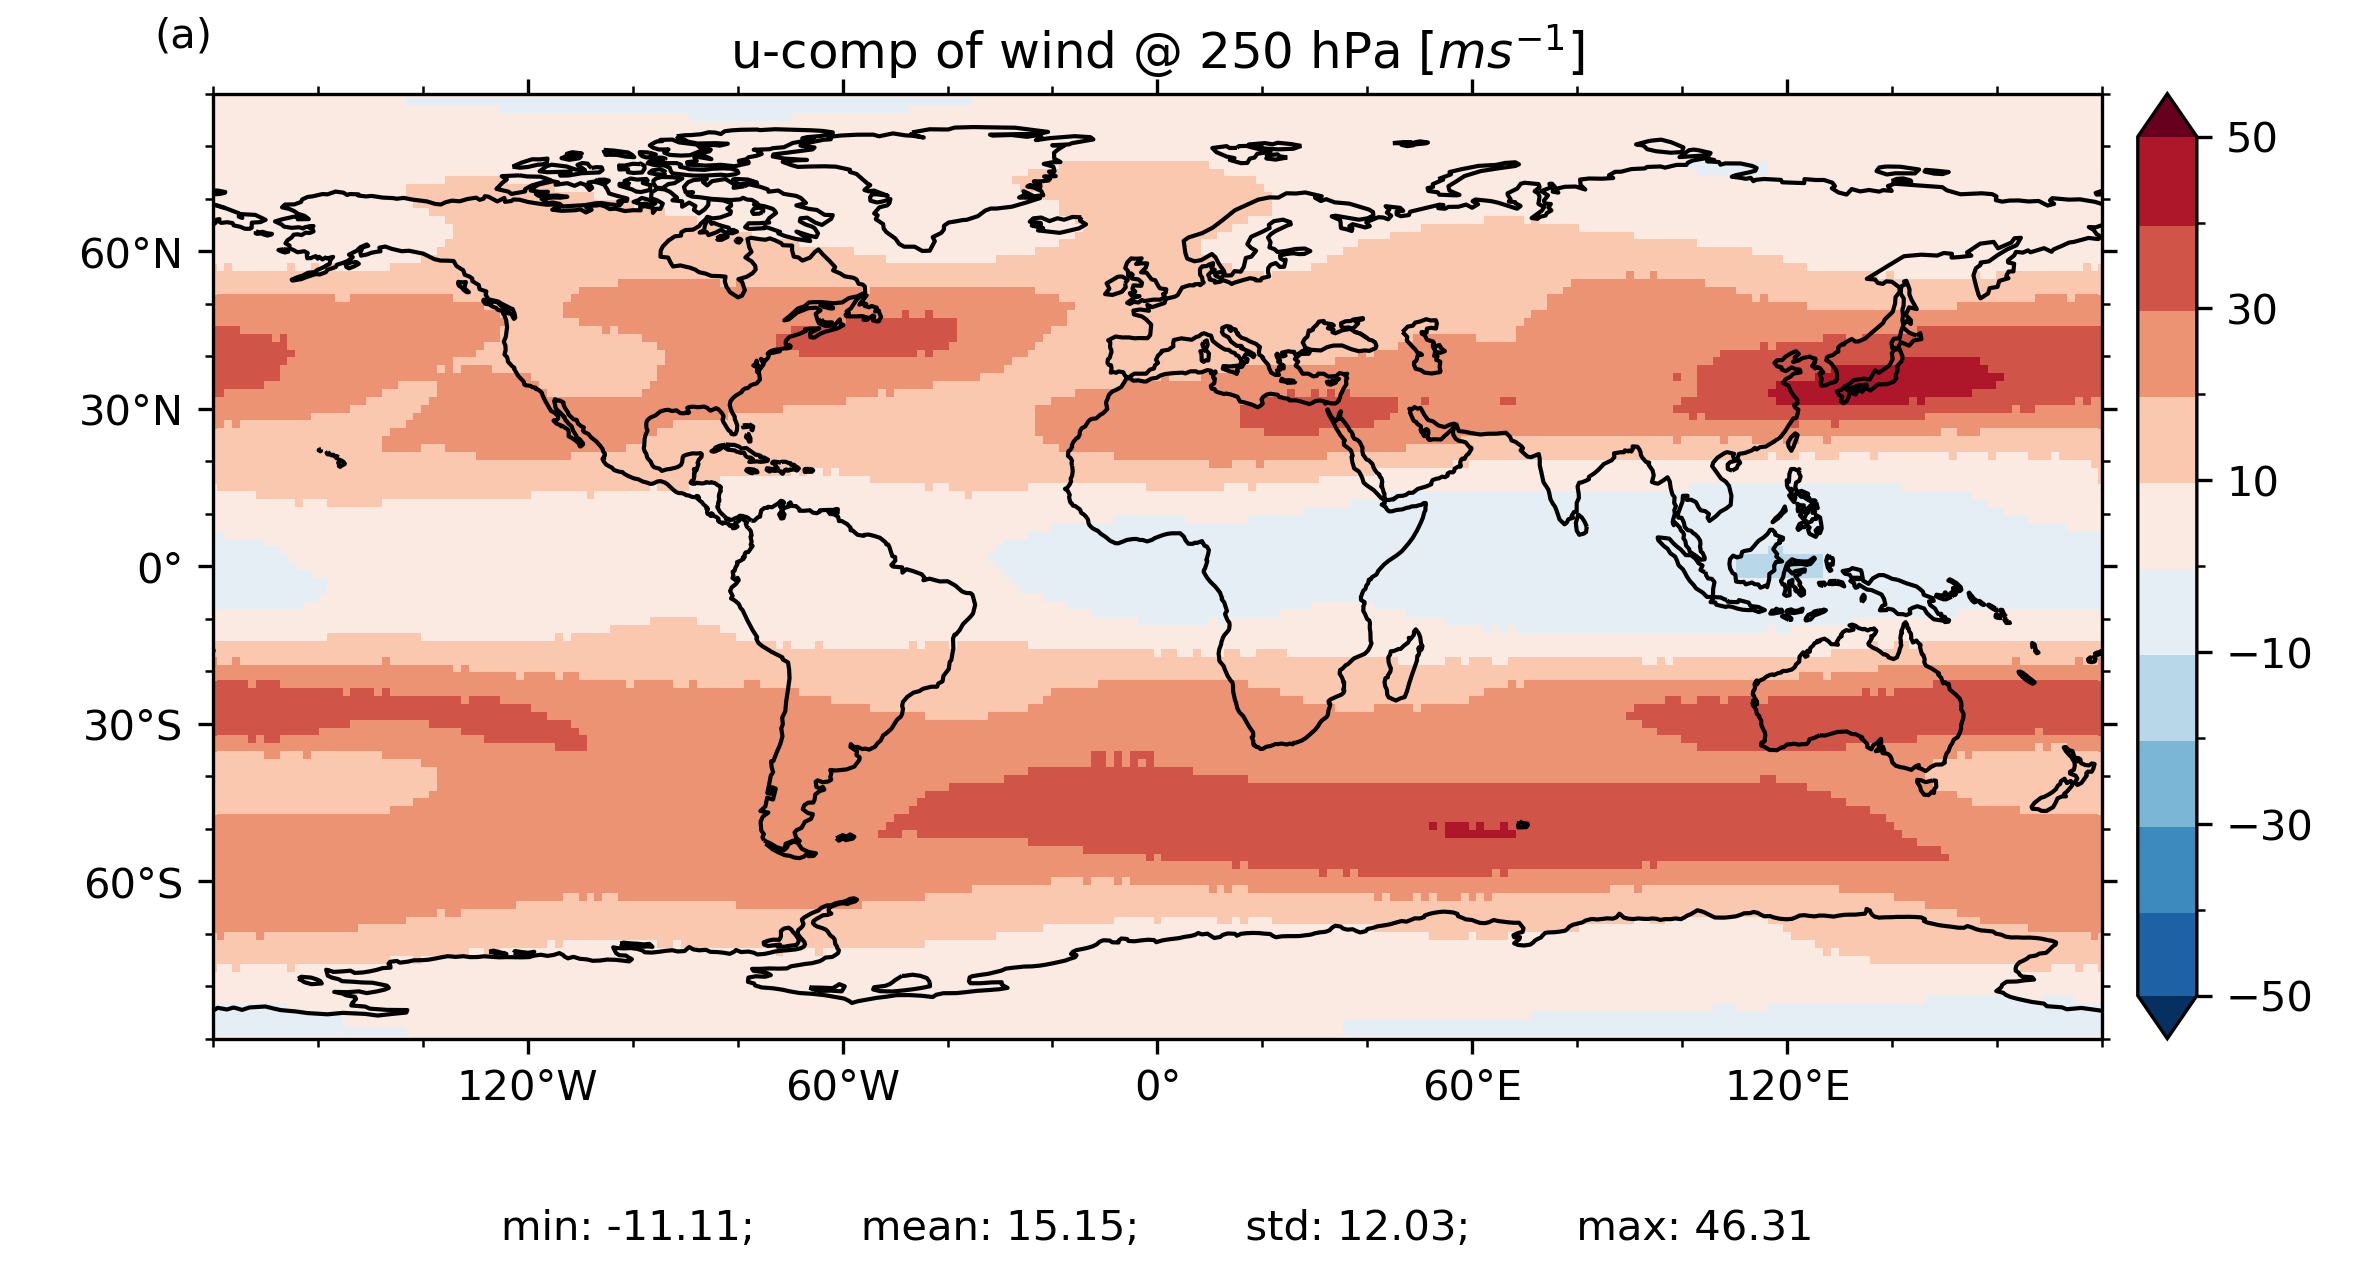
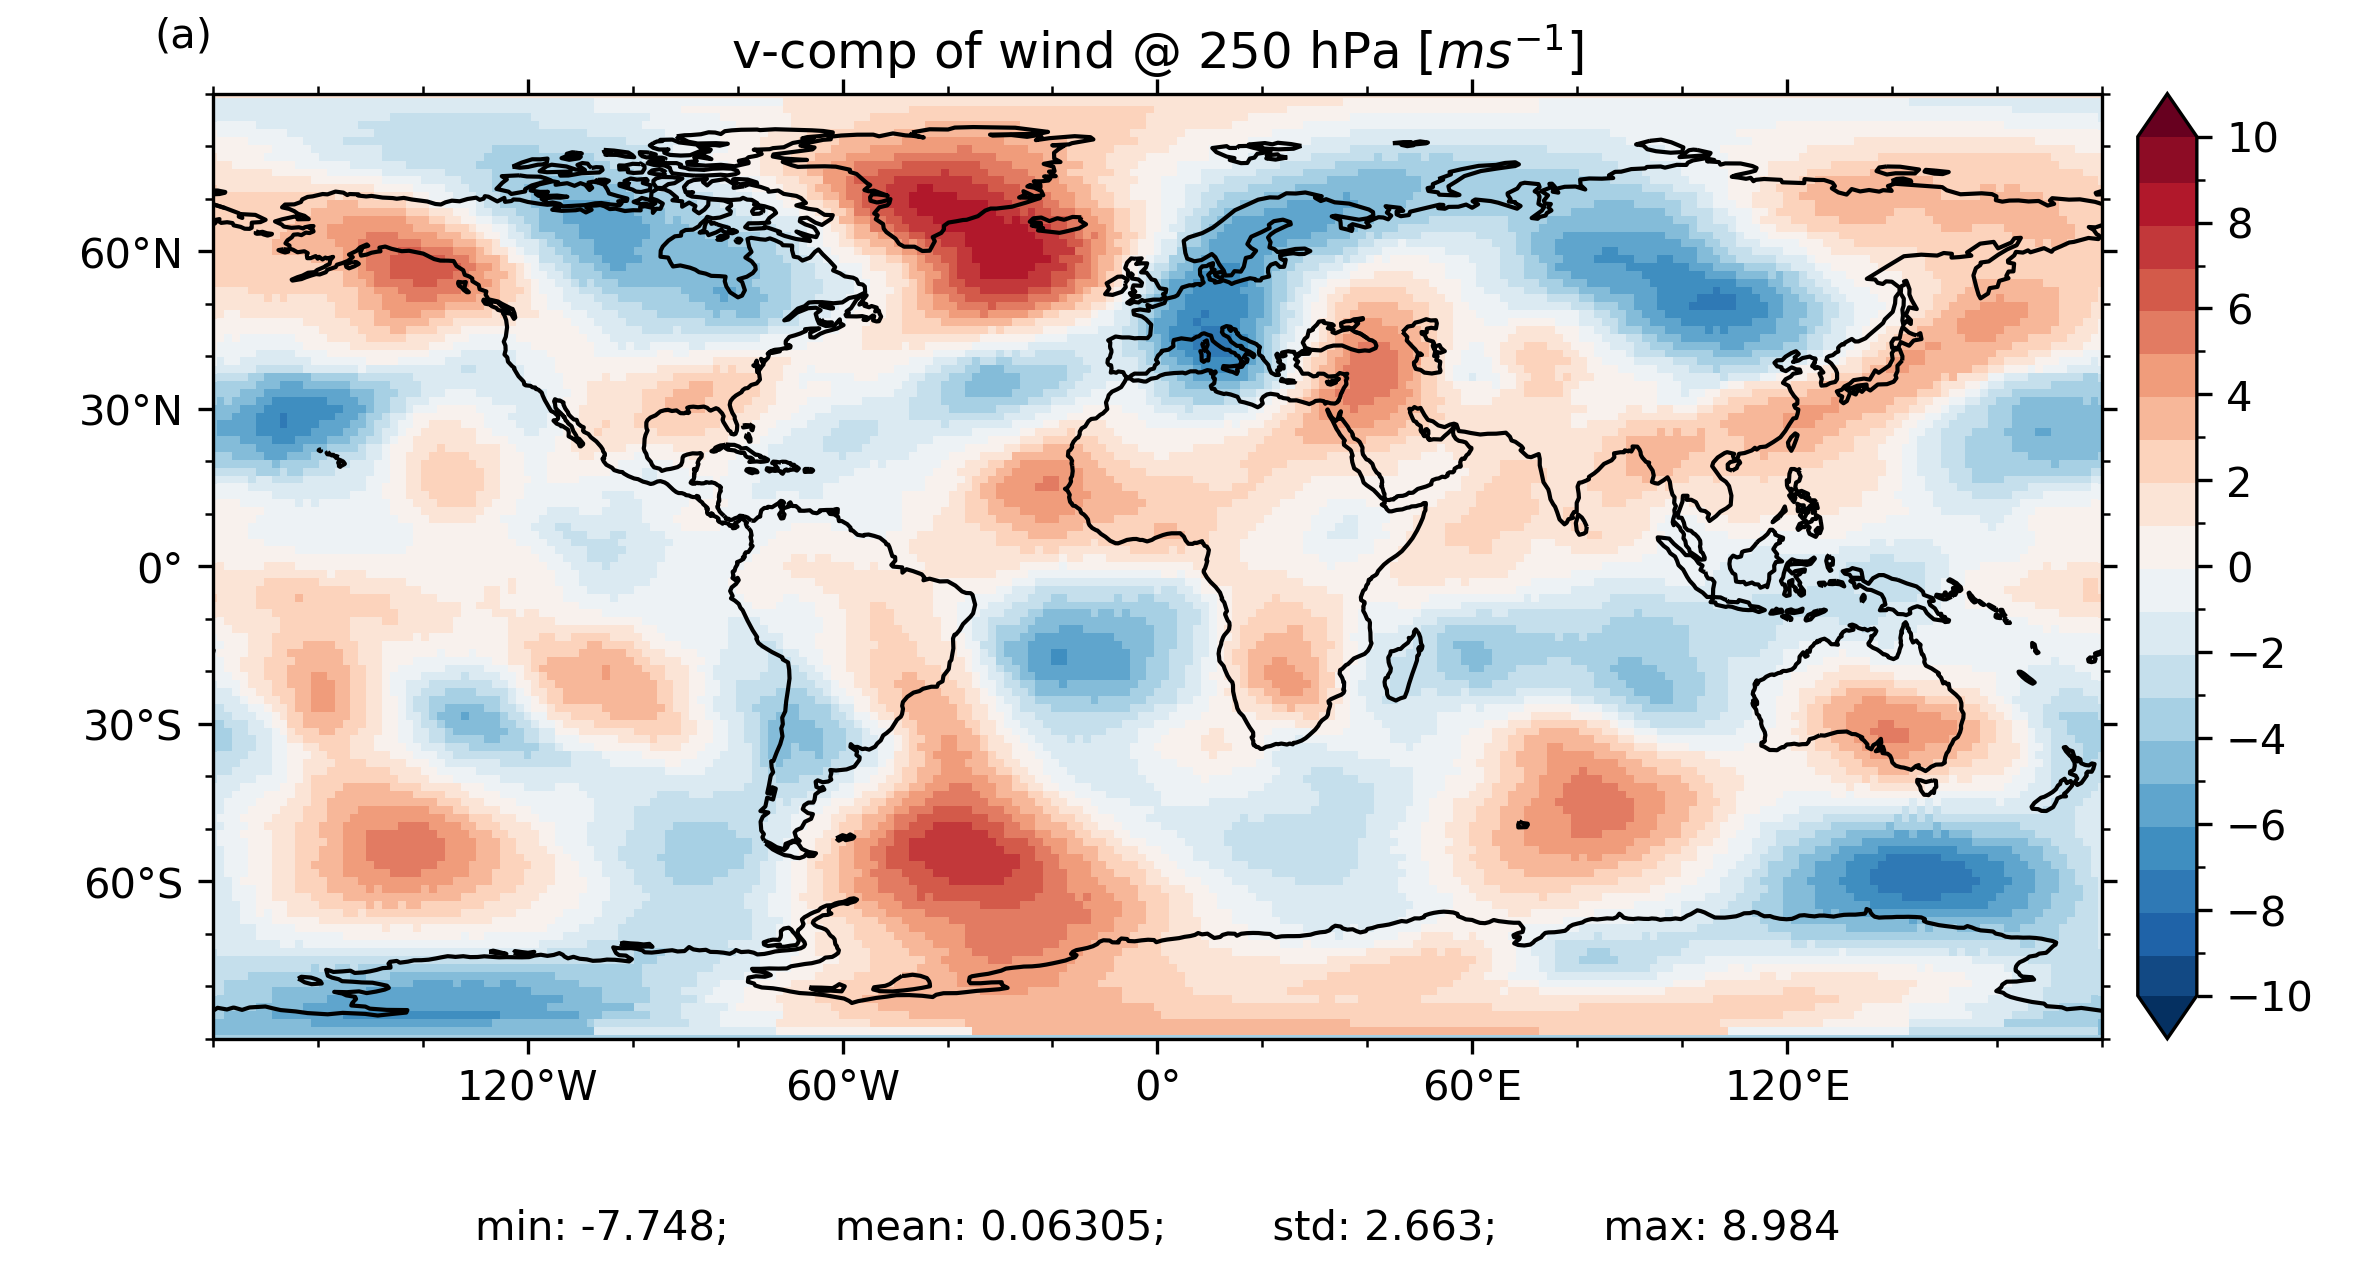
Atmosphere pressure levels
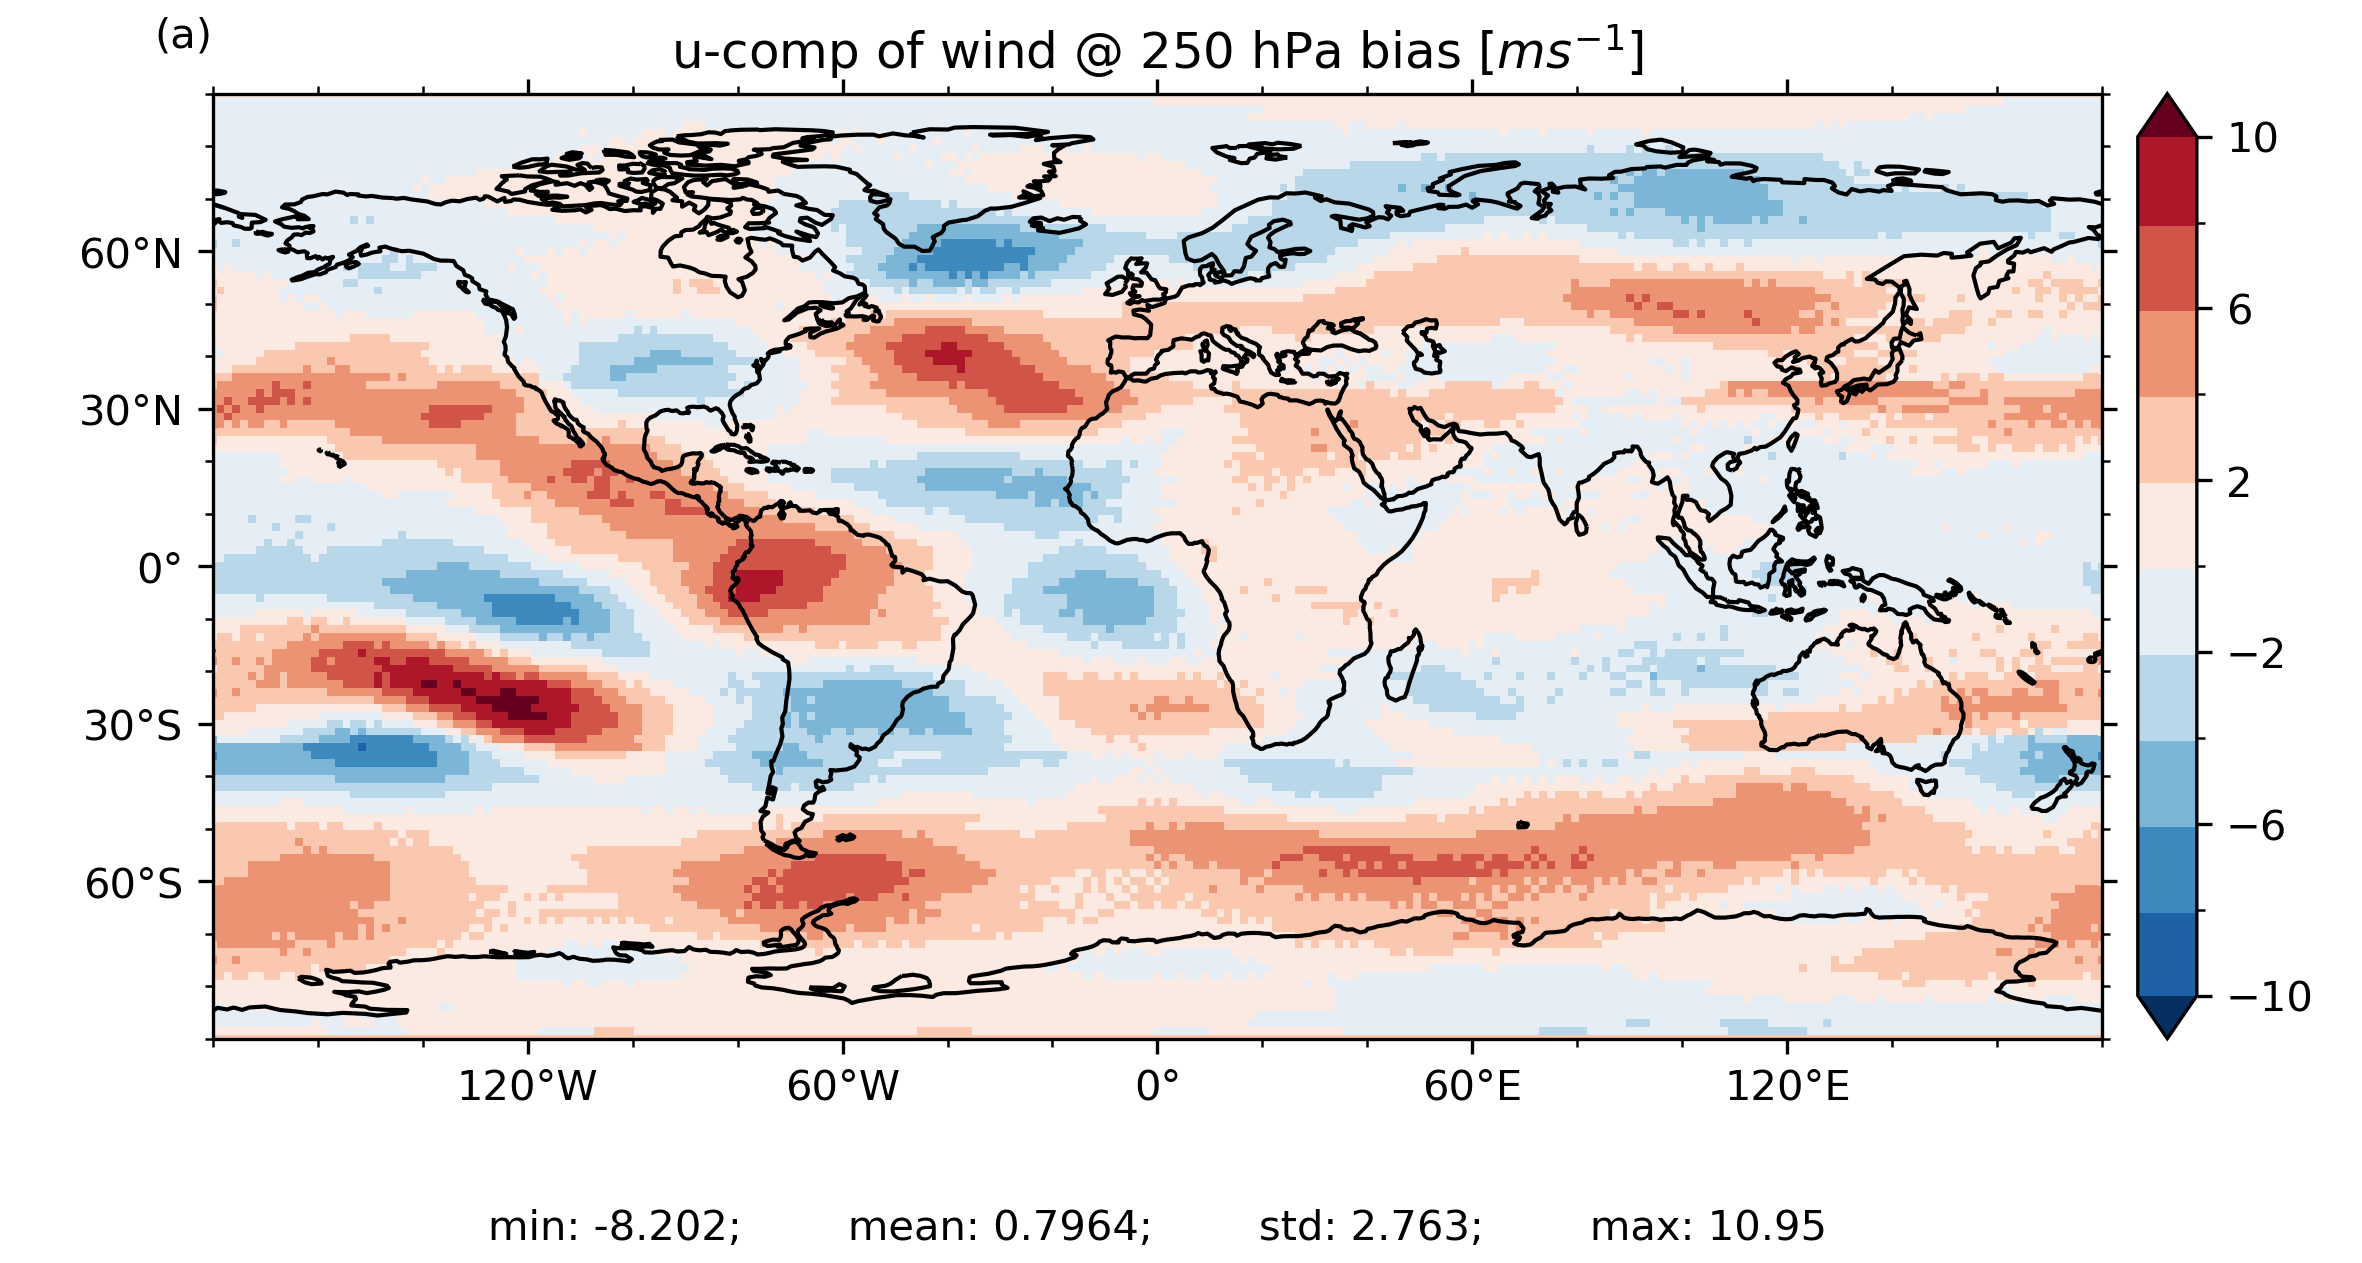
u-comp of wind @ 250 hPa bias
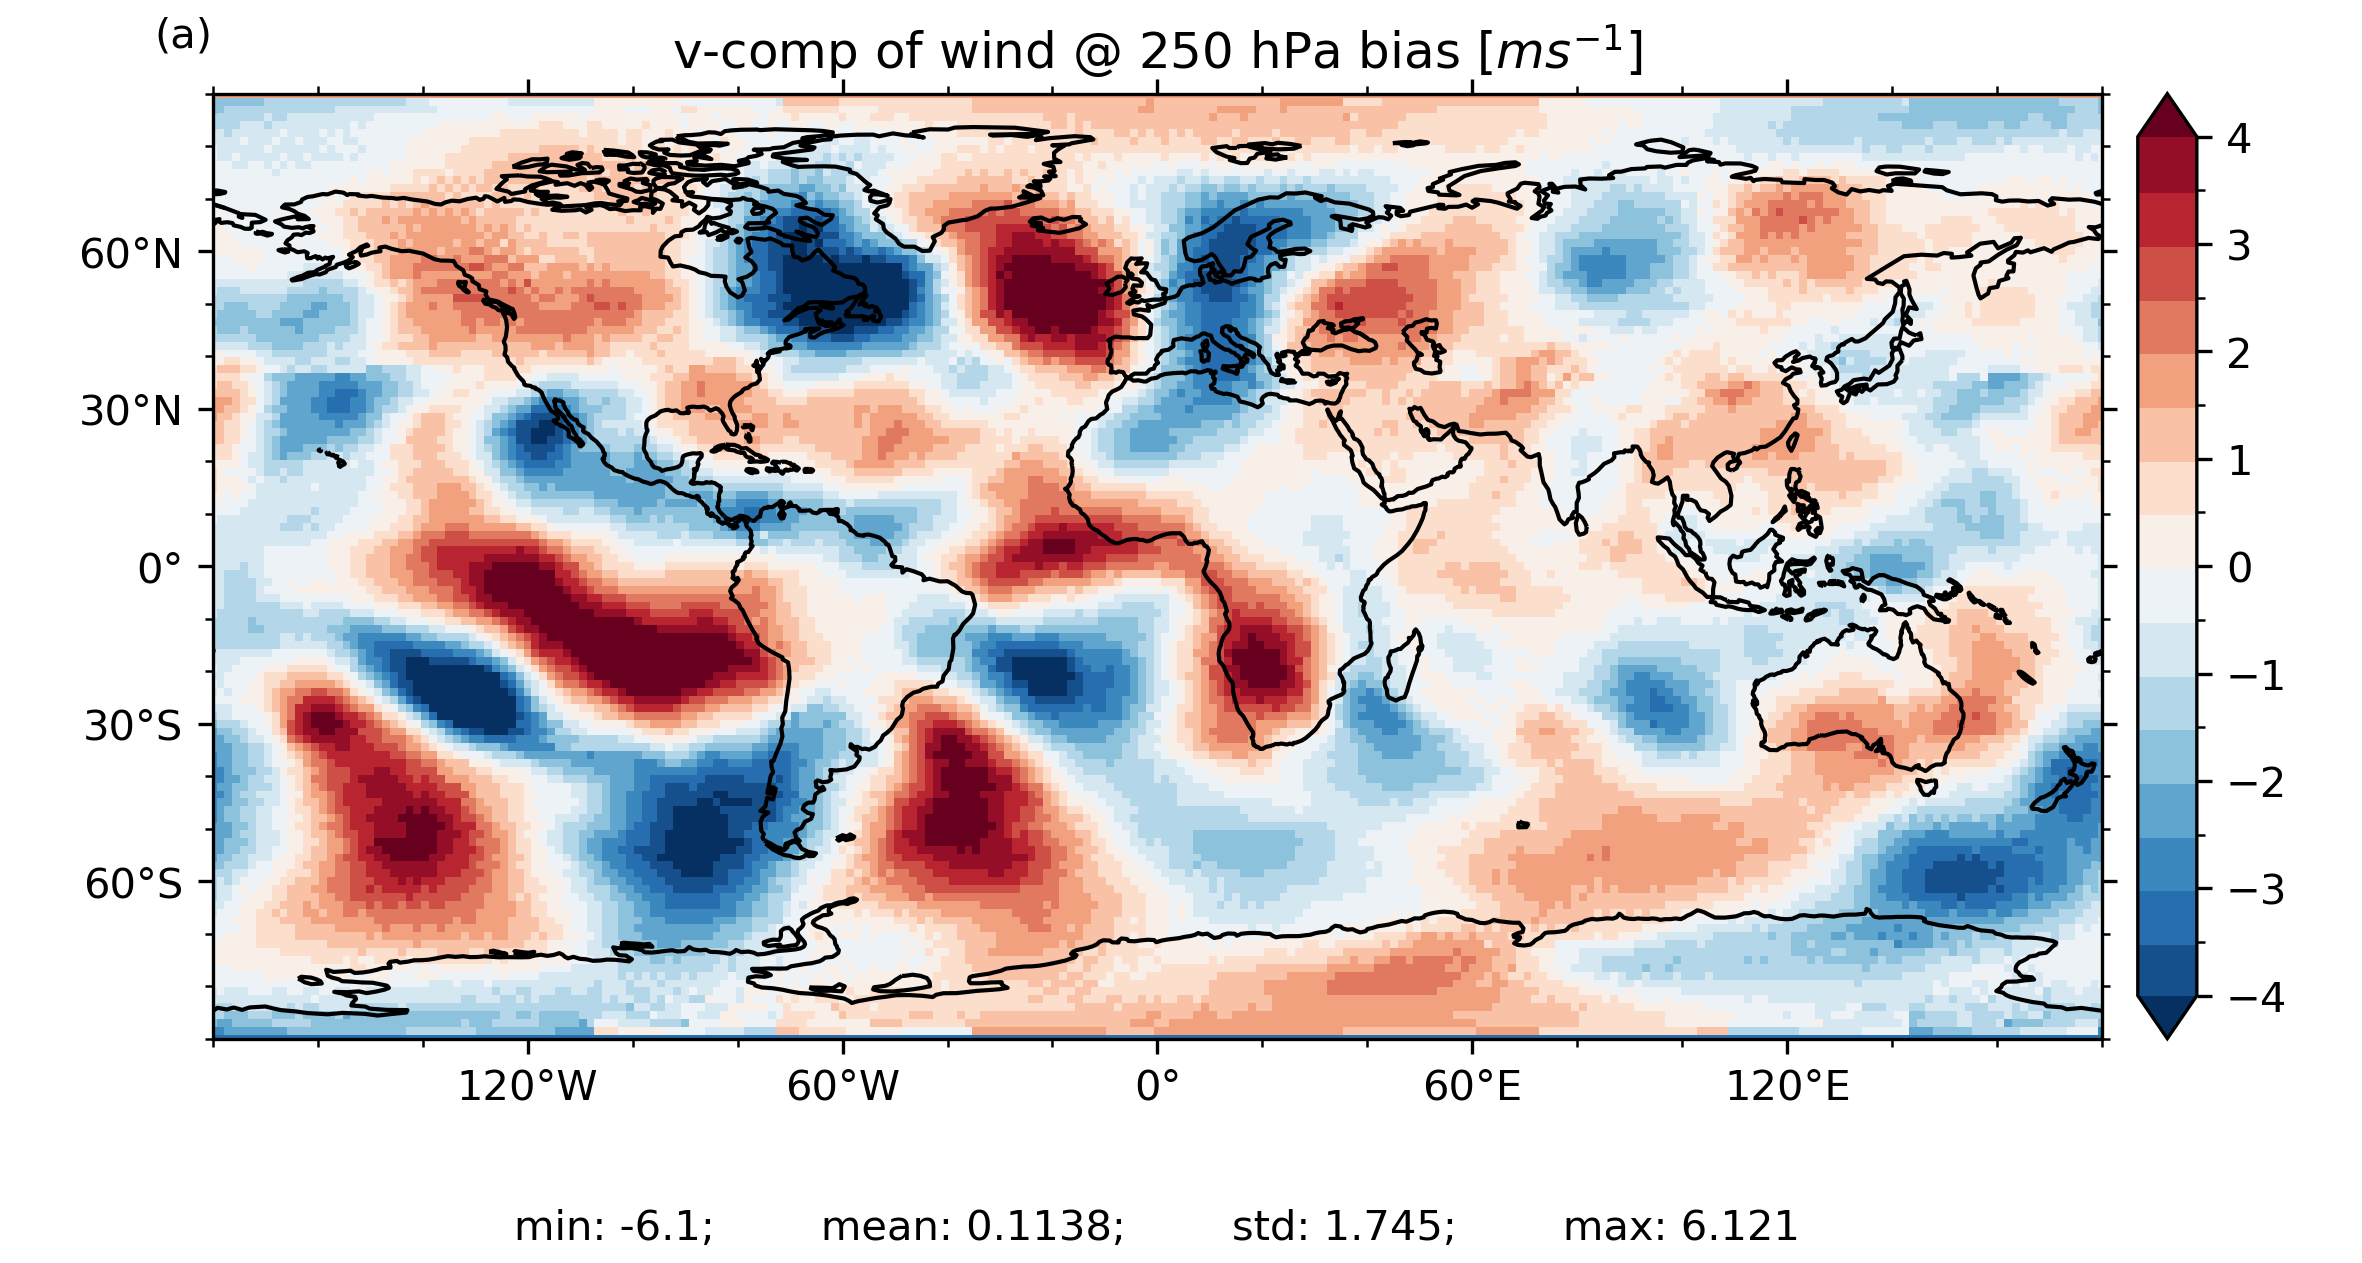
v-comp of wind @ 250 hPa bias
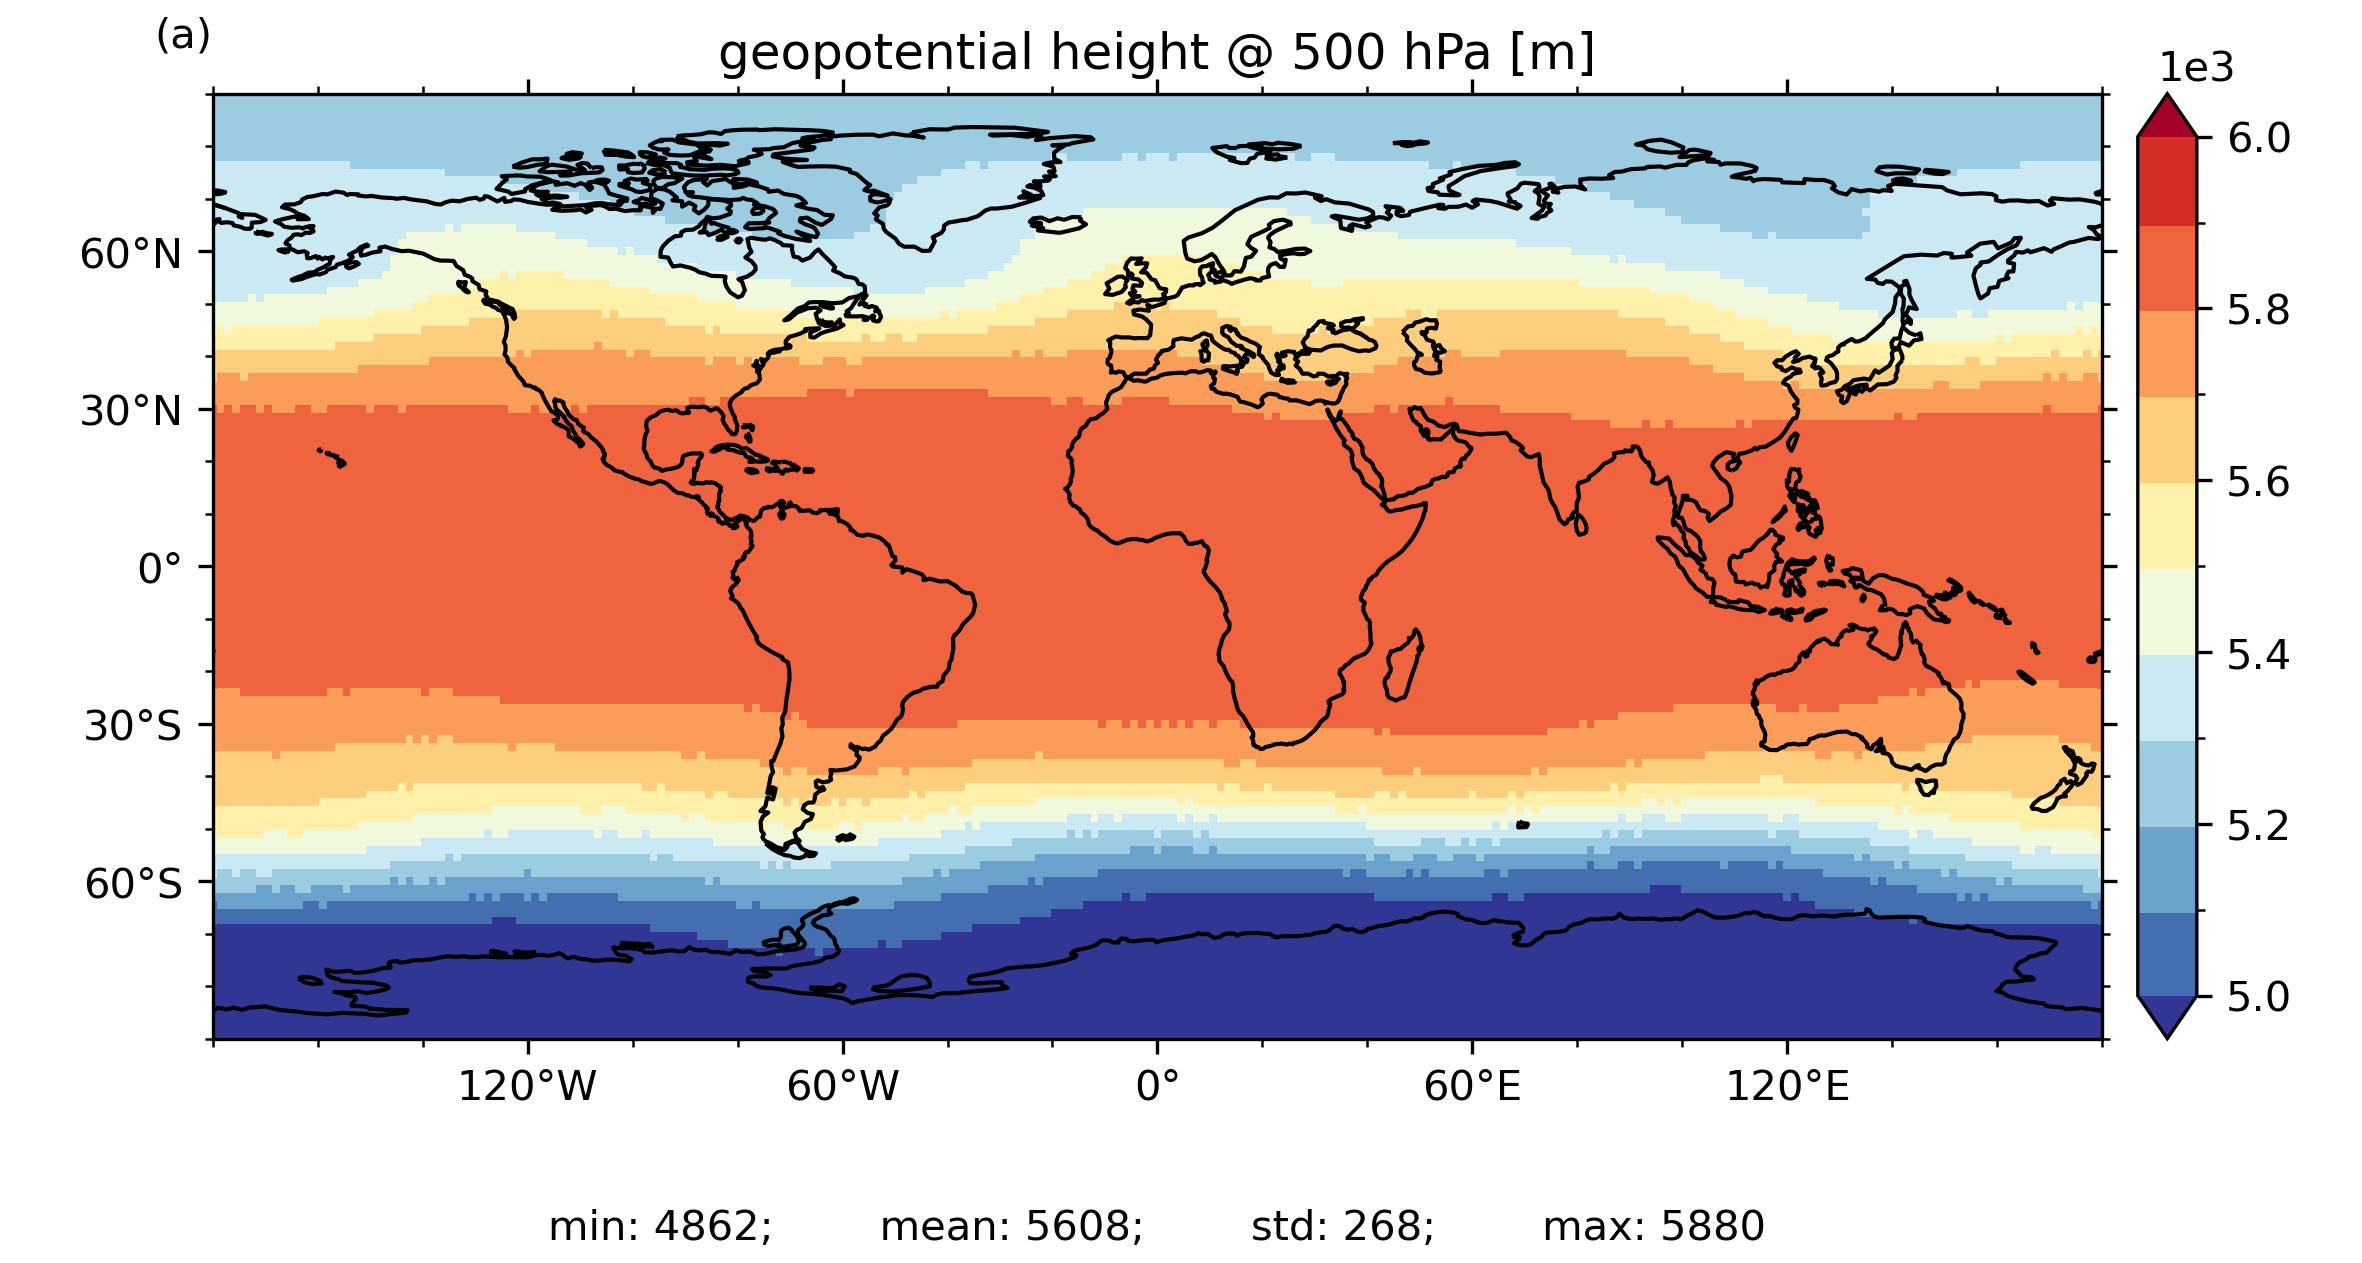
geopotential height @ 500 hPa
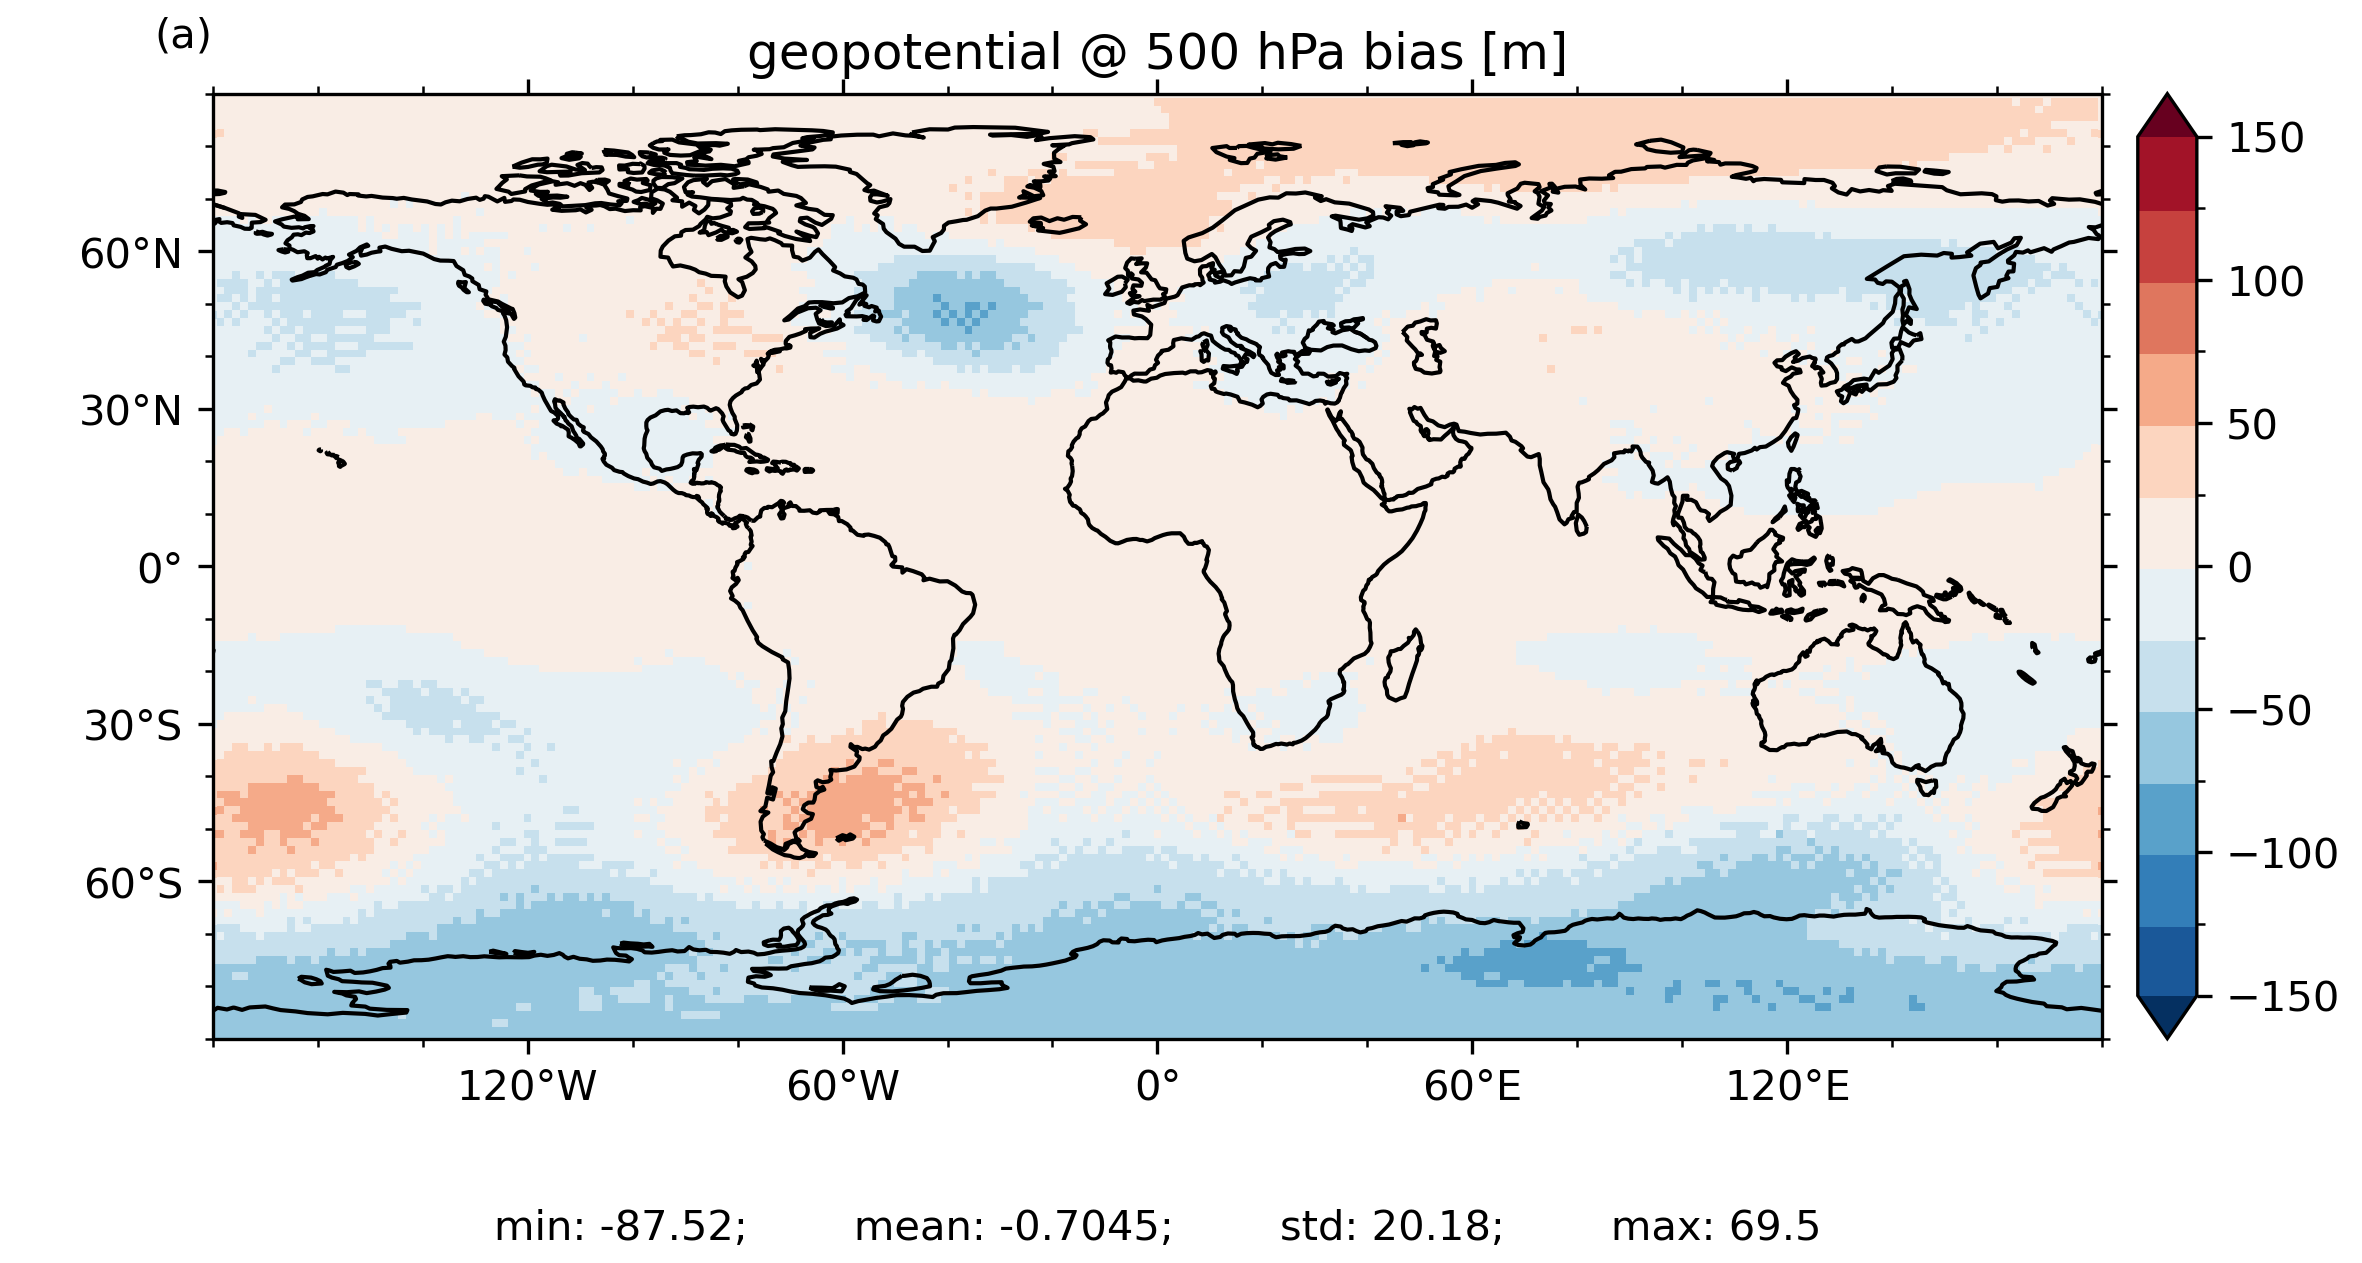
geopotential @ 500 hPa bias
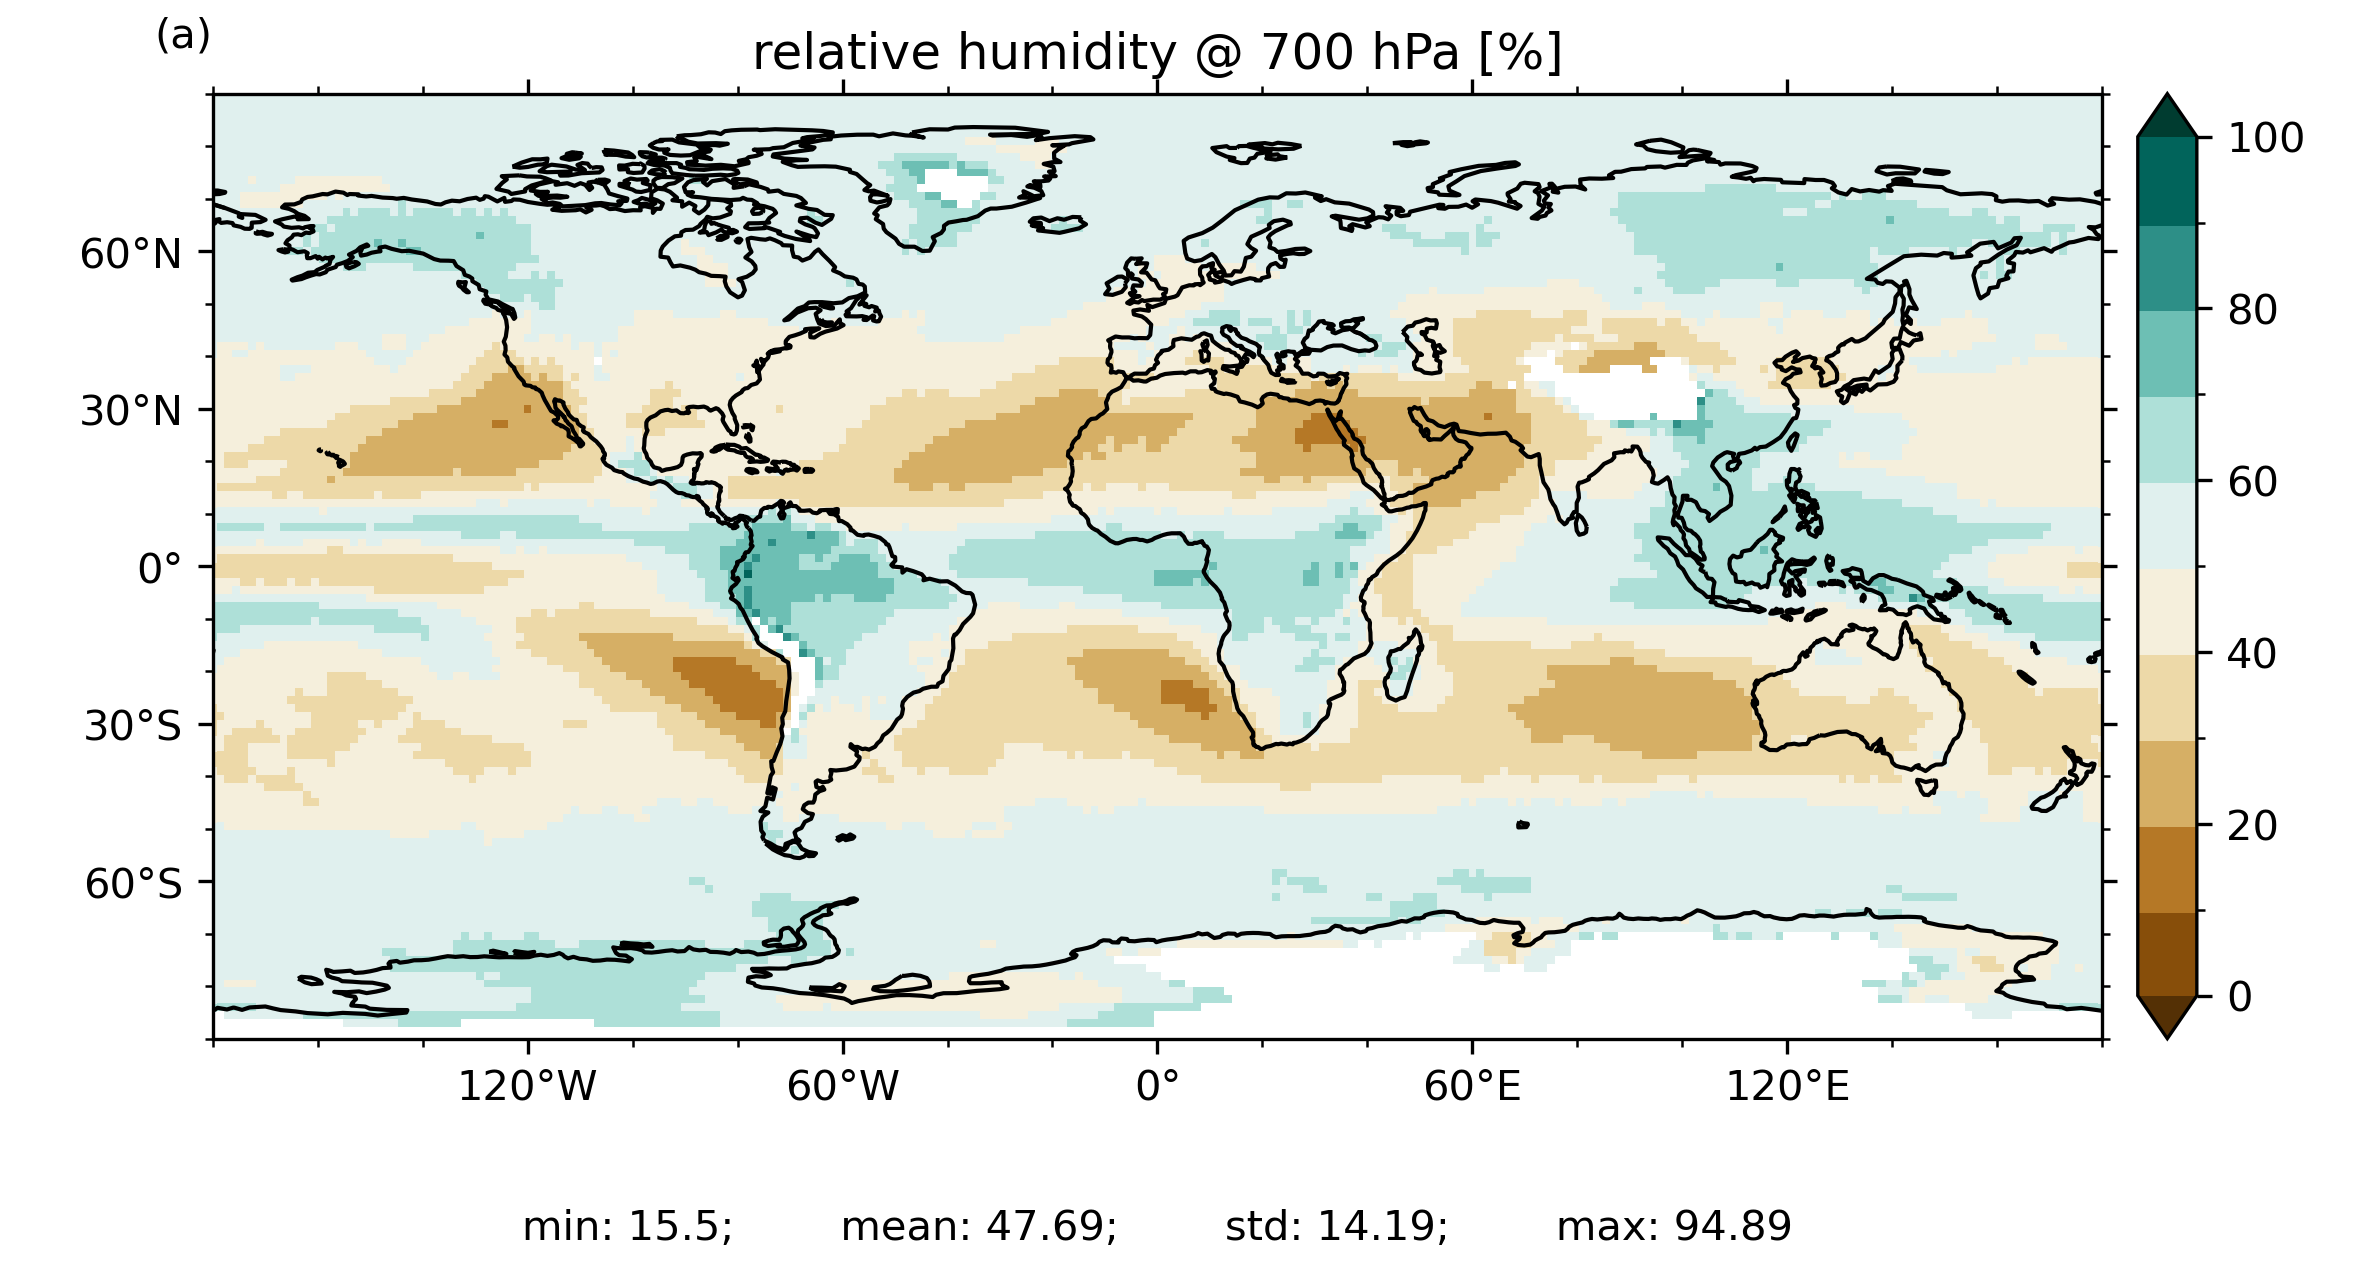
relative humidity @ 700 hPa
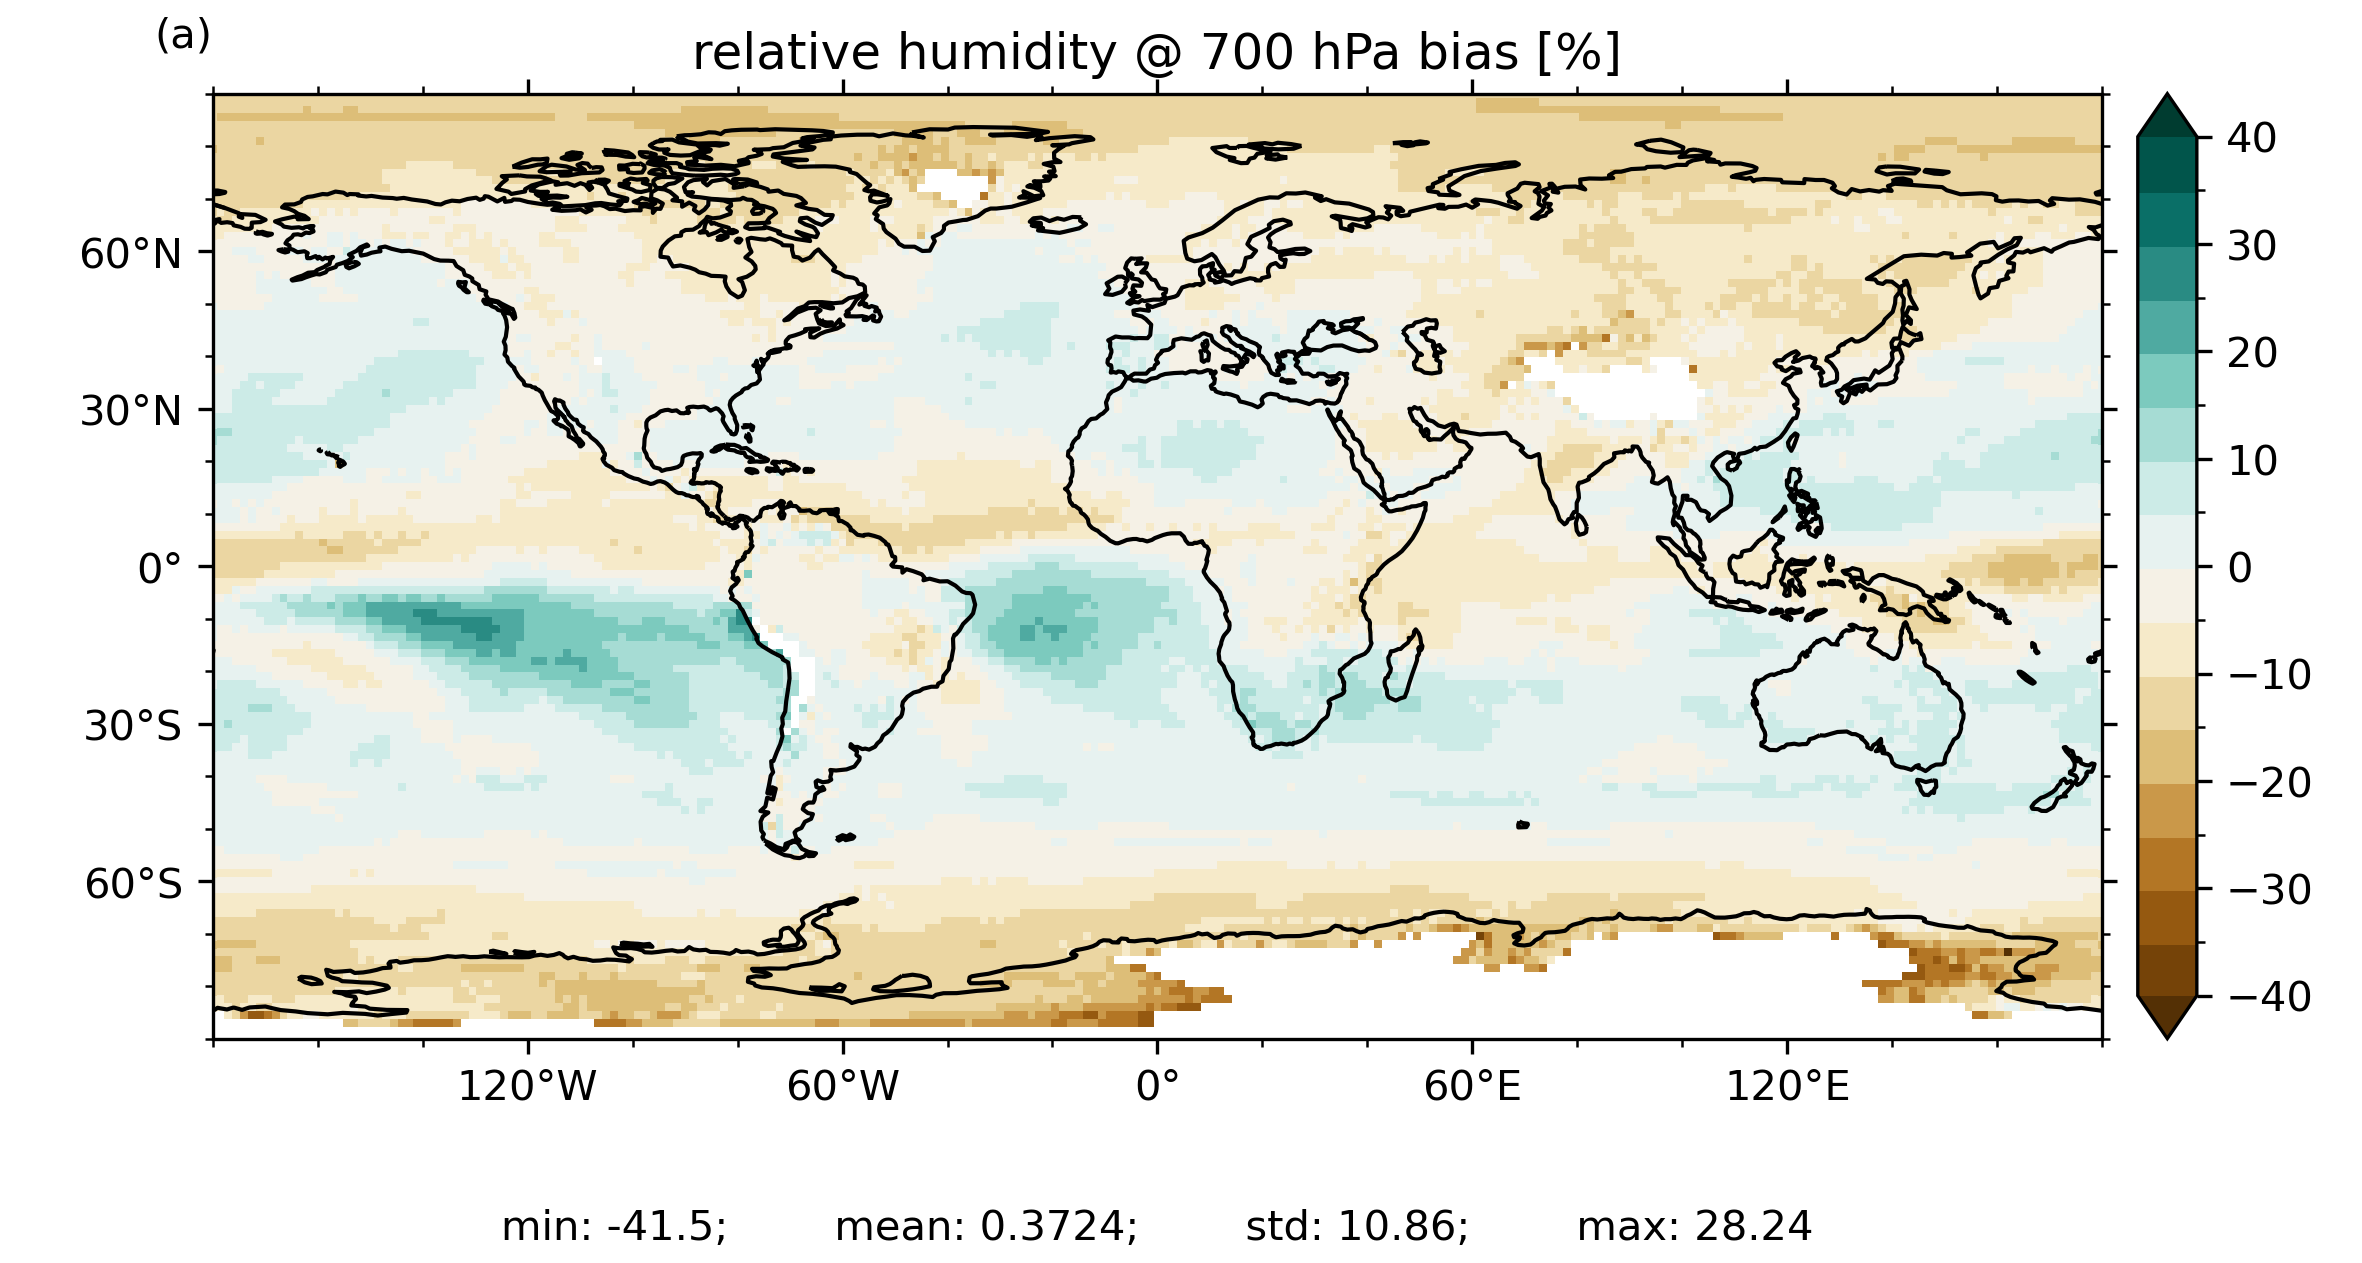
relative humidity @ 700 hPa bias
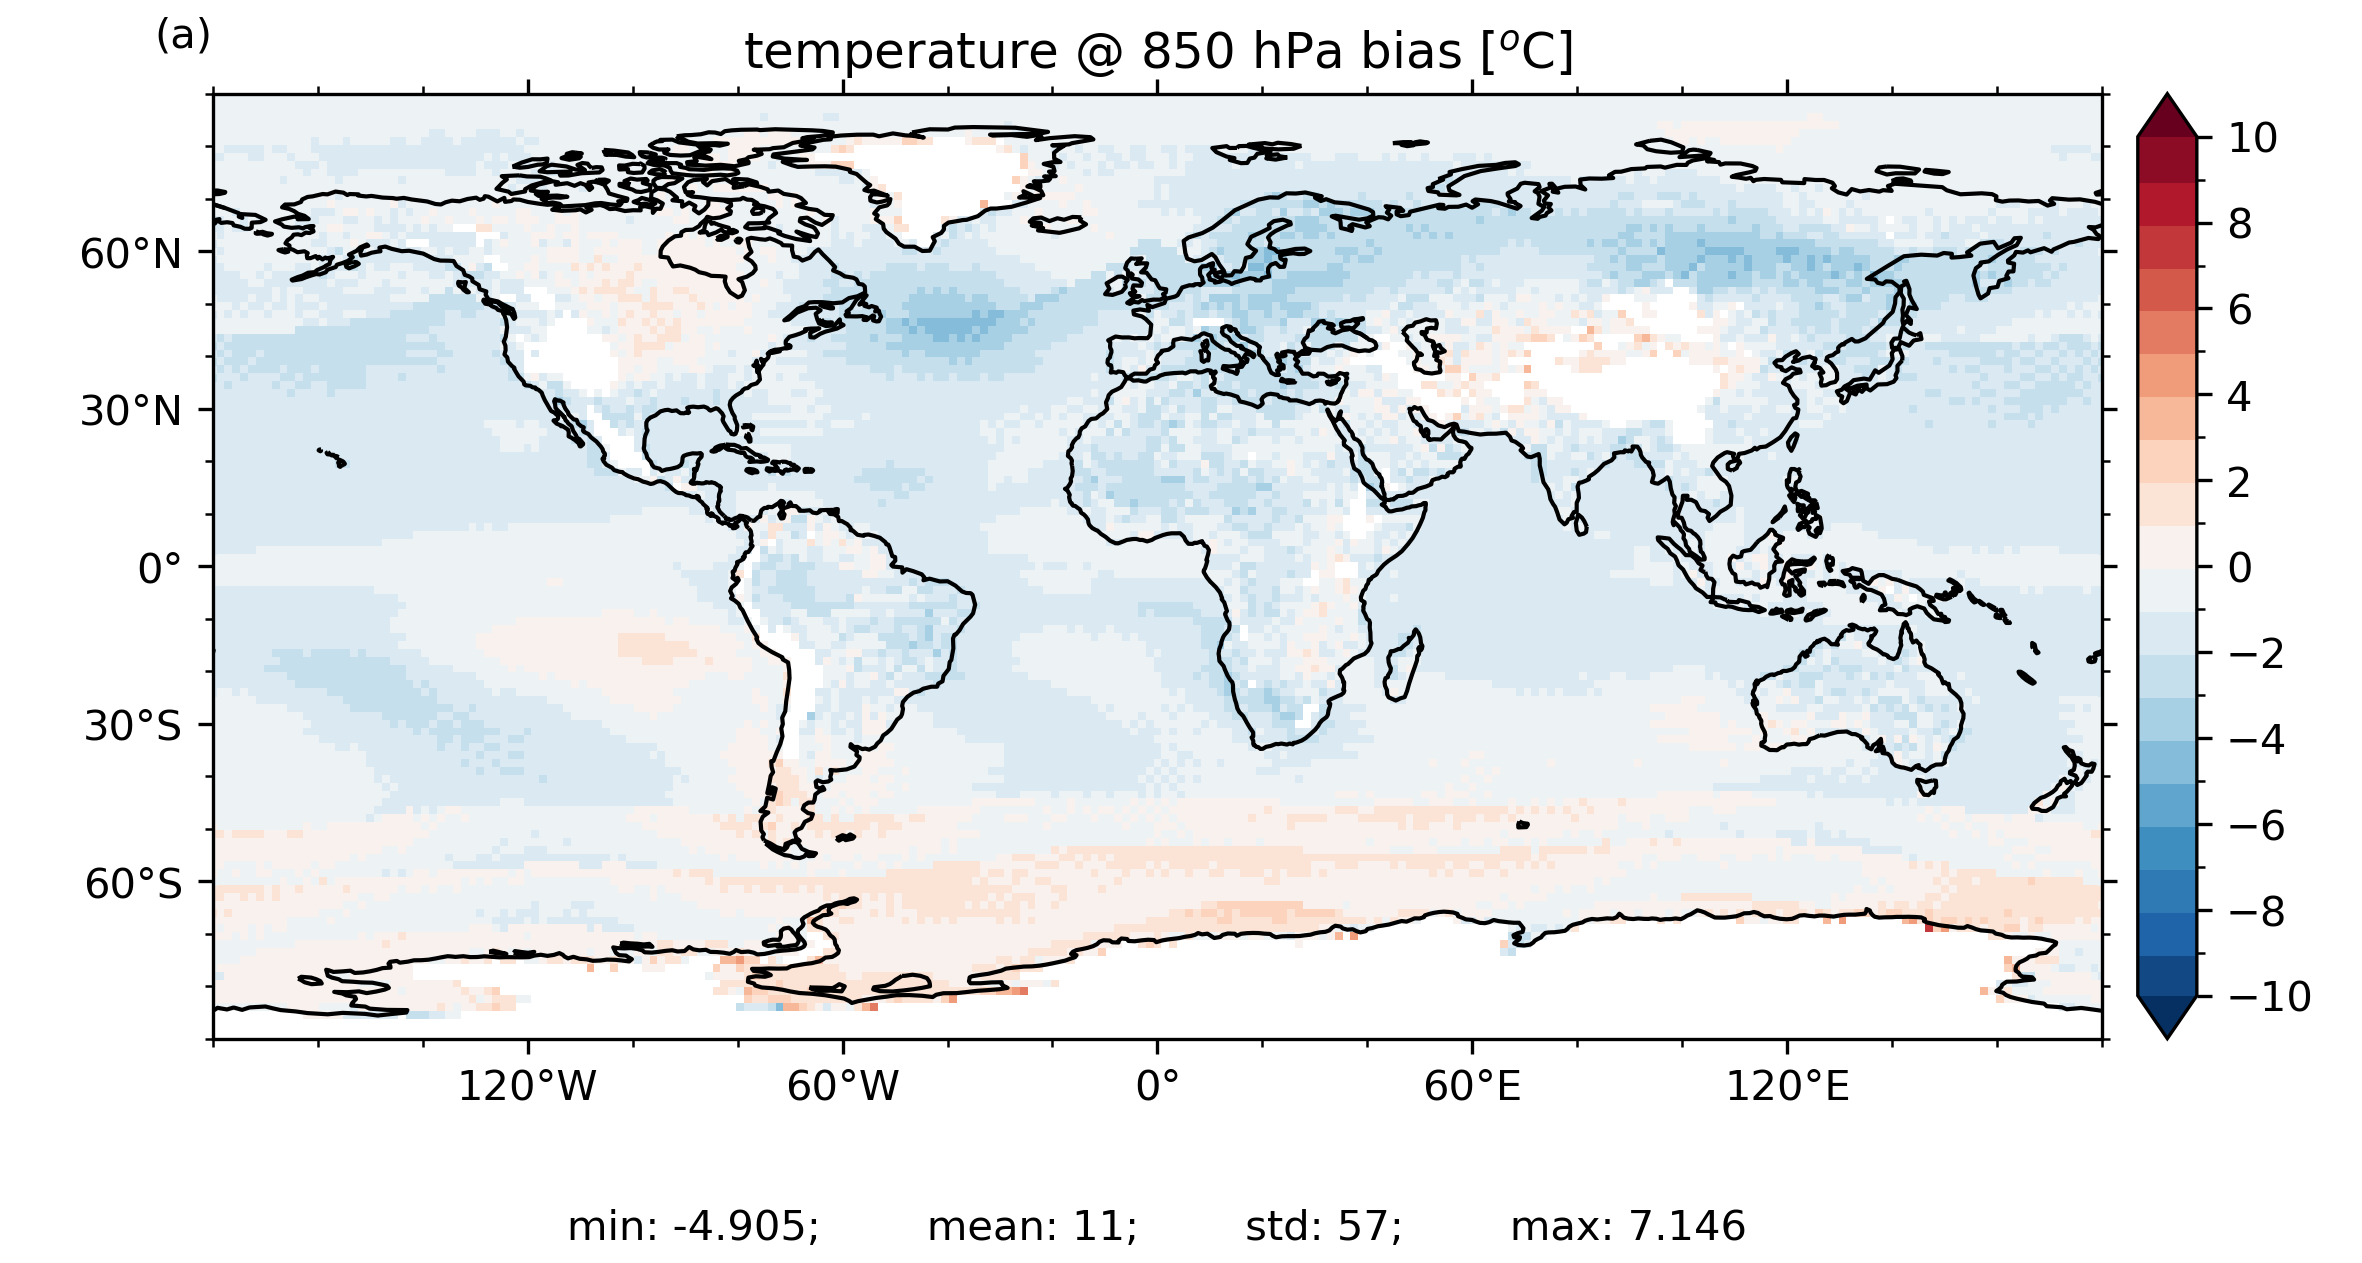
temperature @ 850 hPa bias
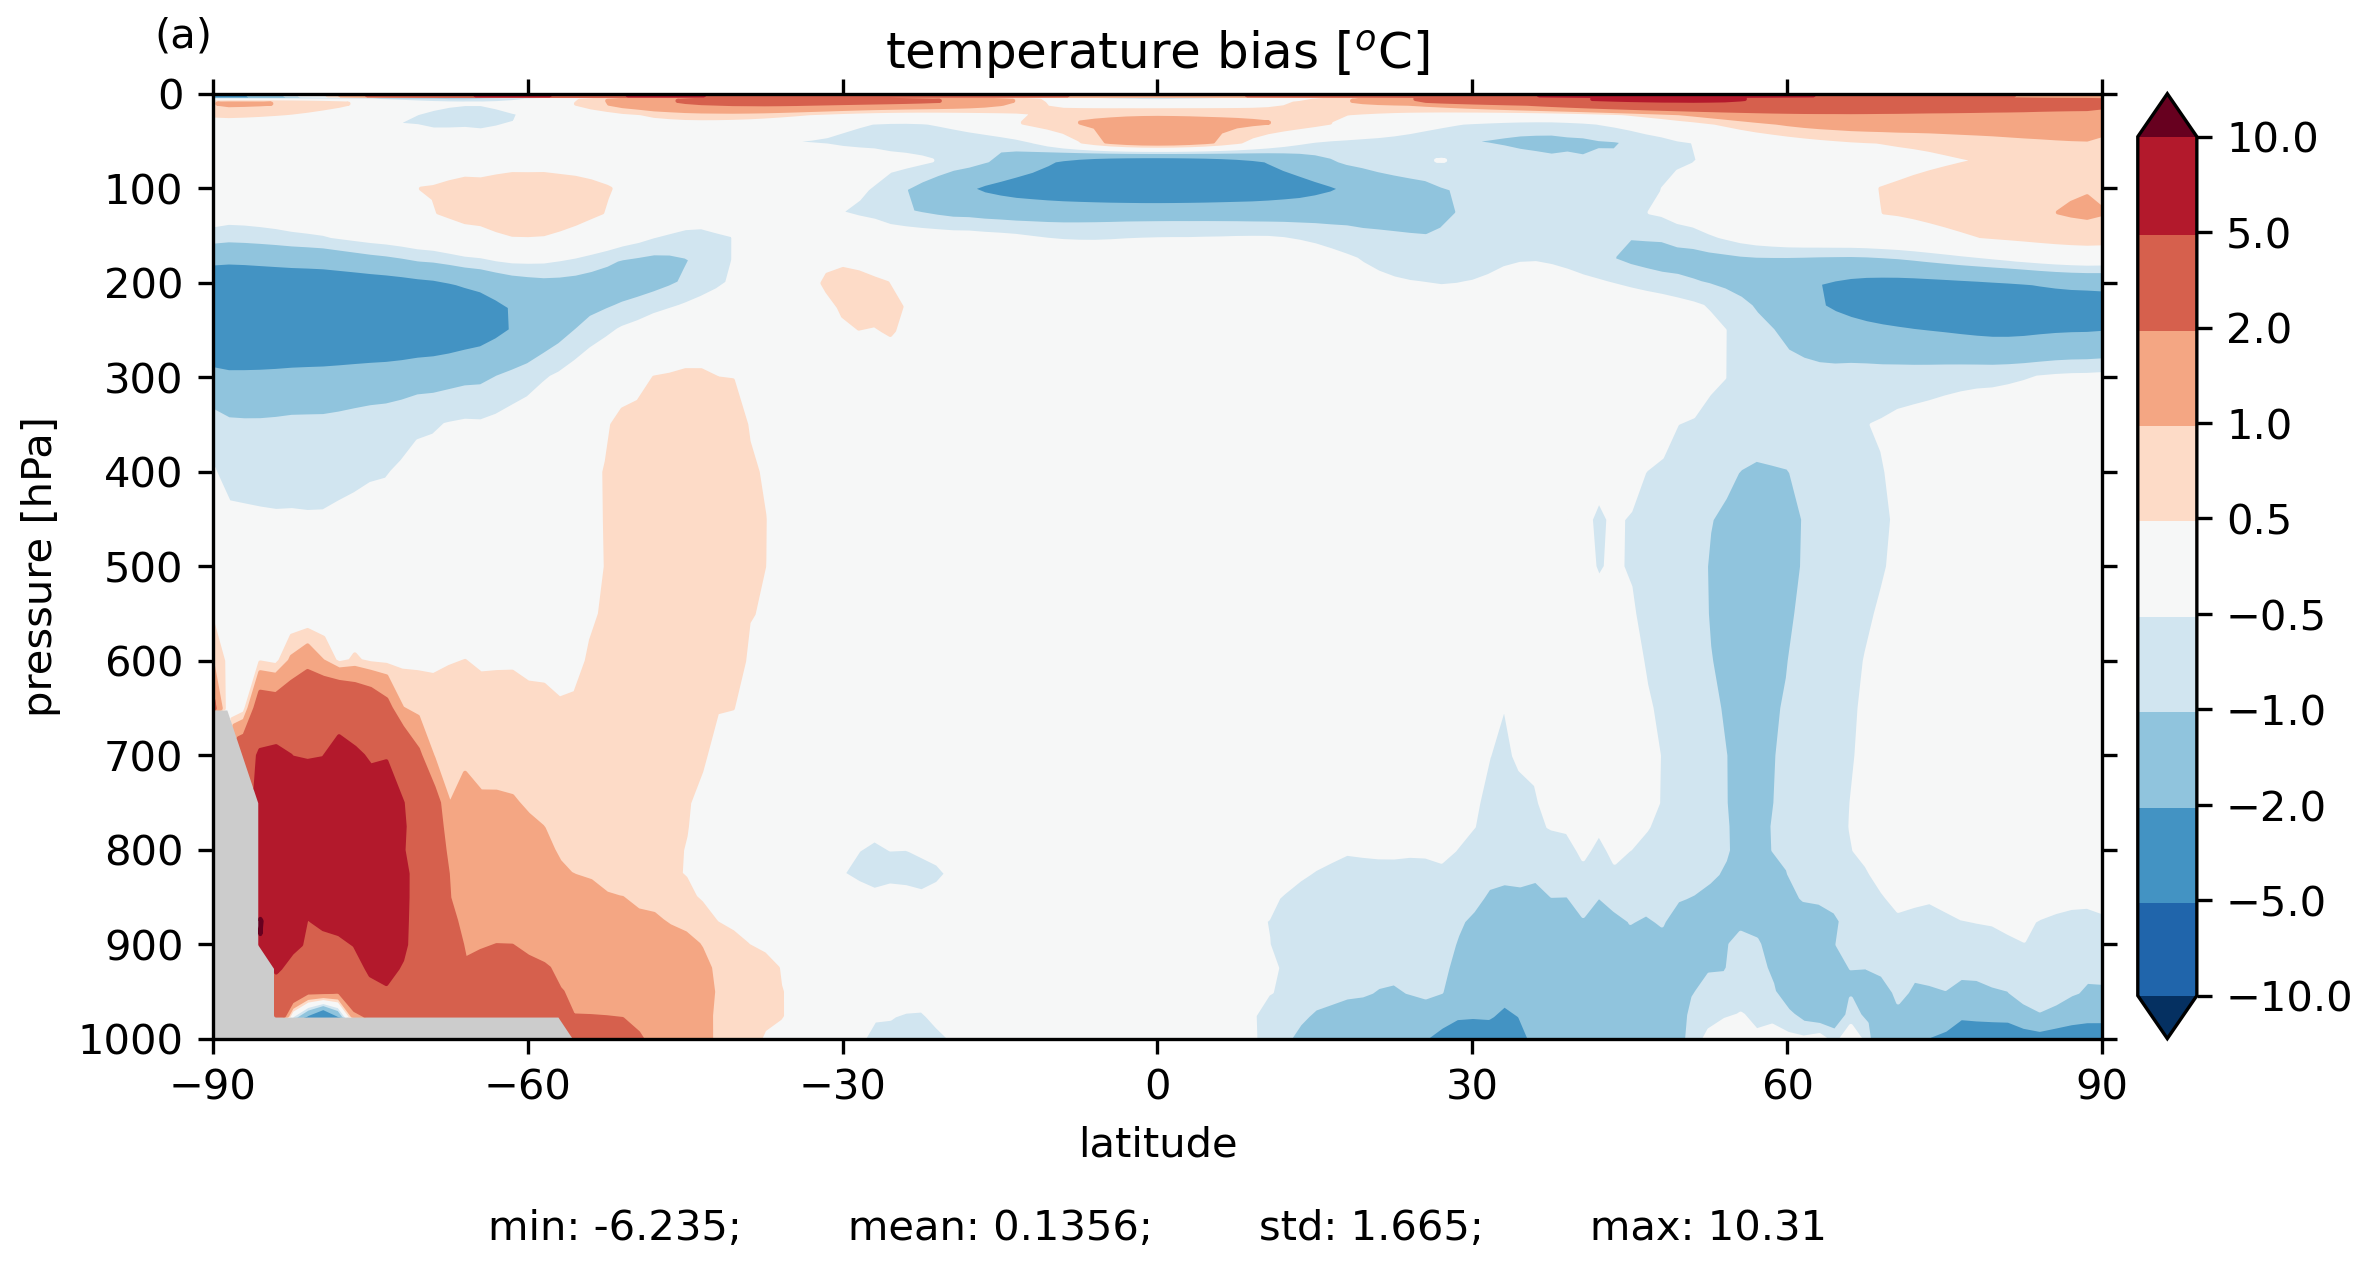
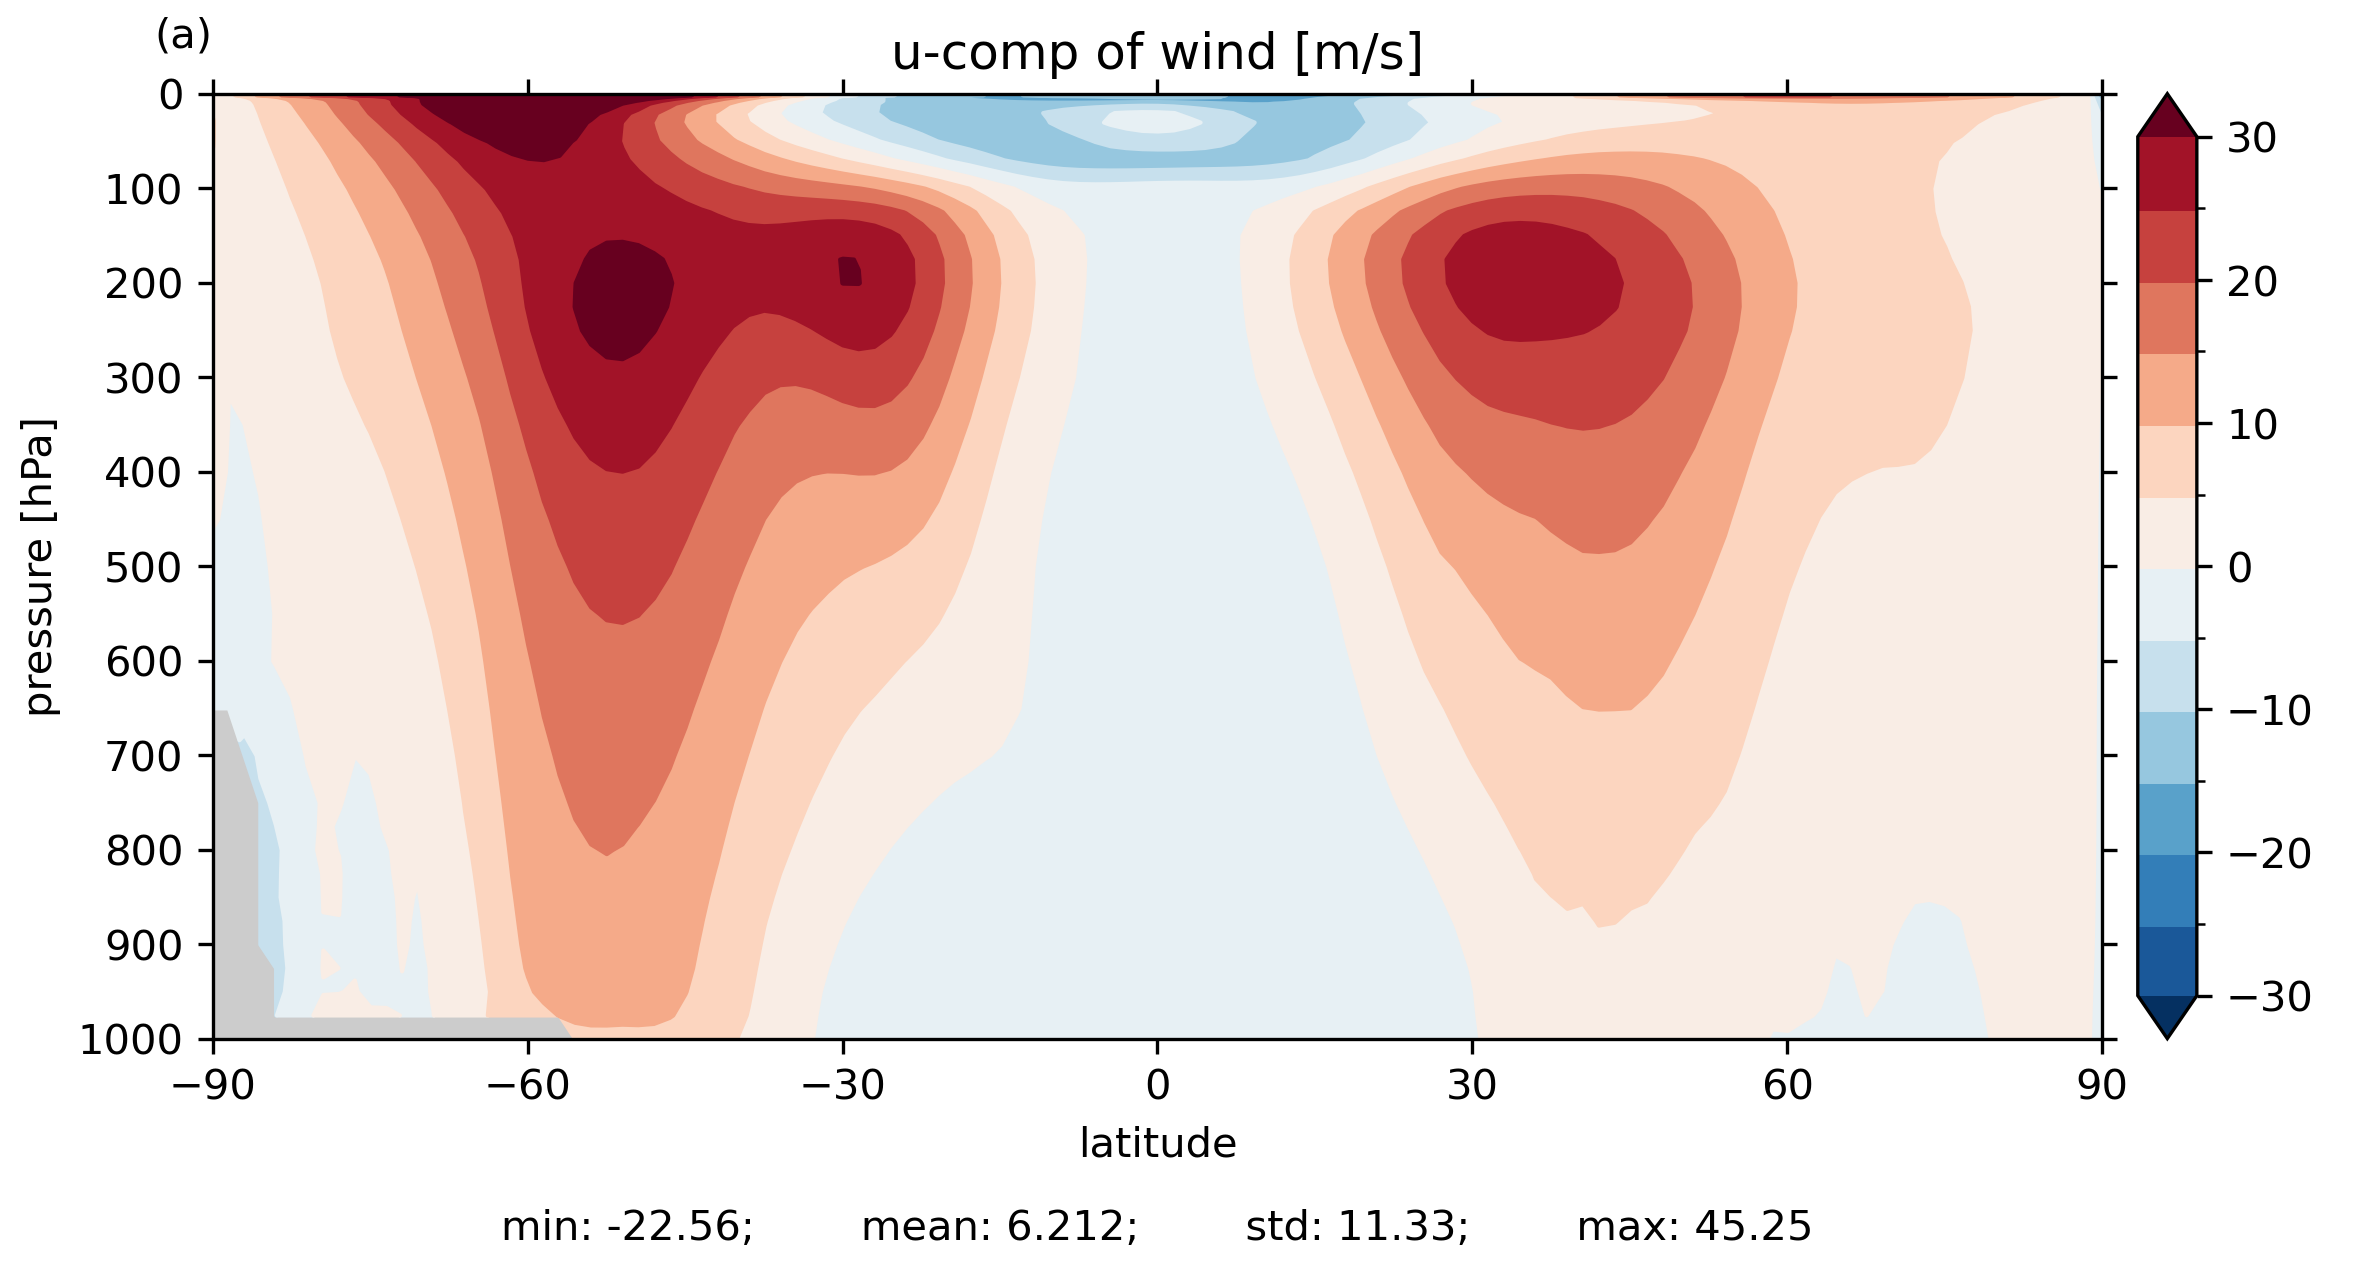
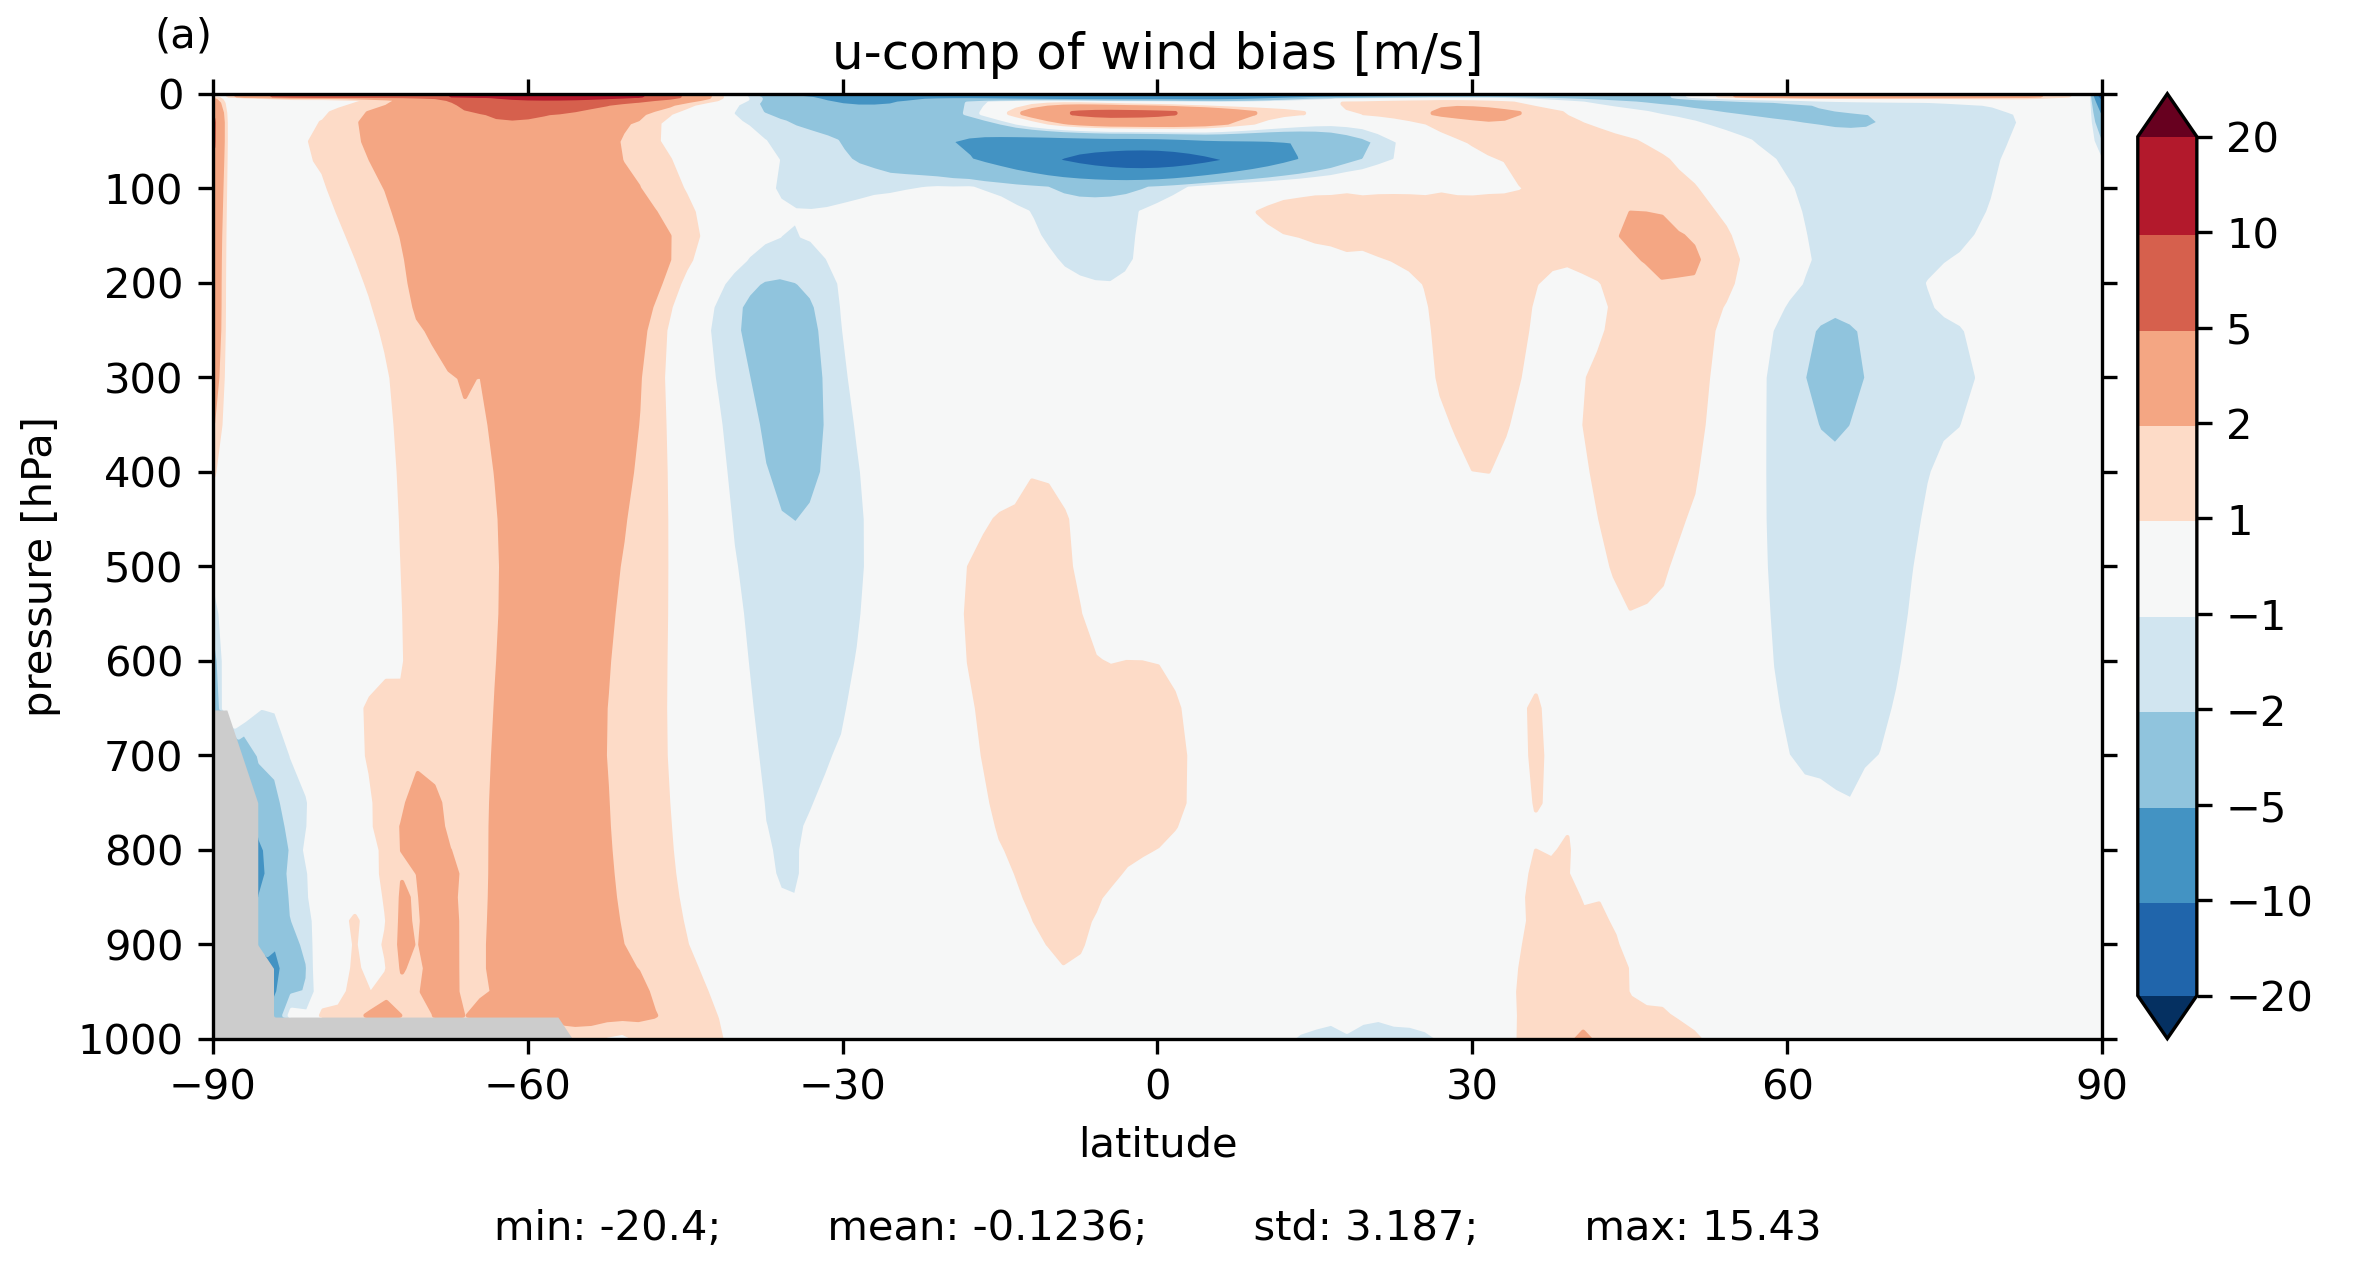
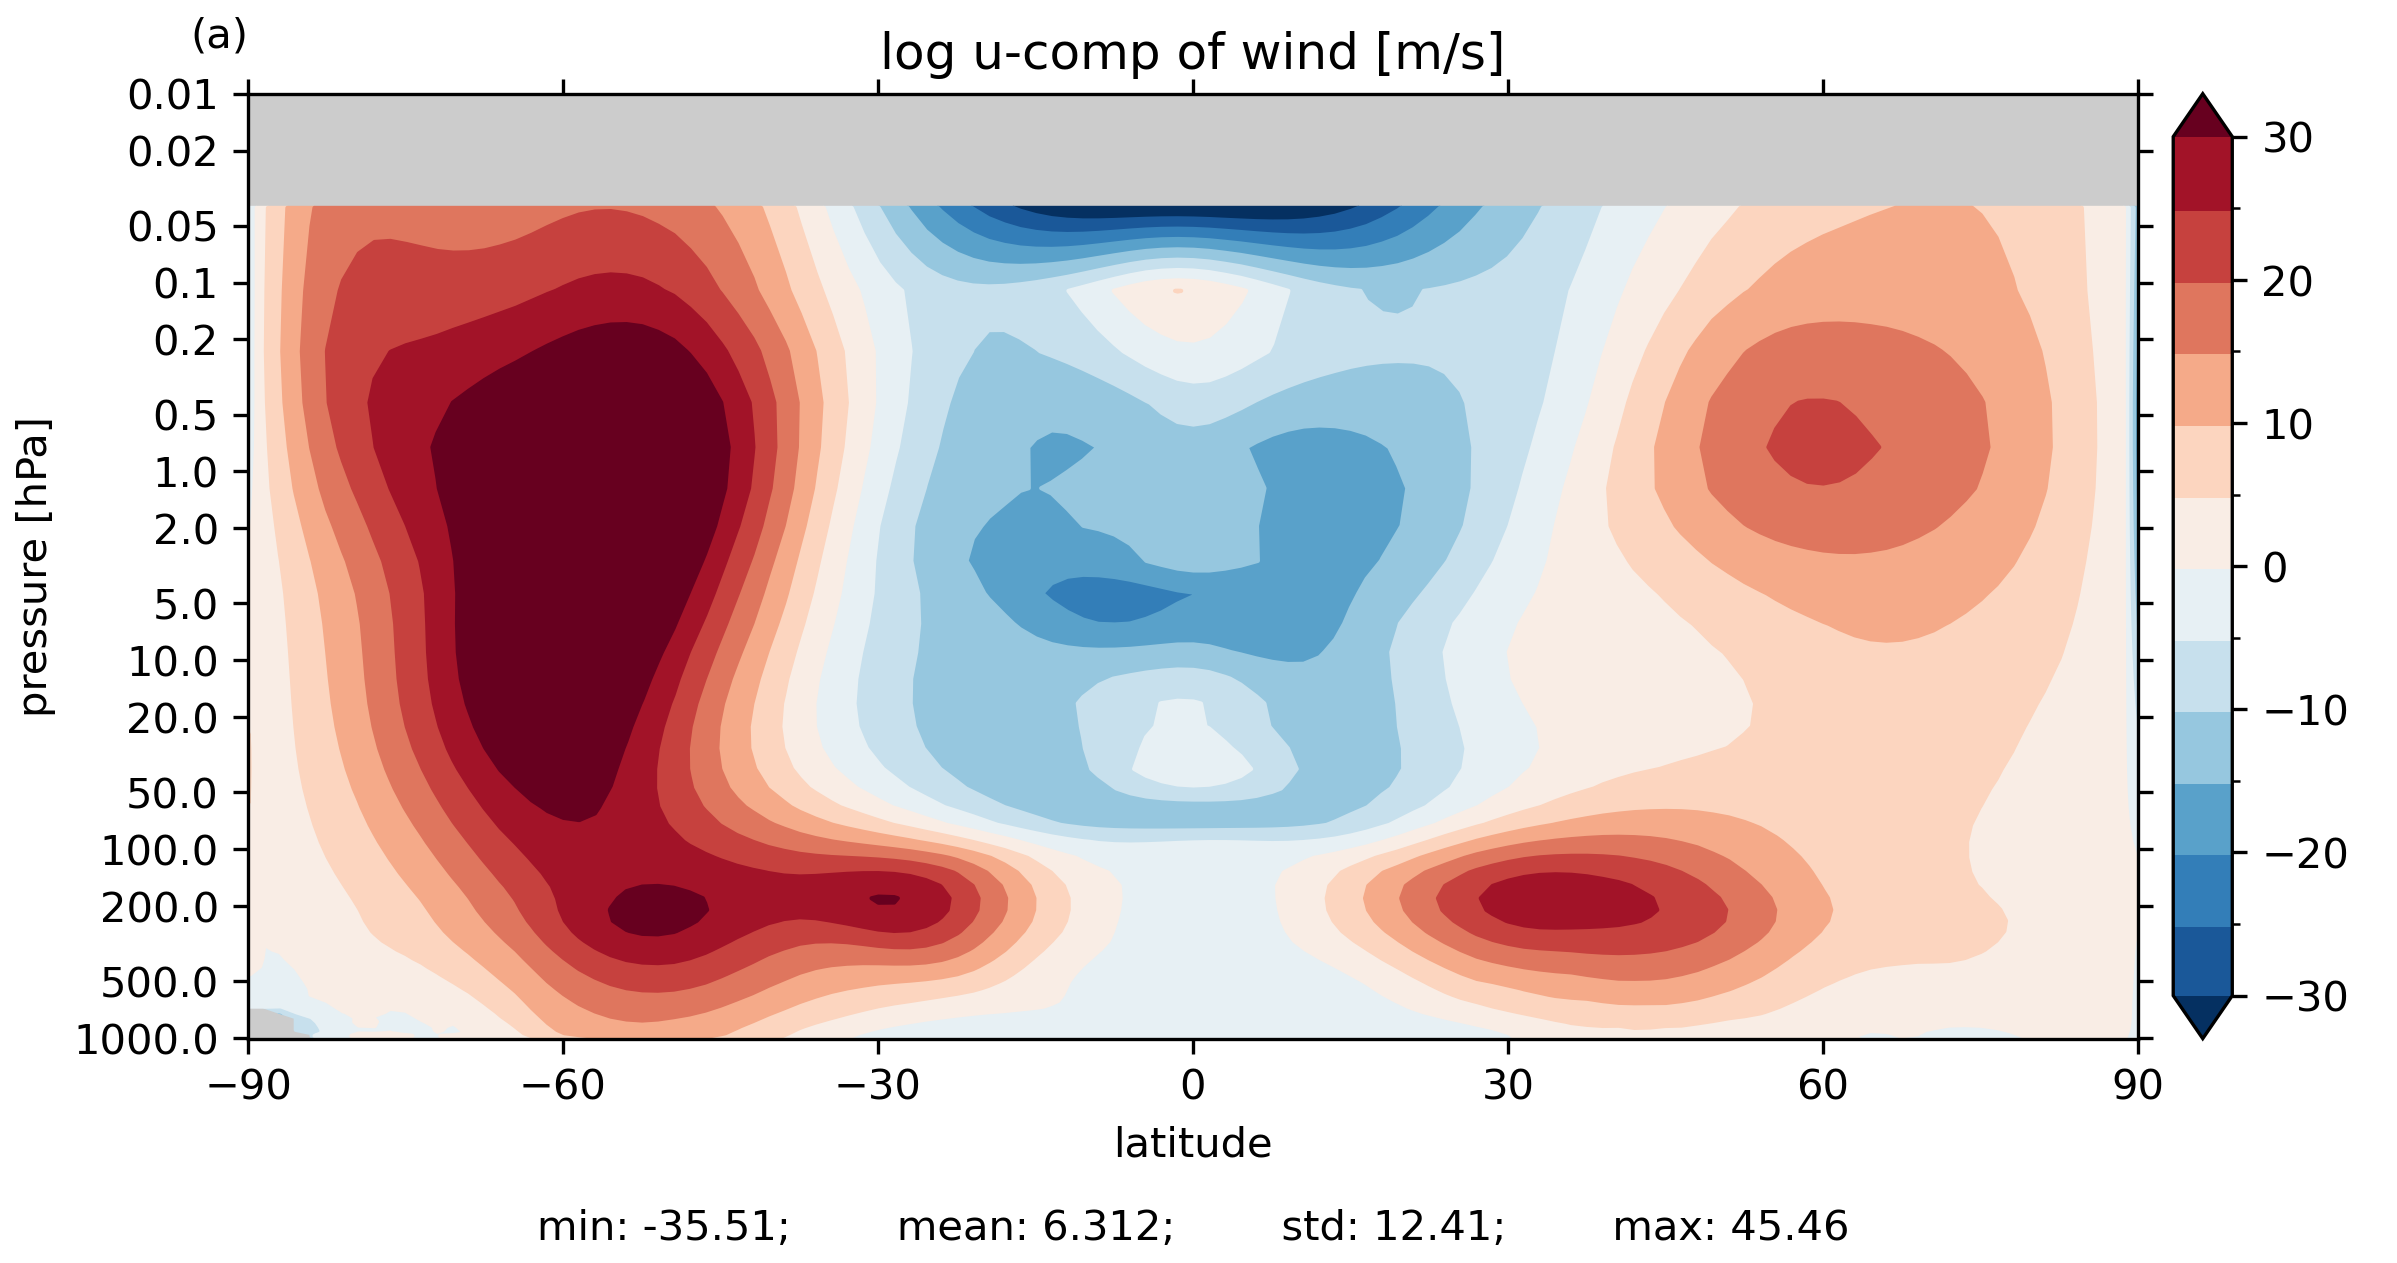
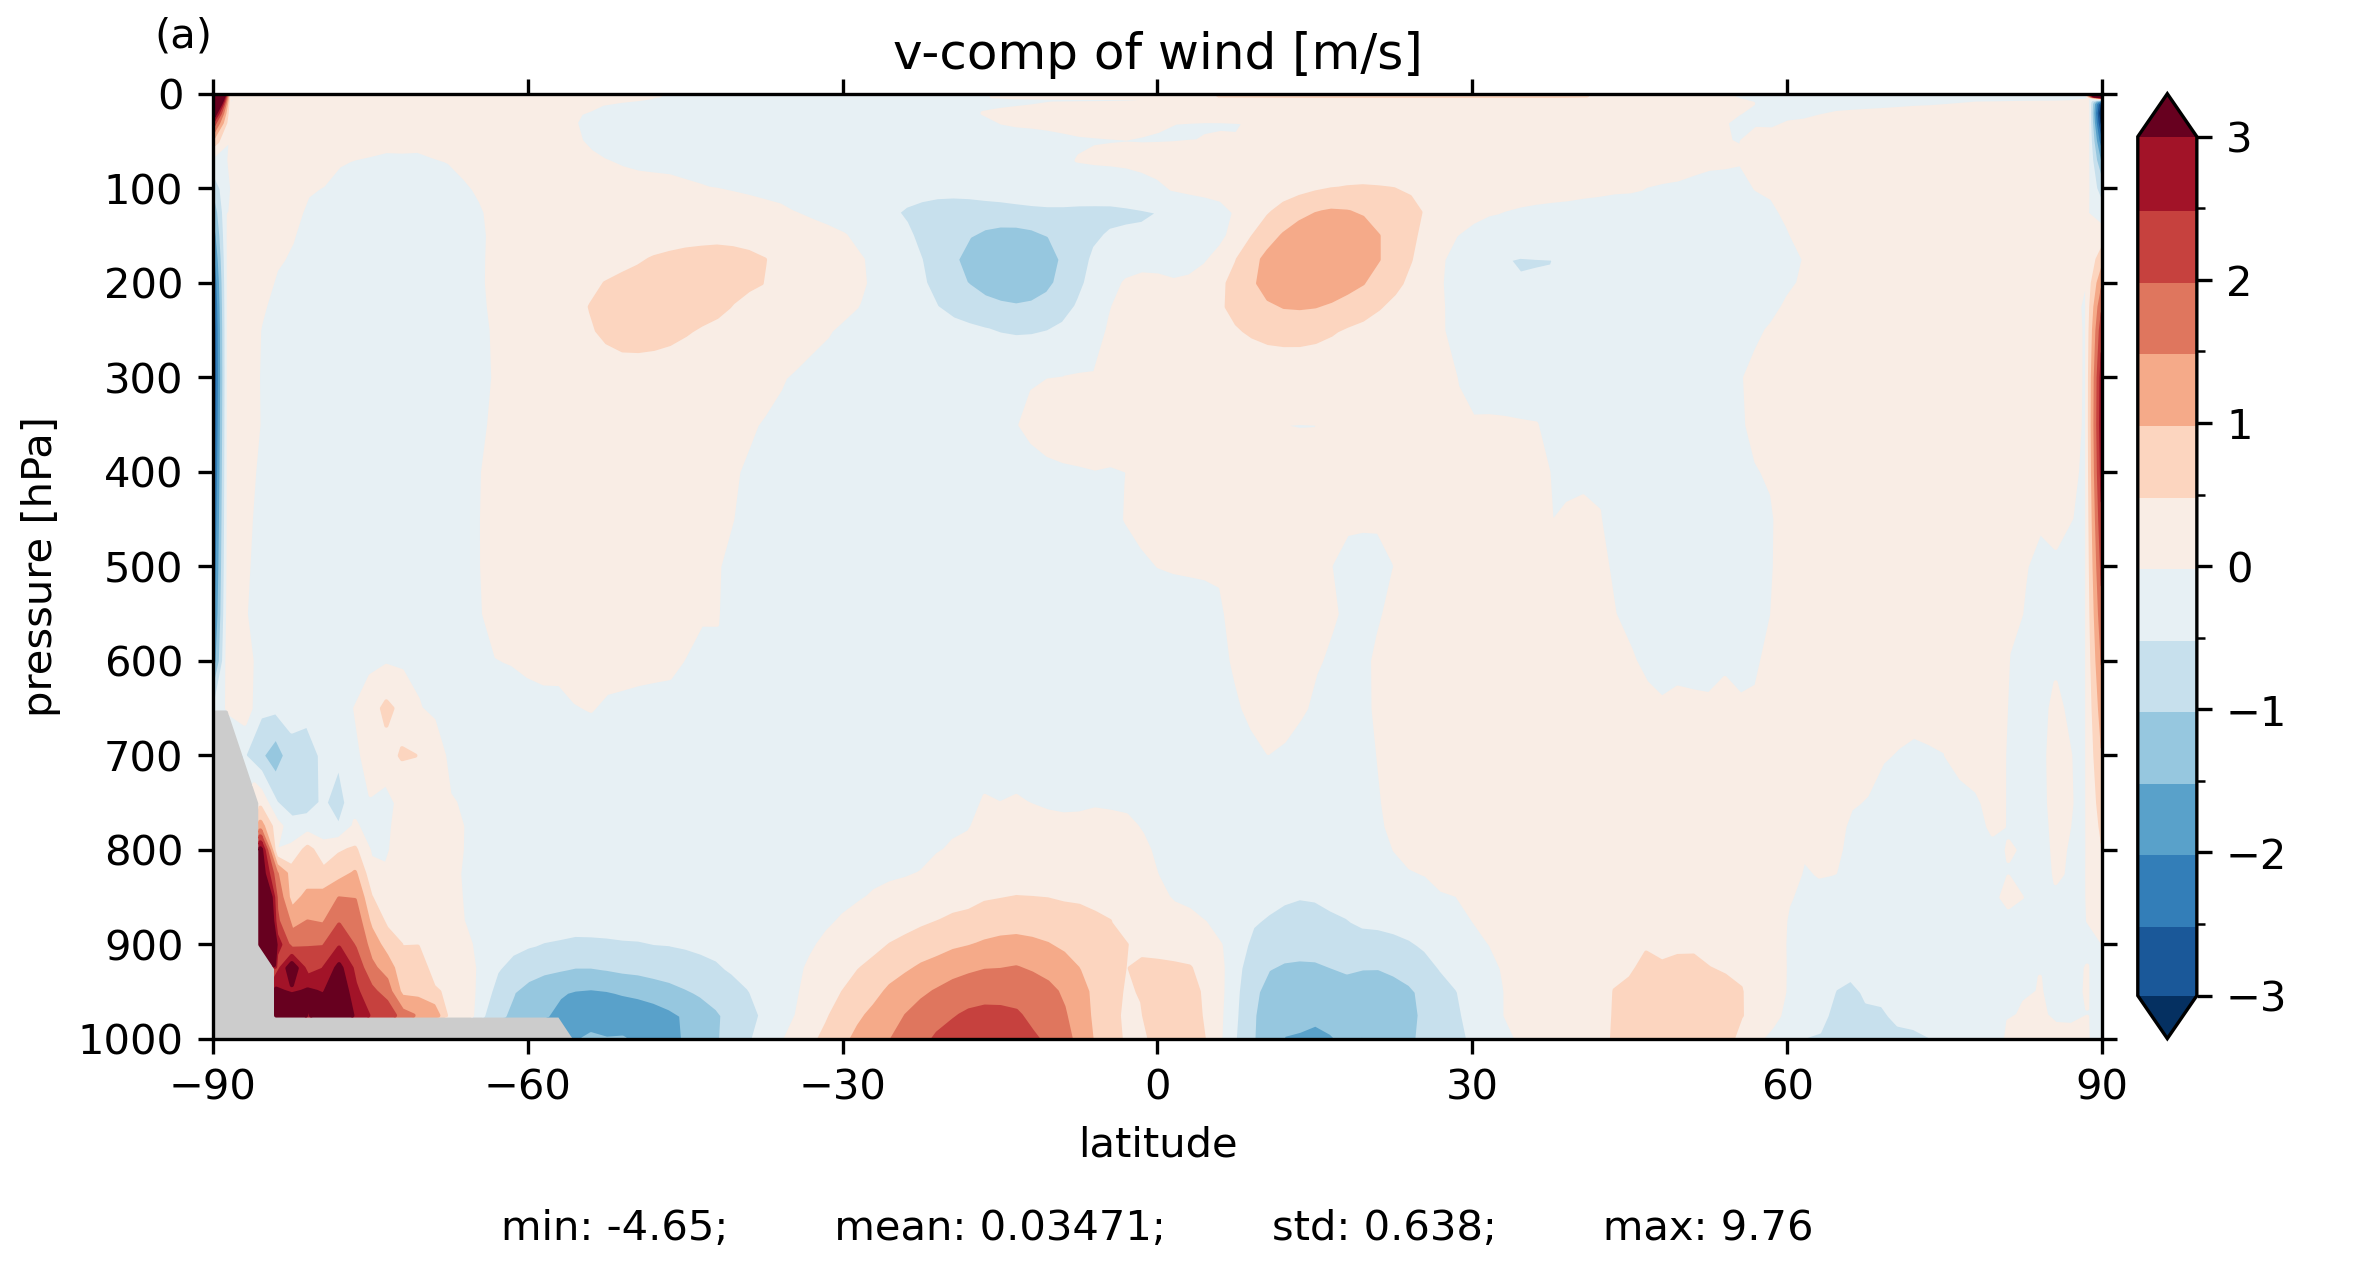
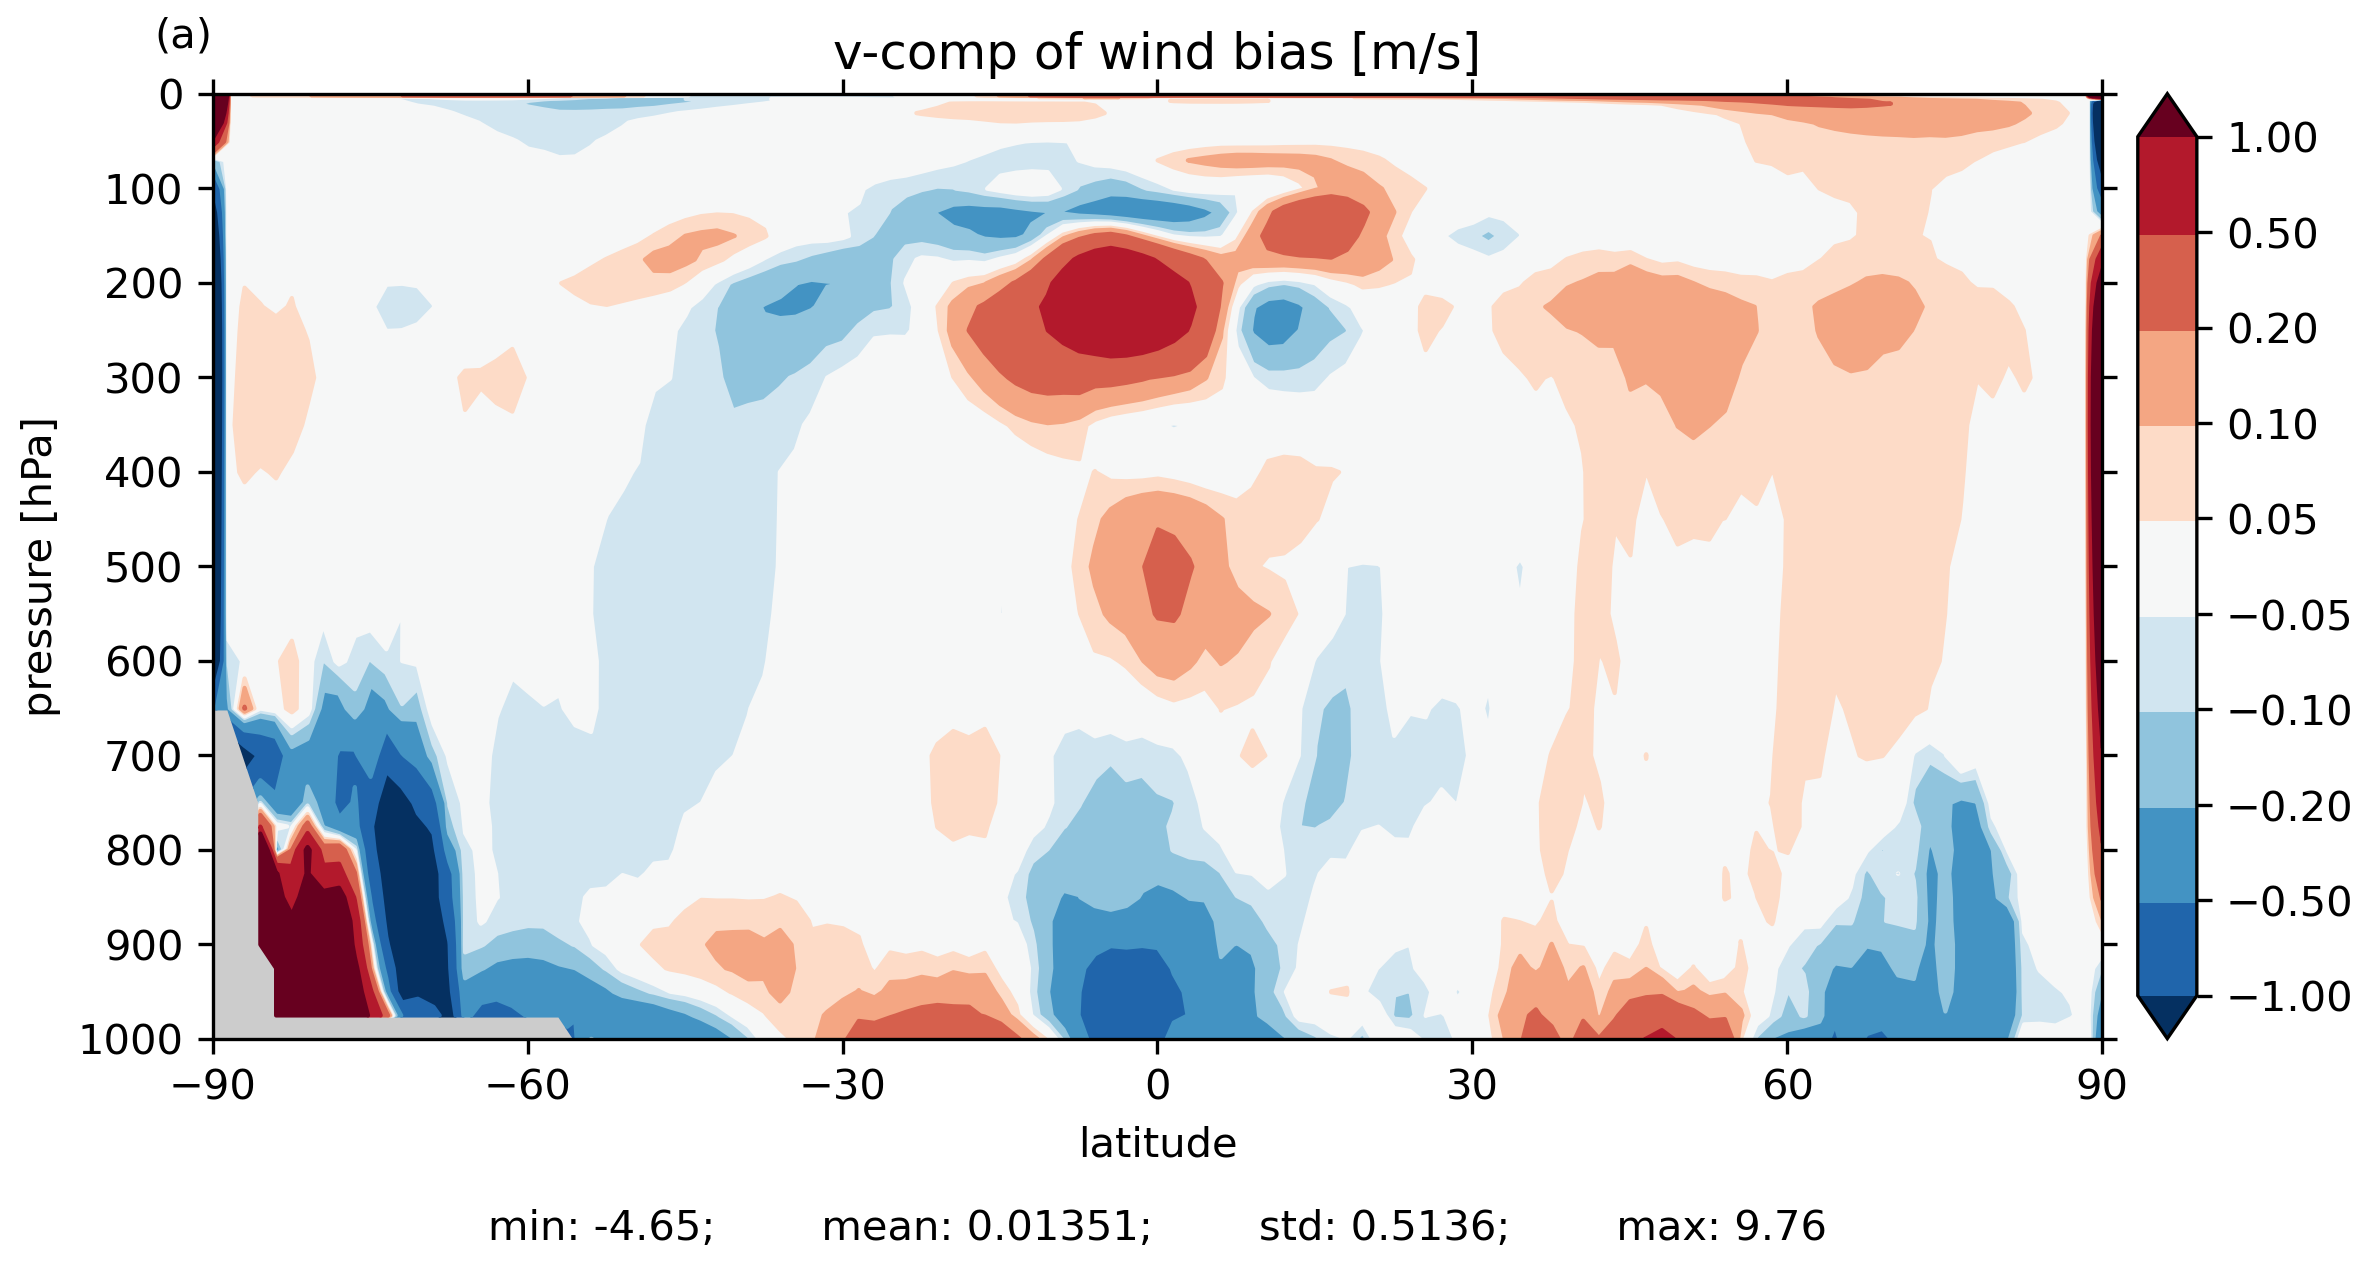
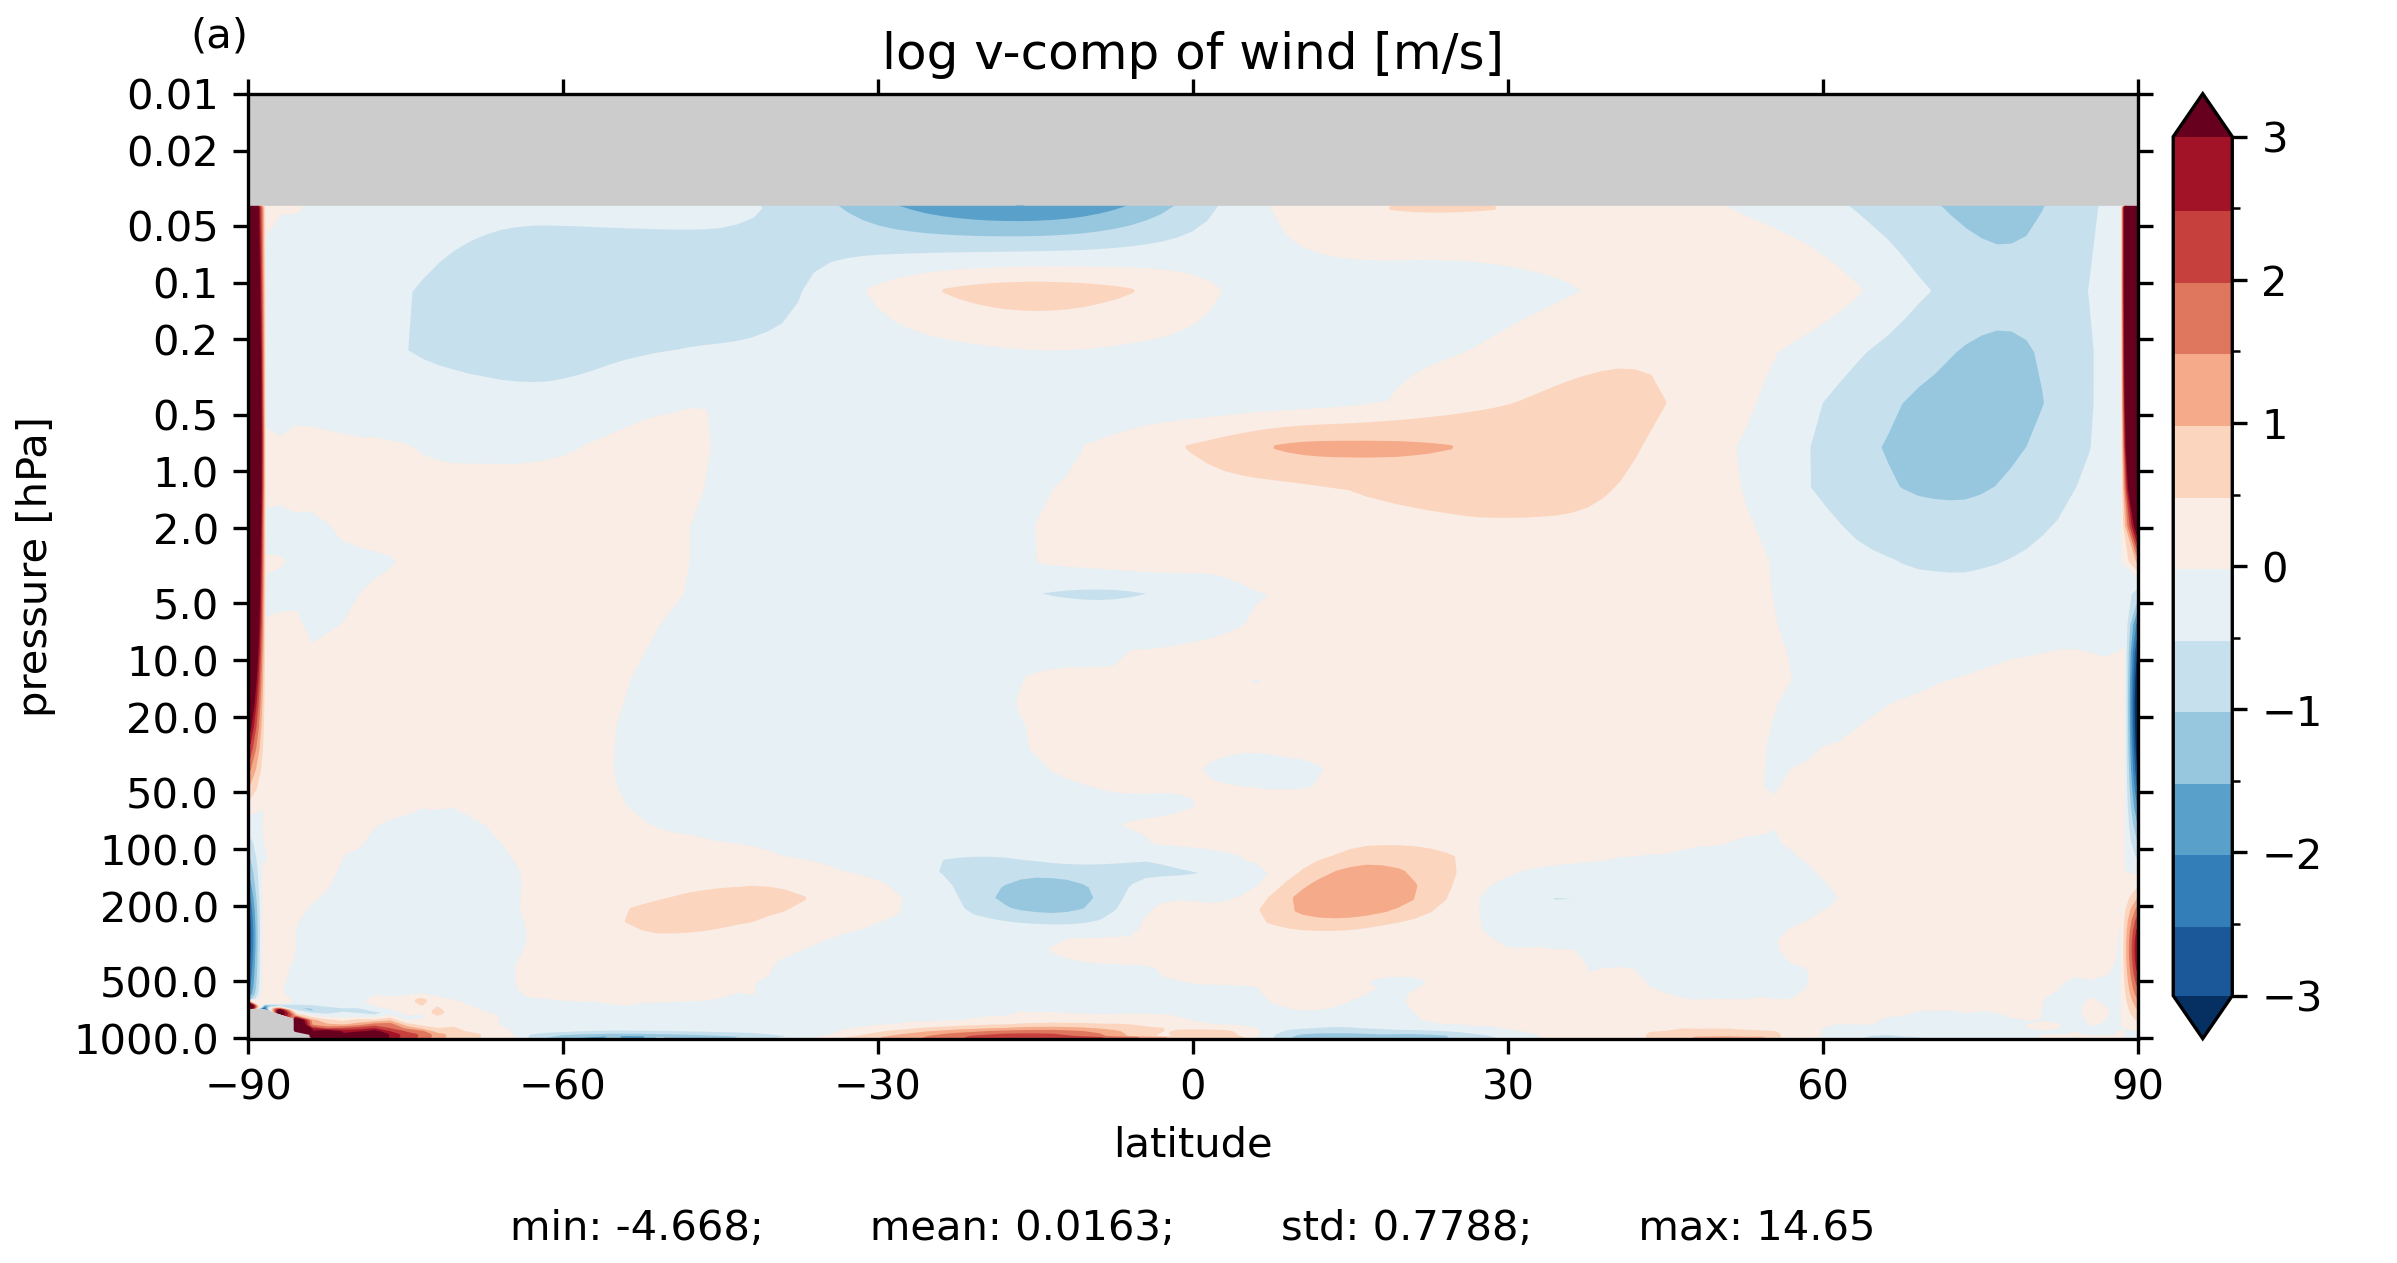
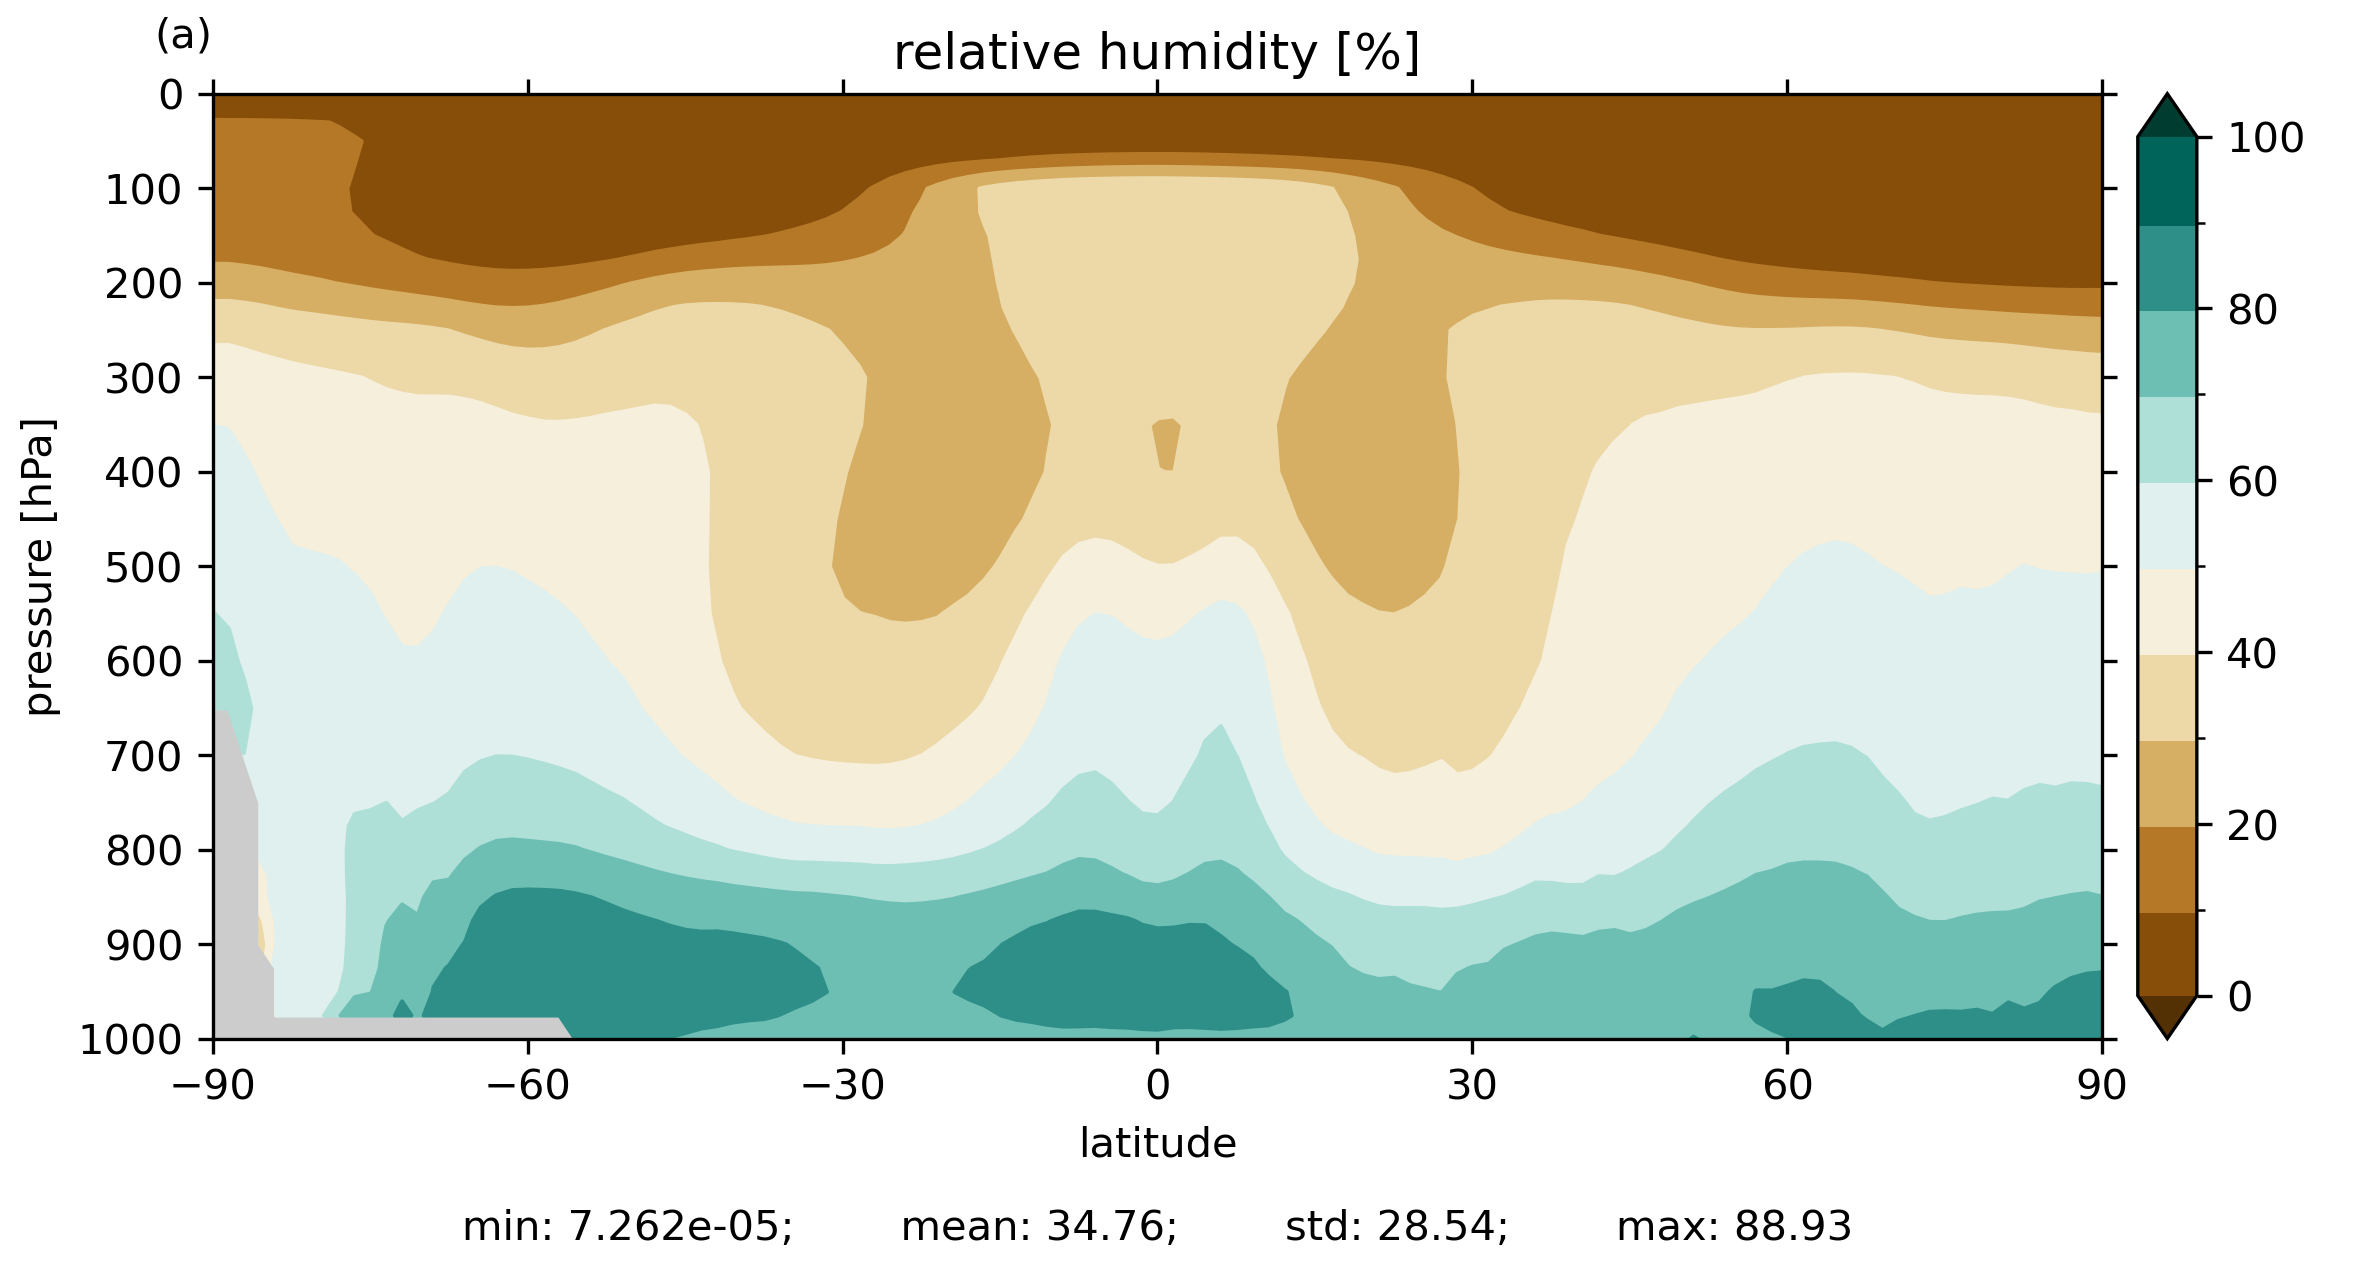
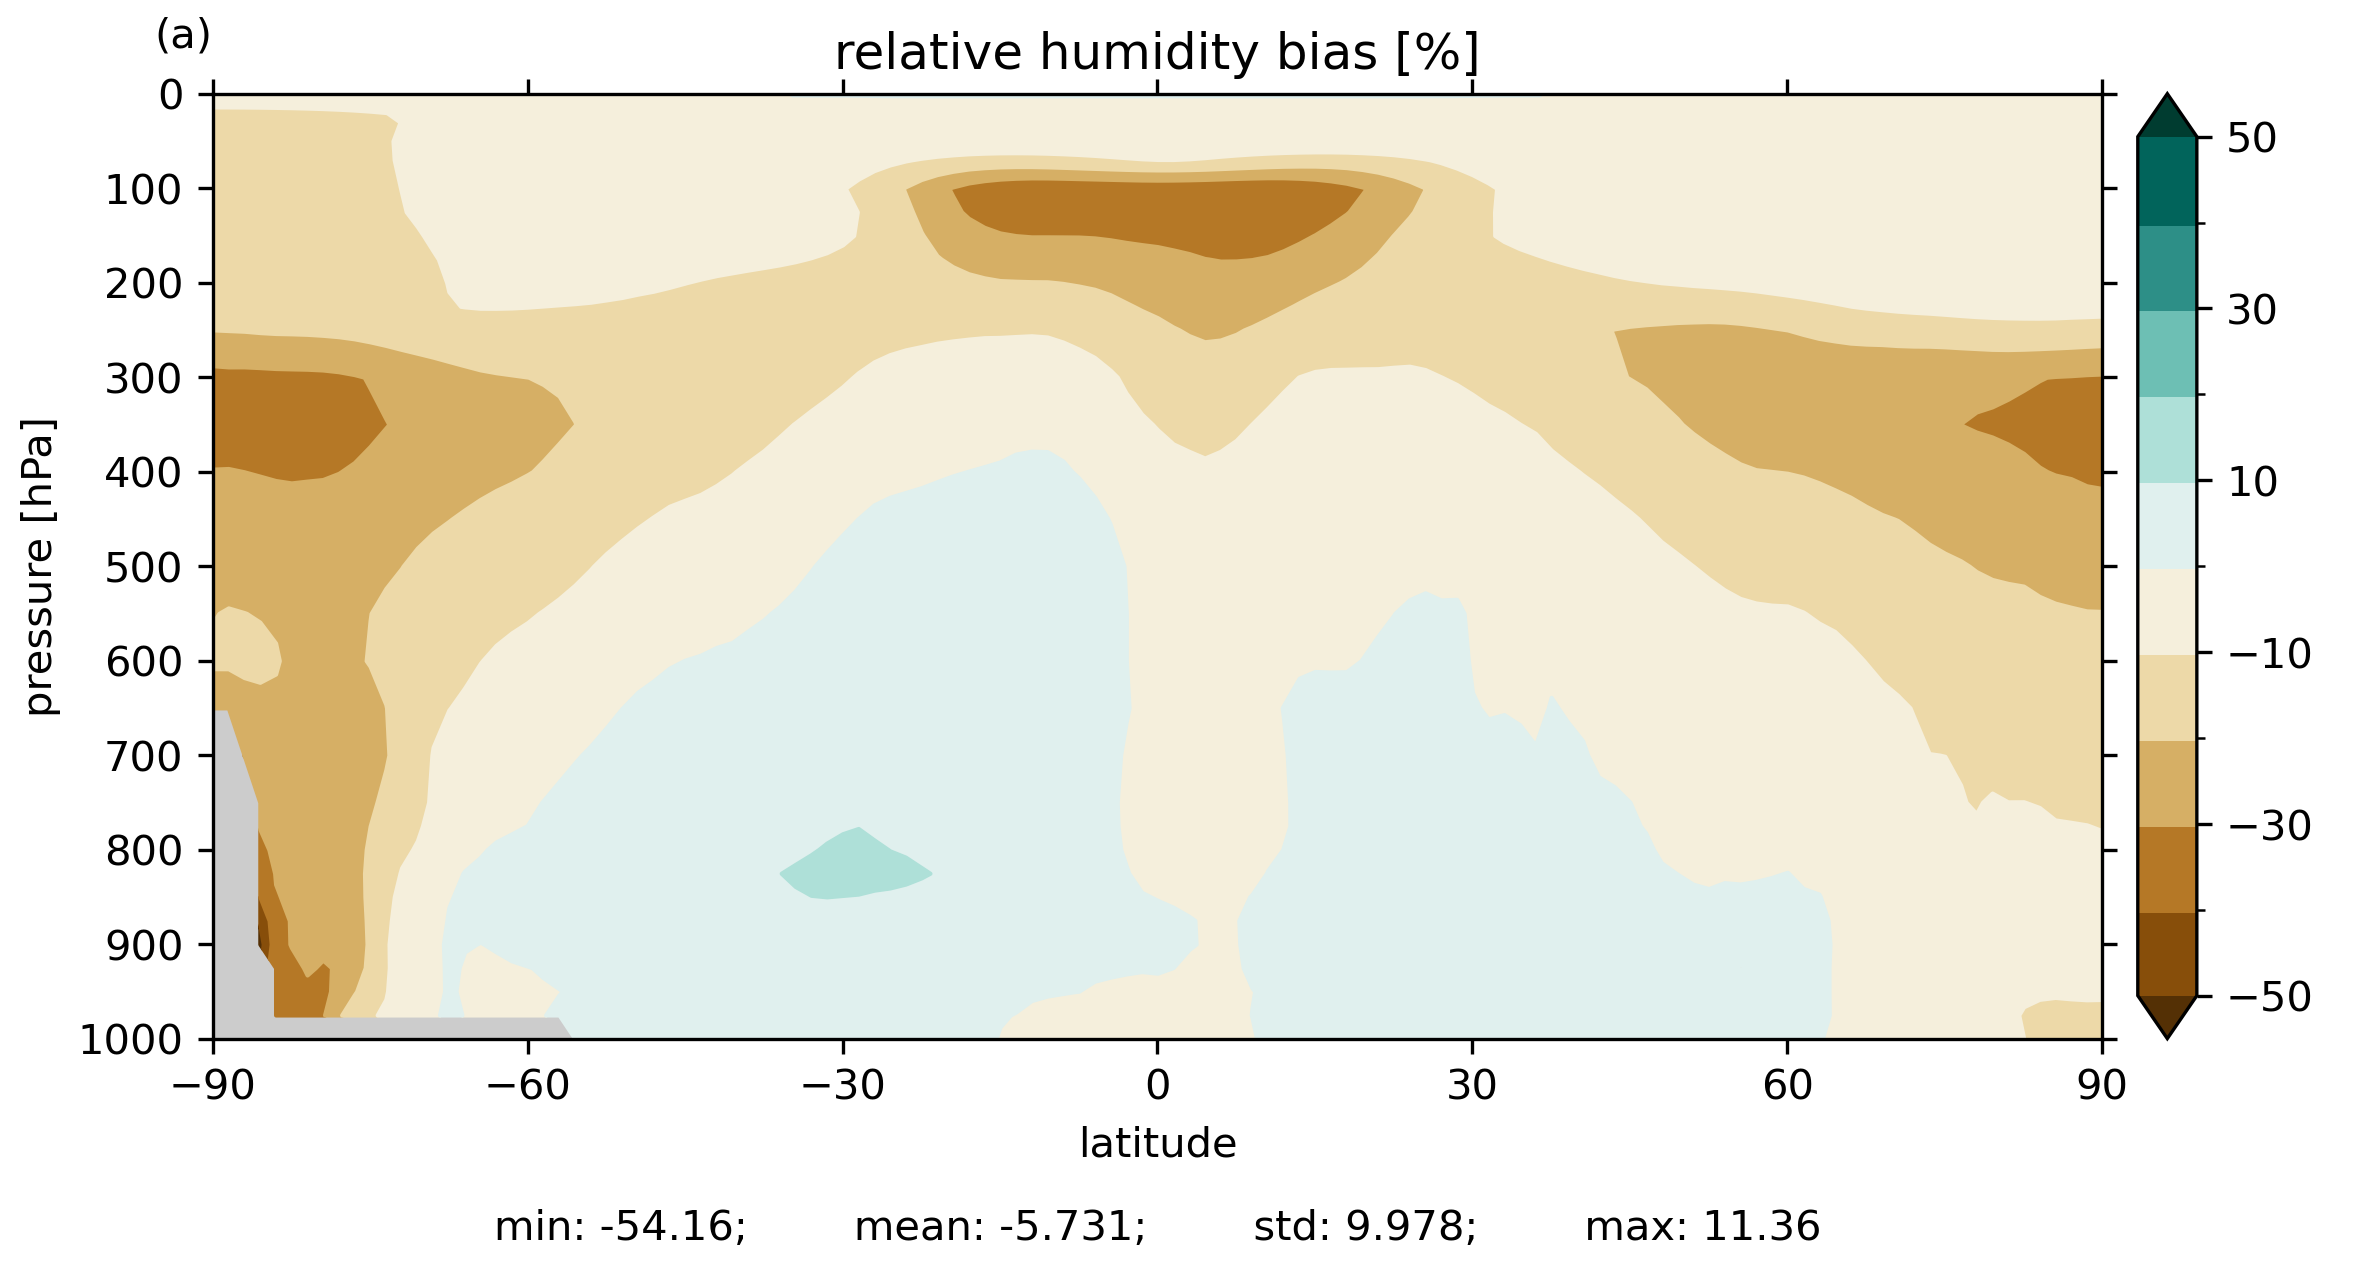
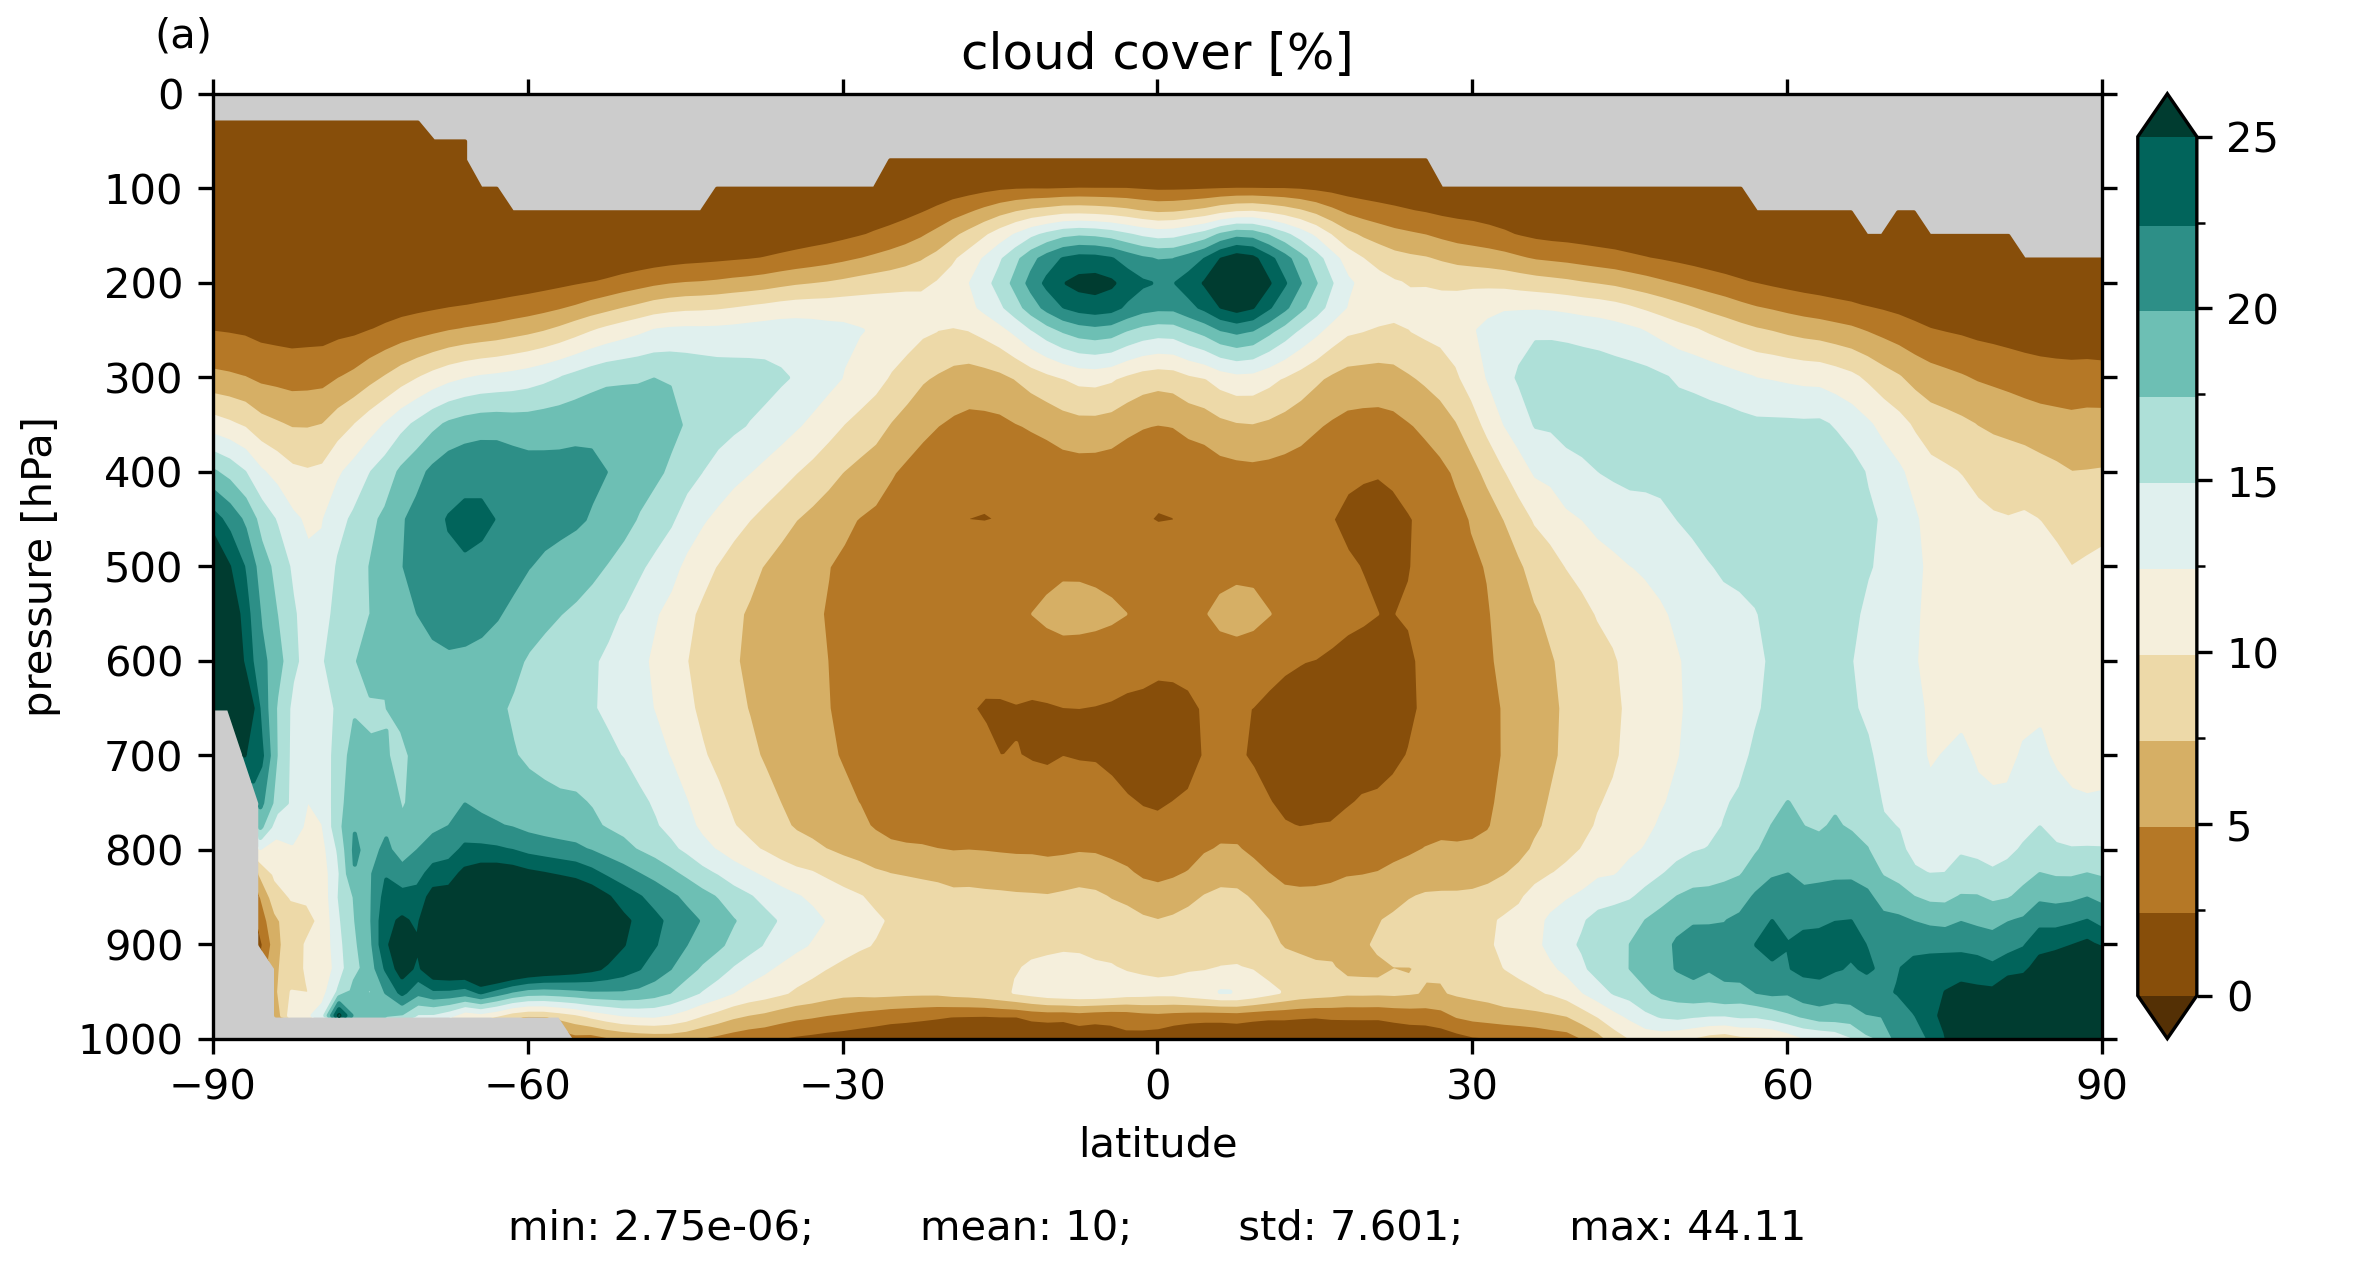
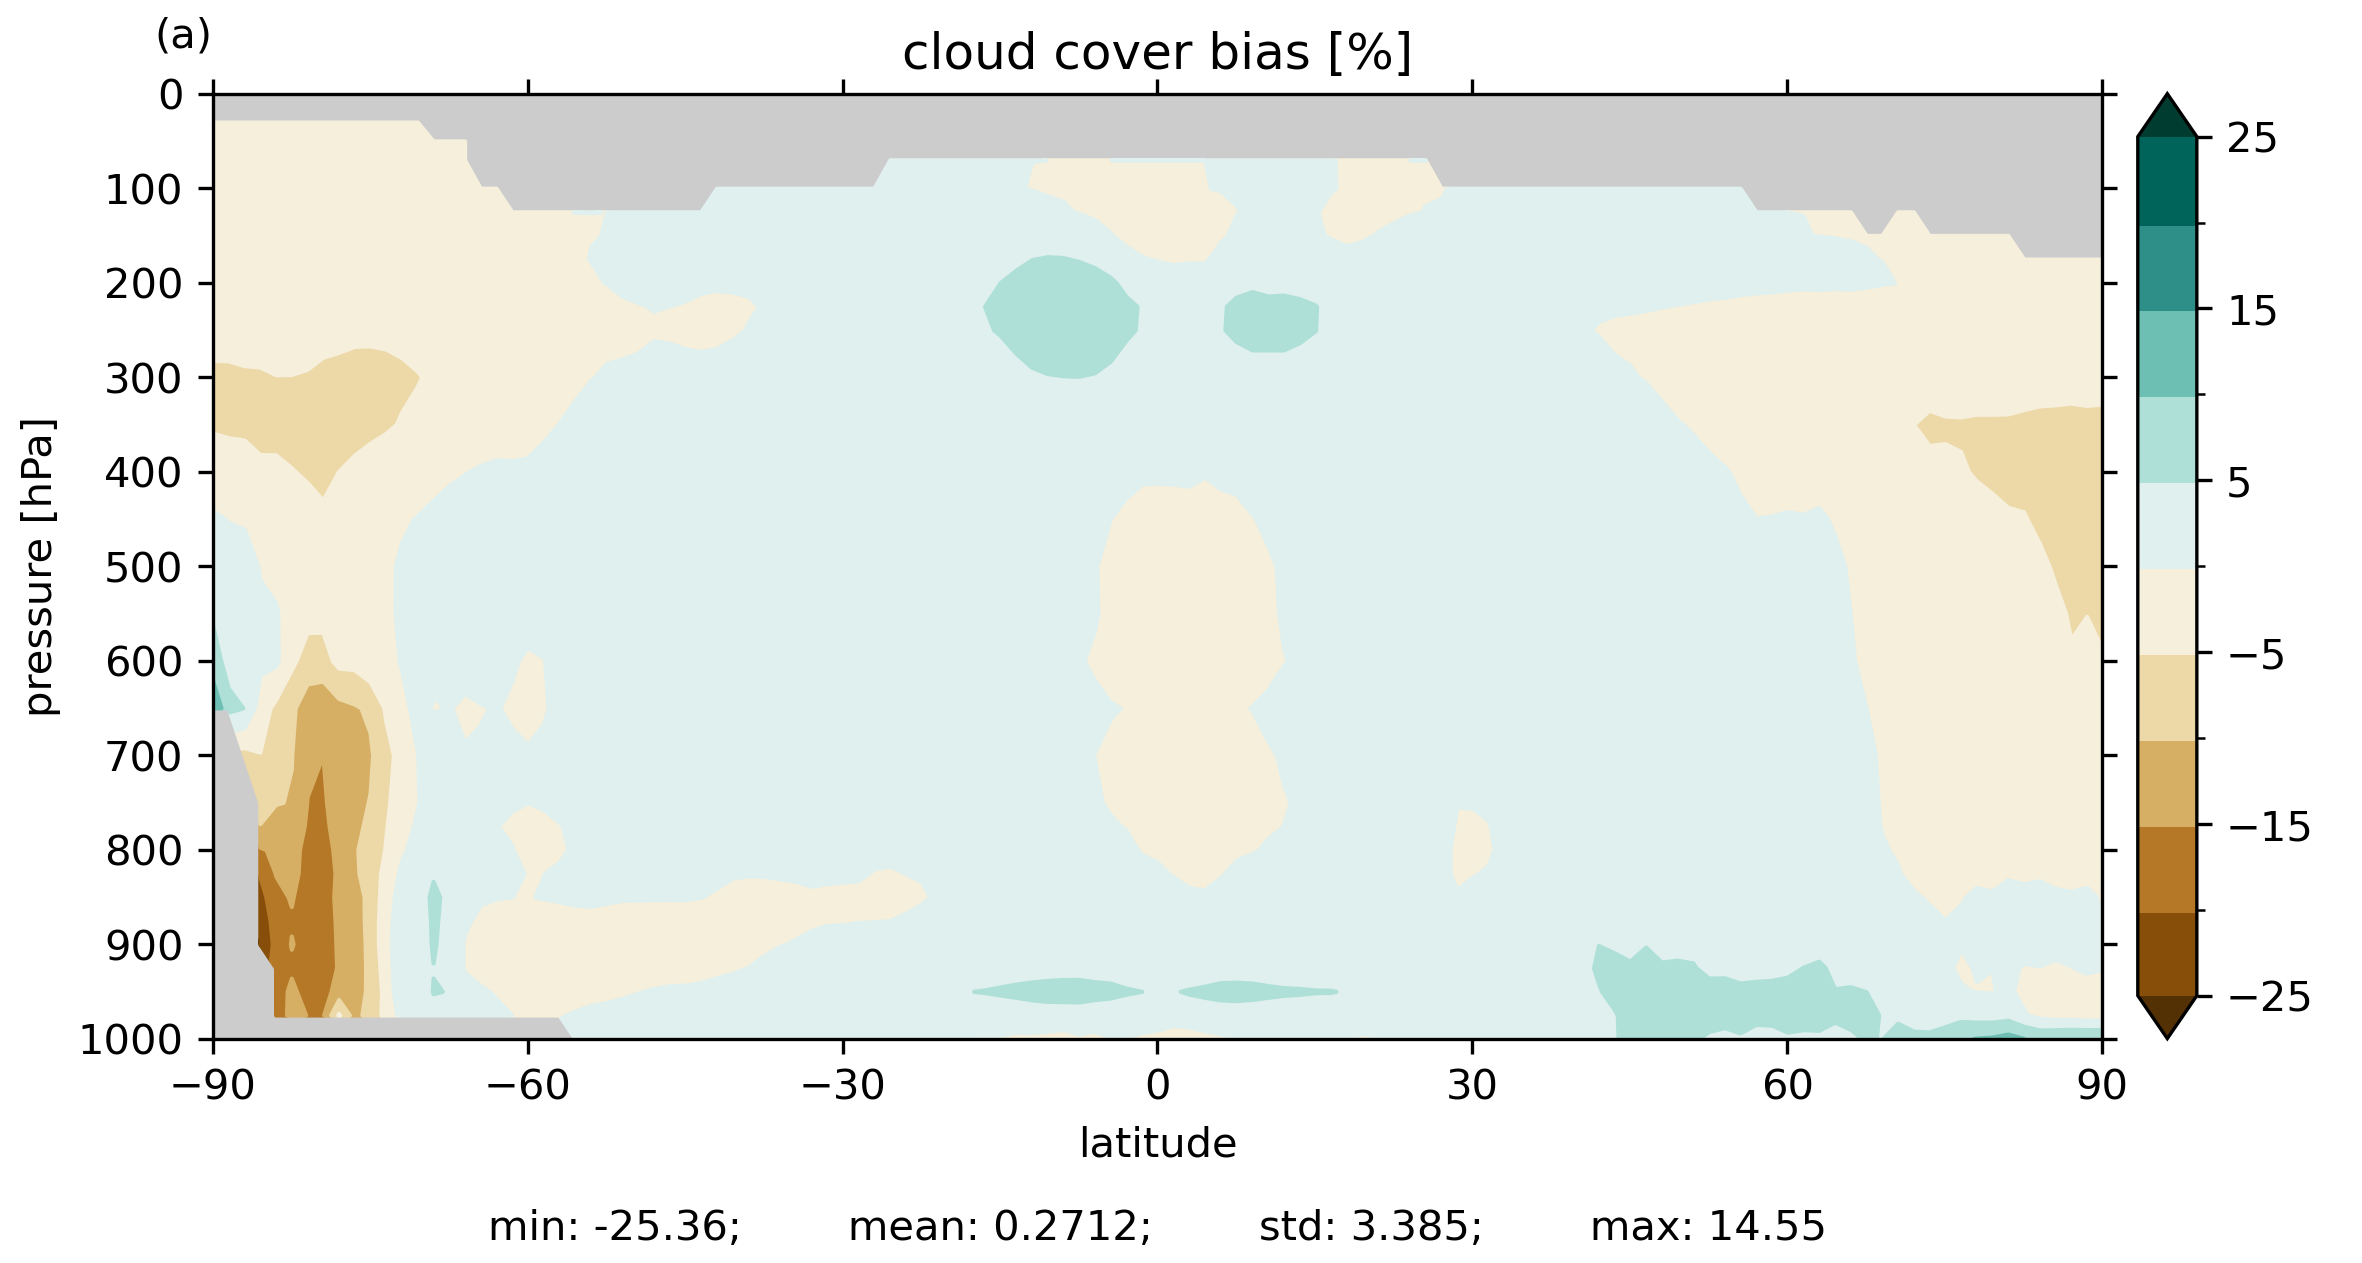
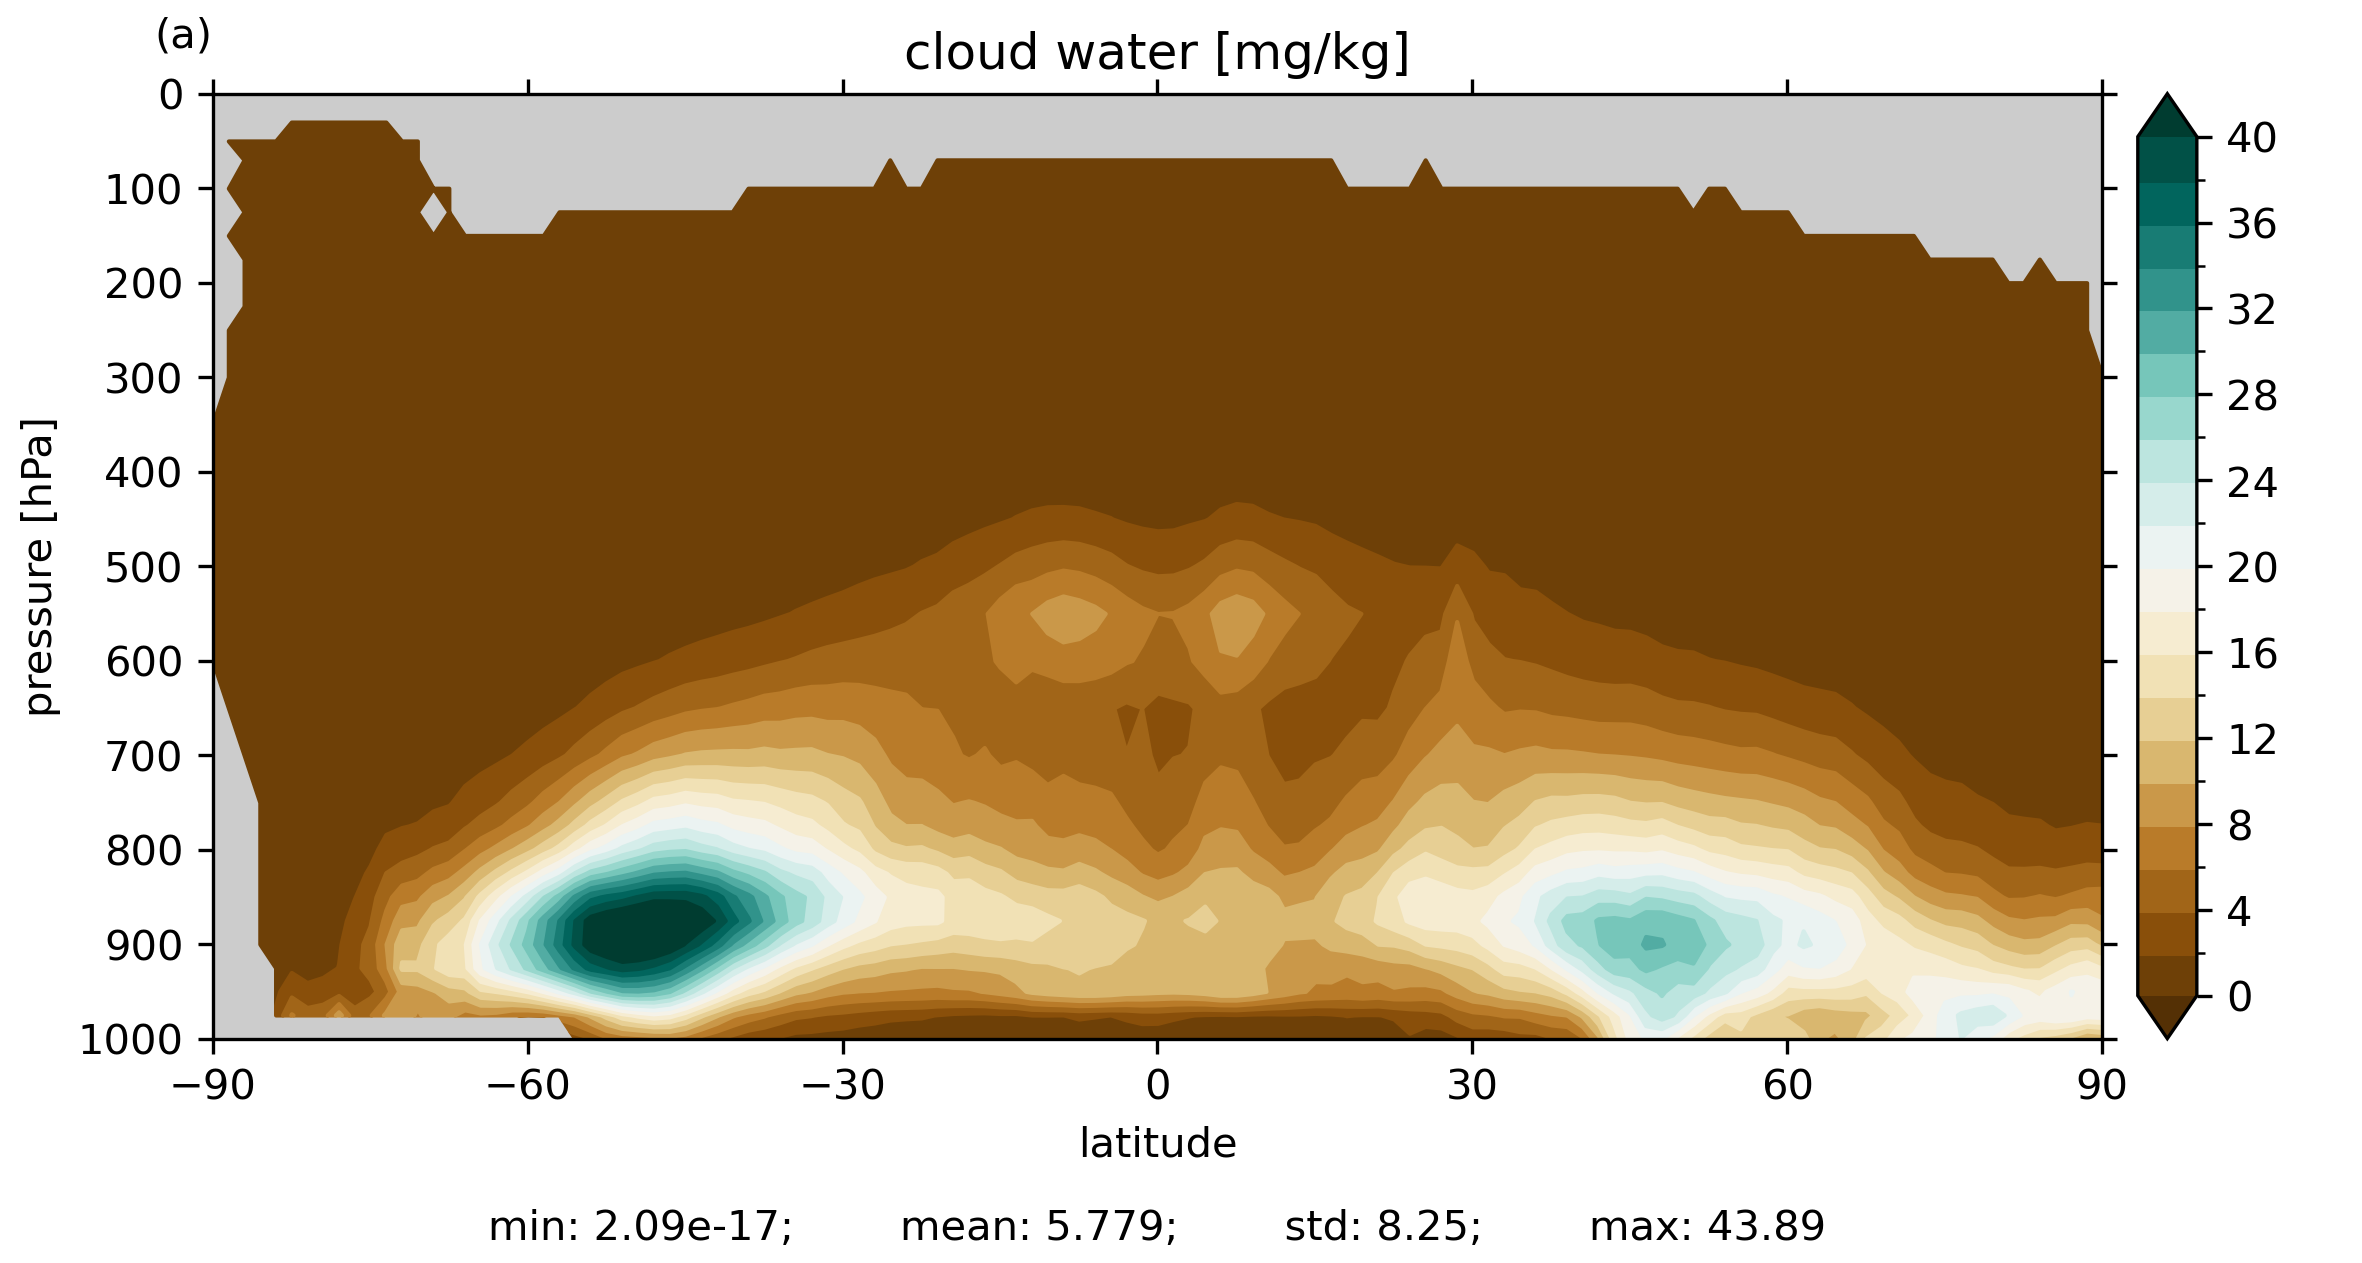
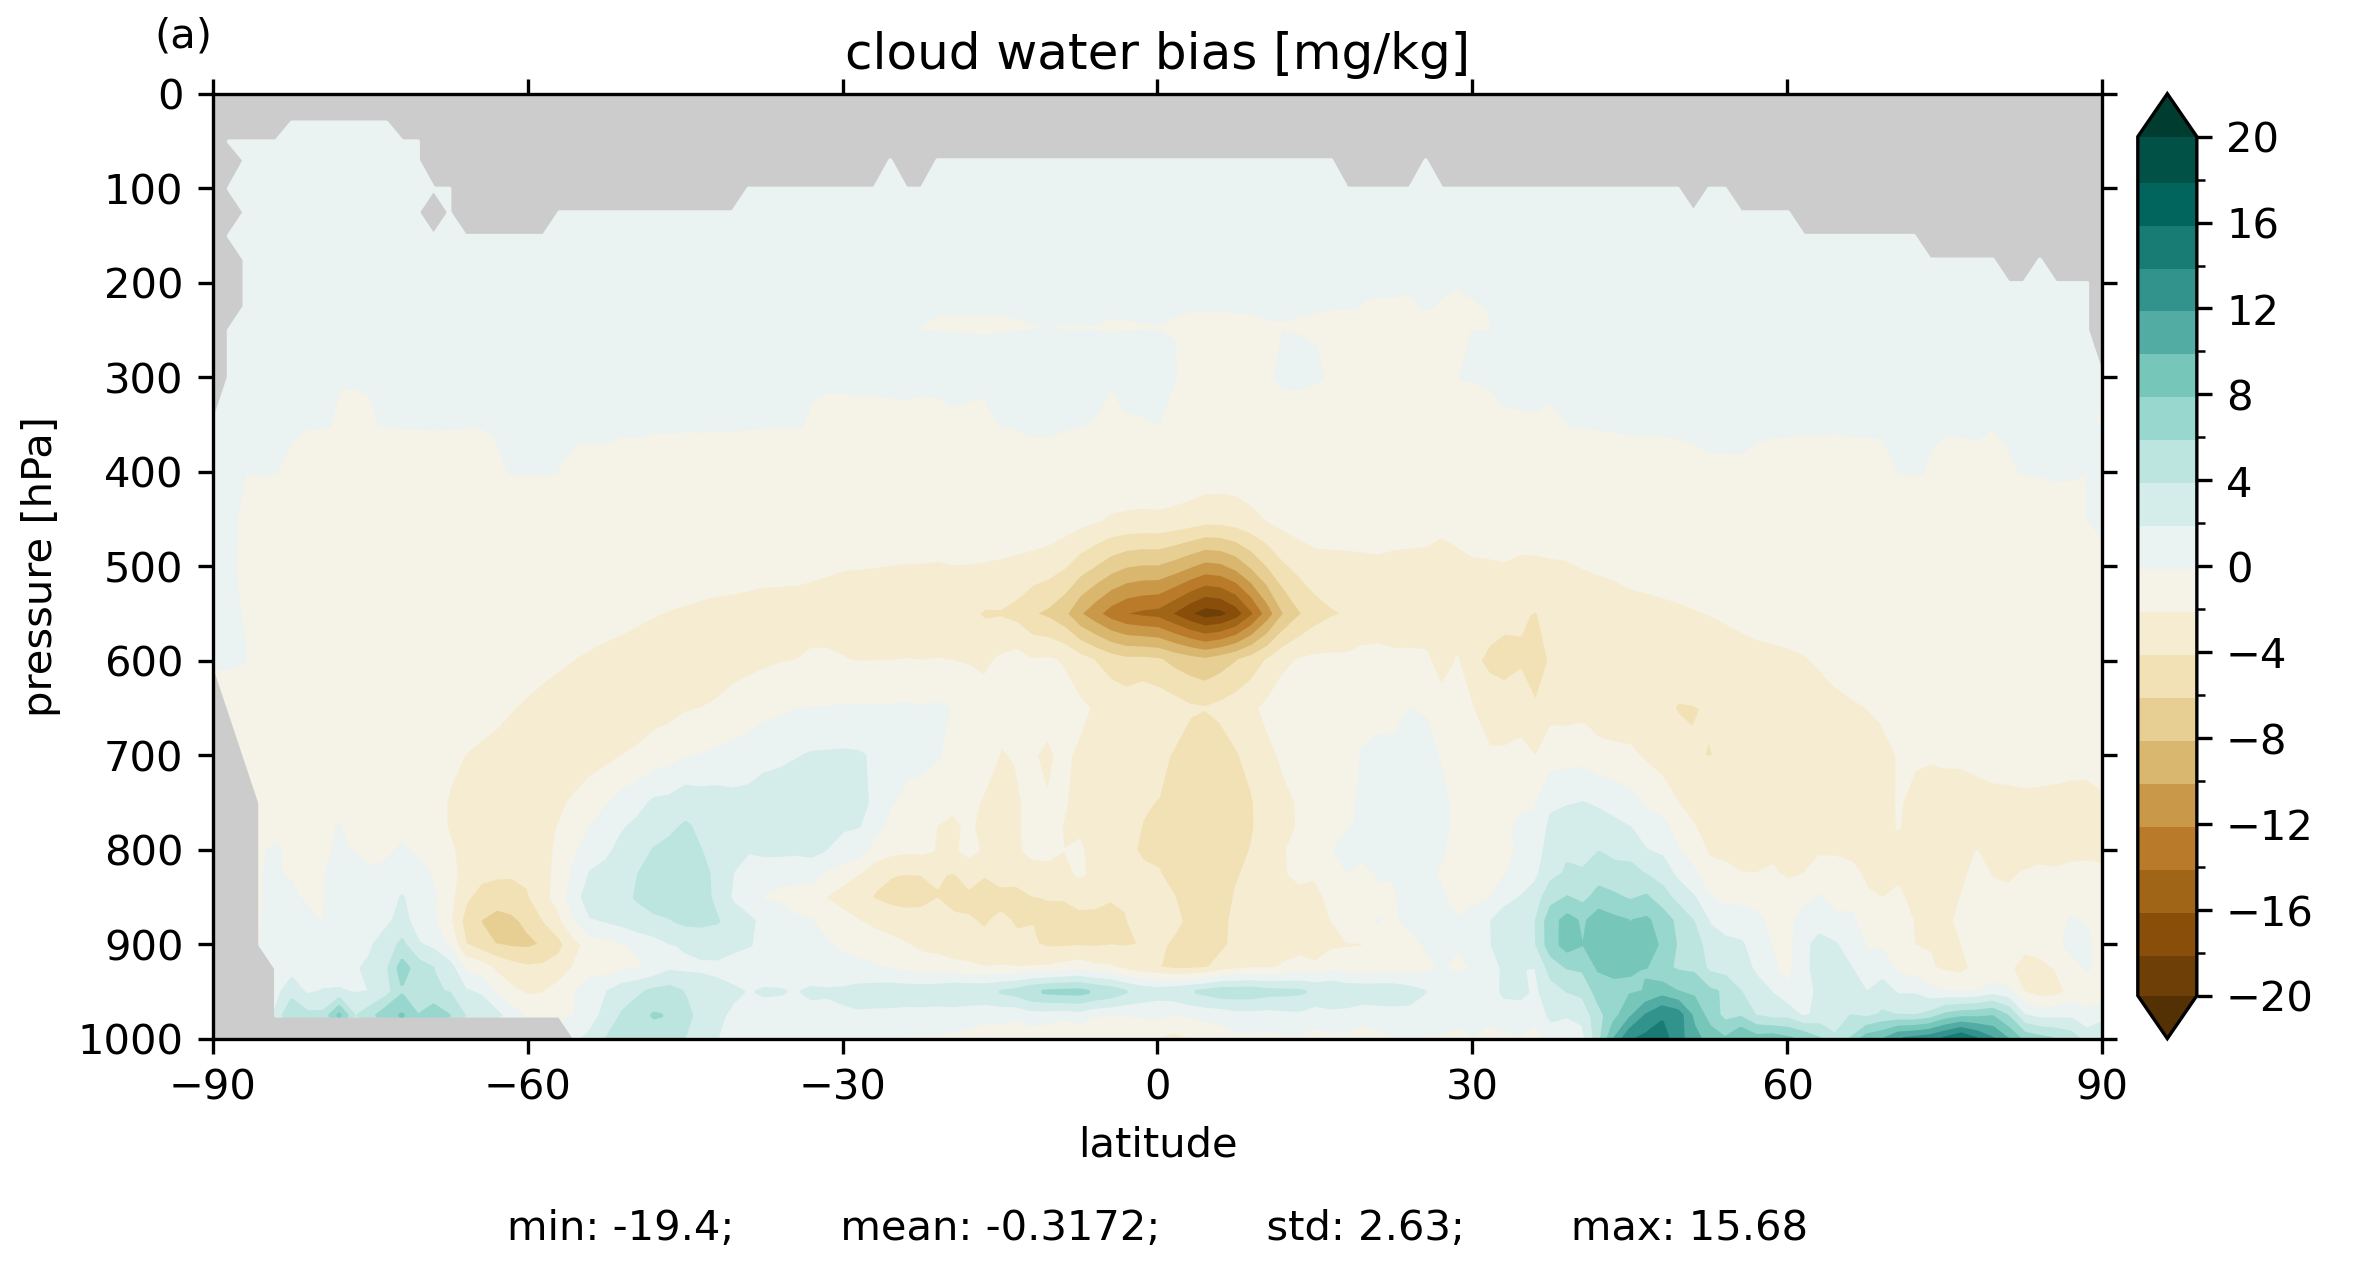
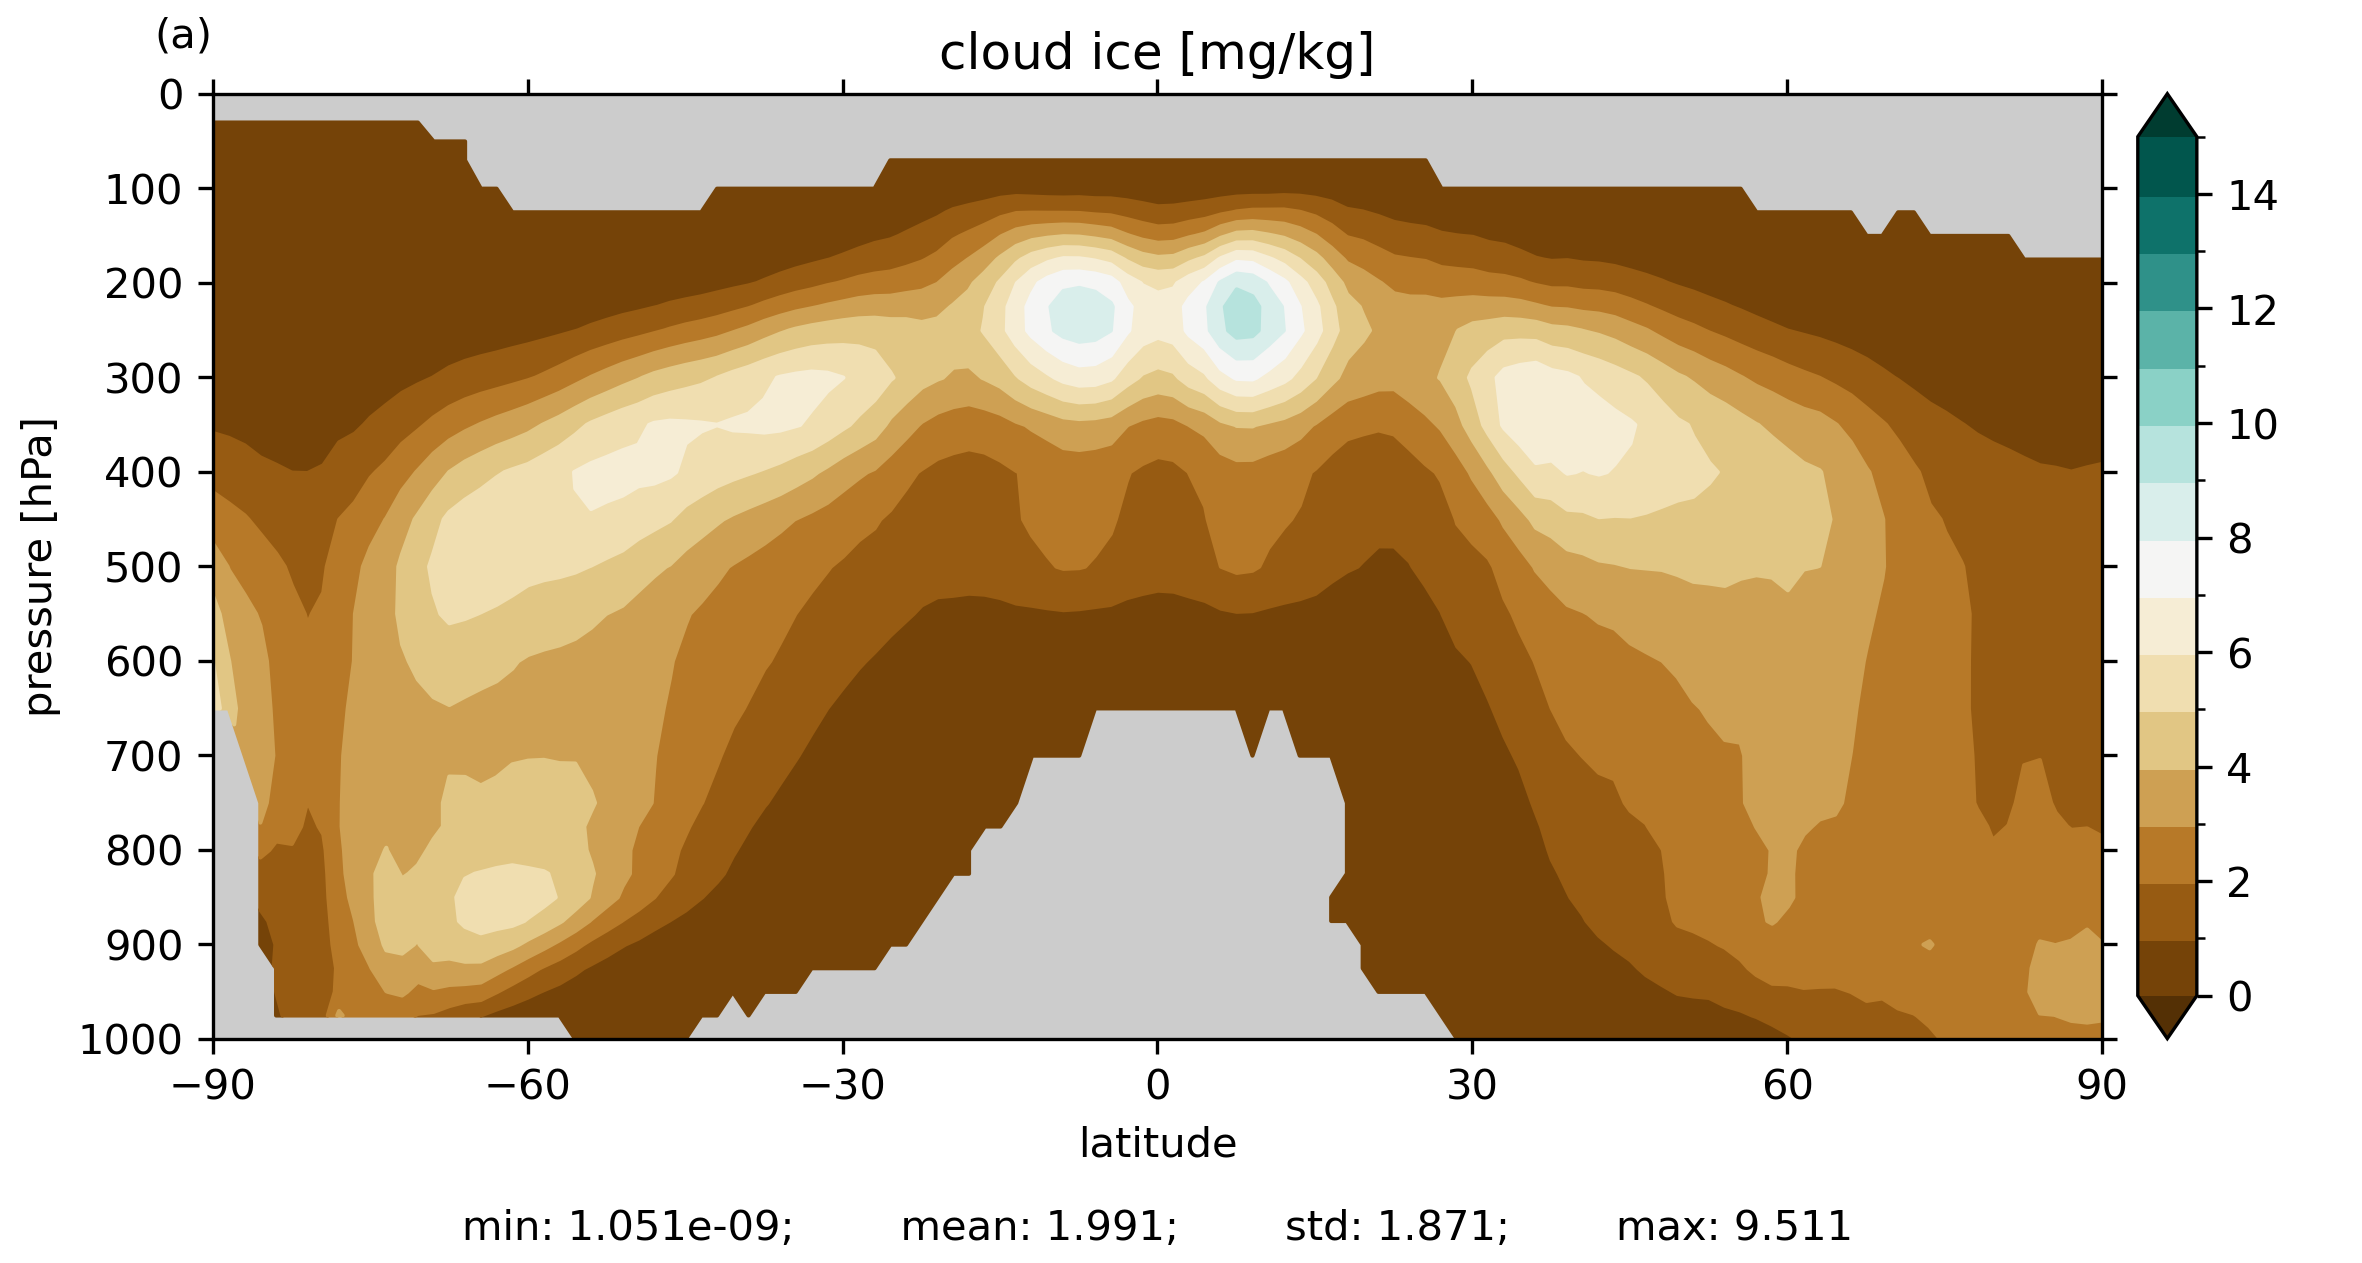
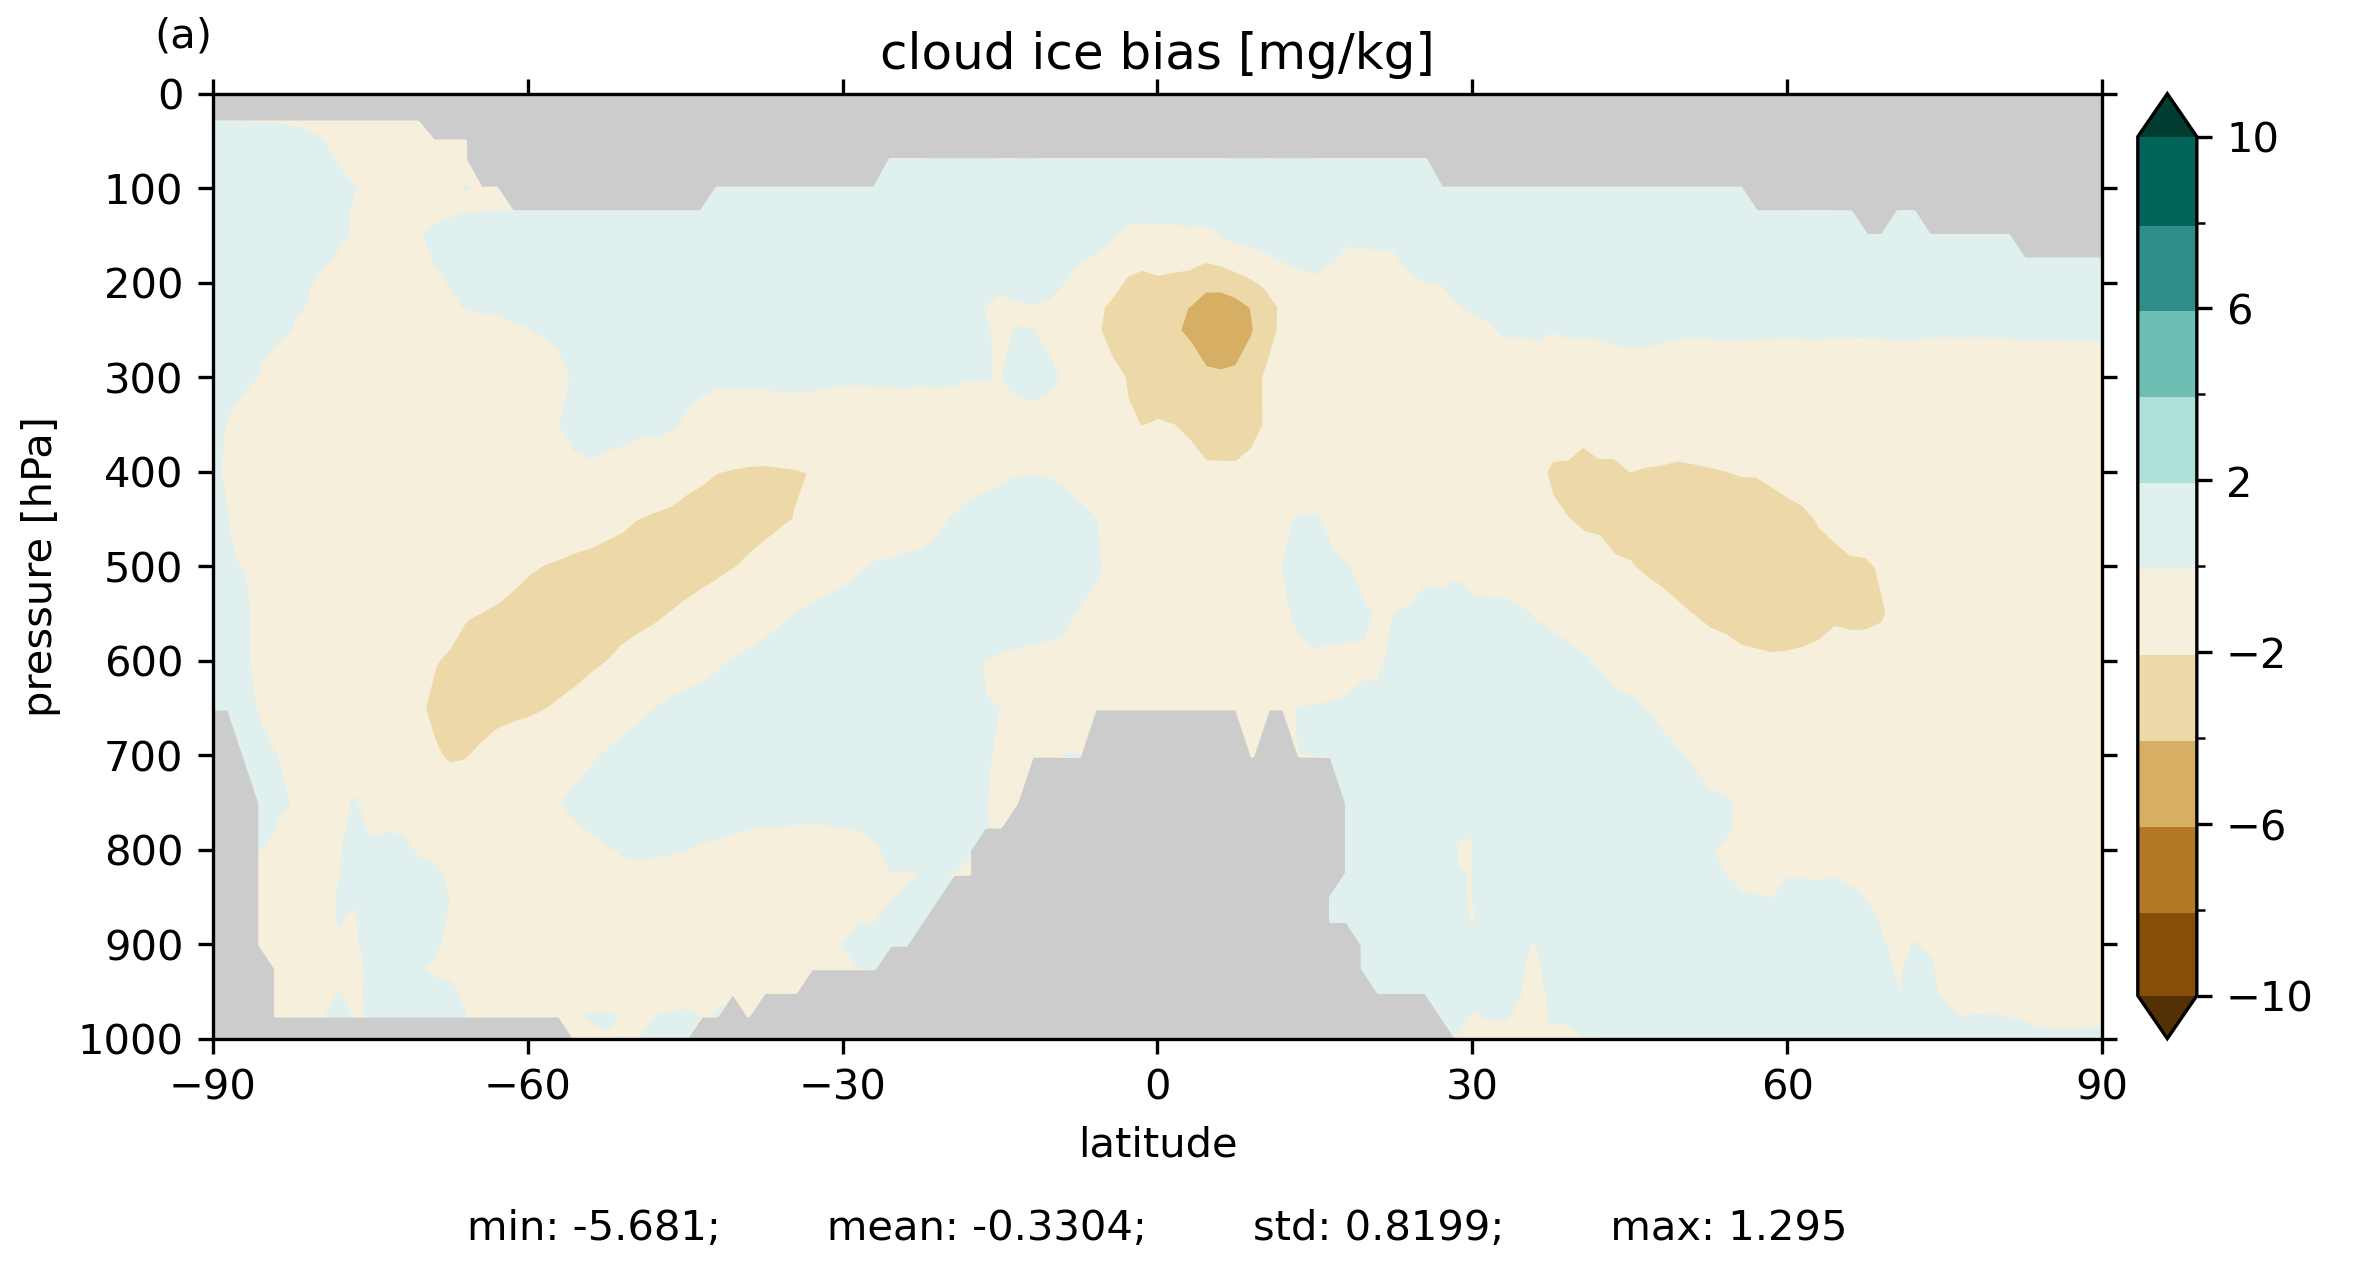
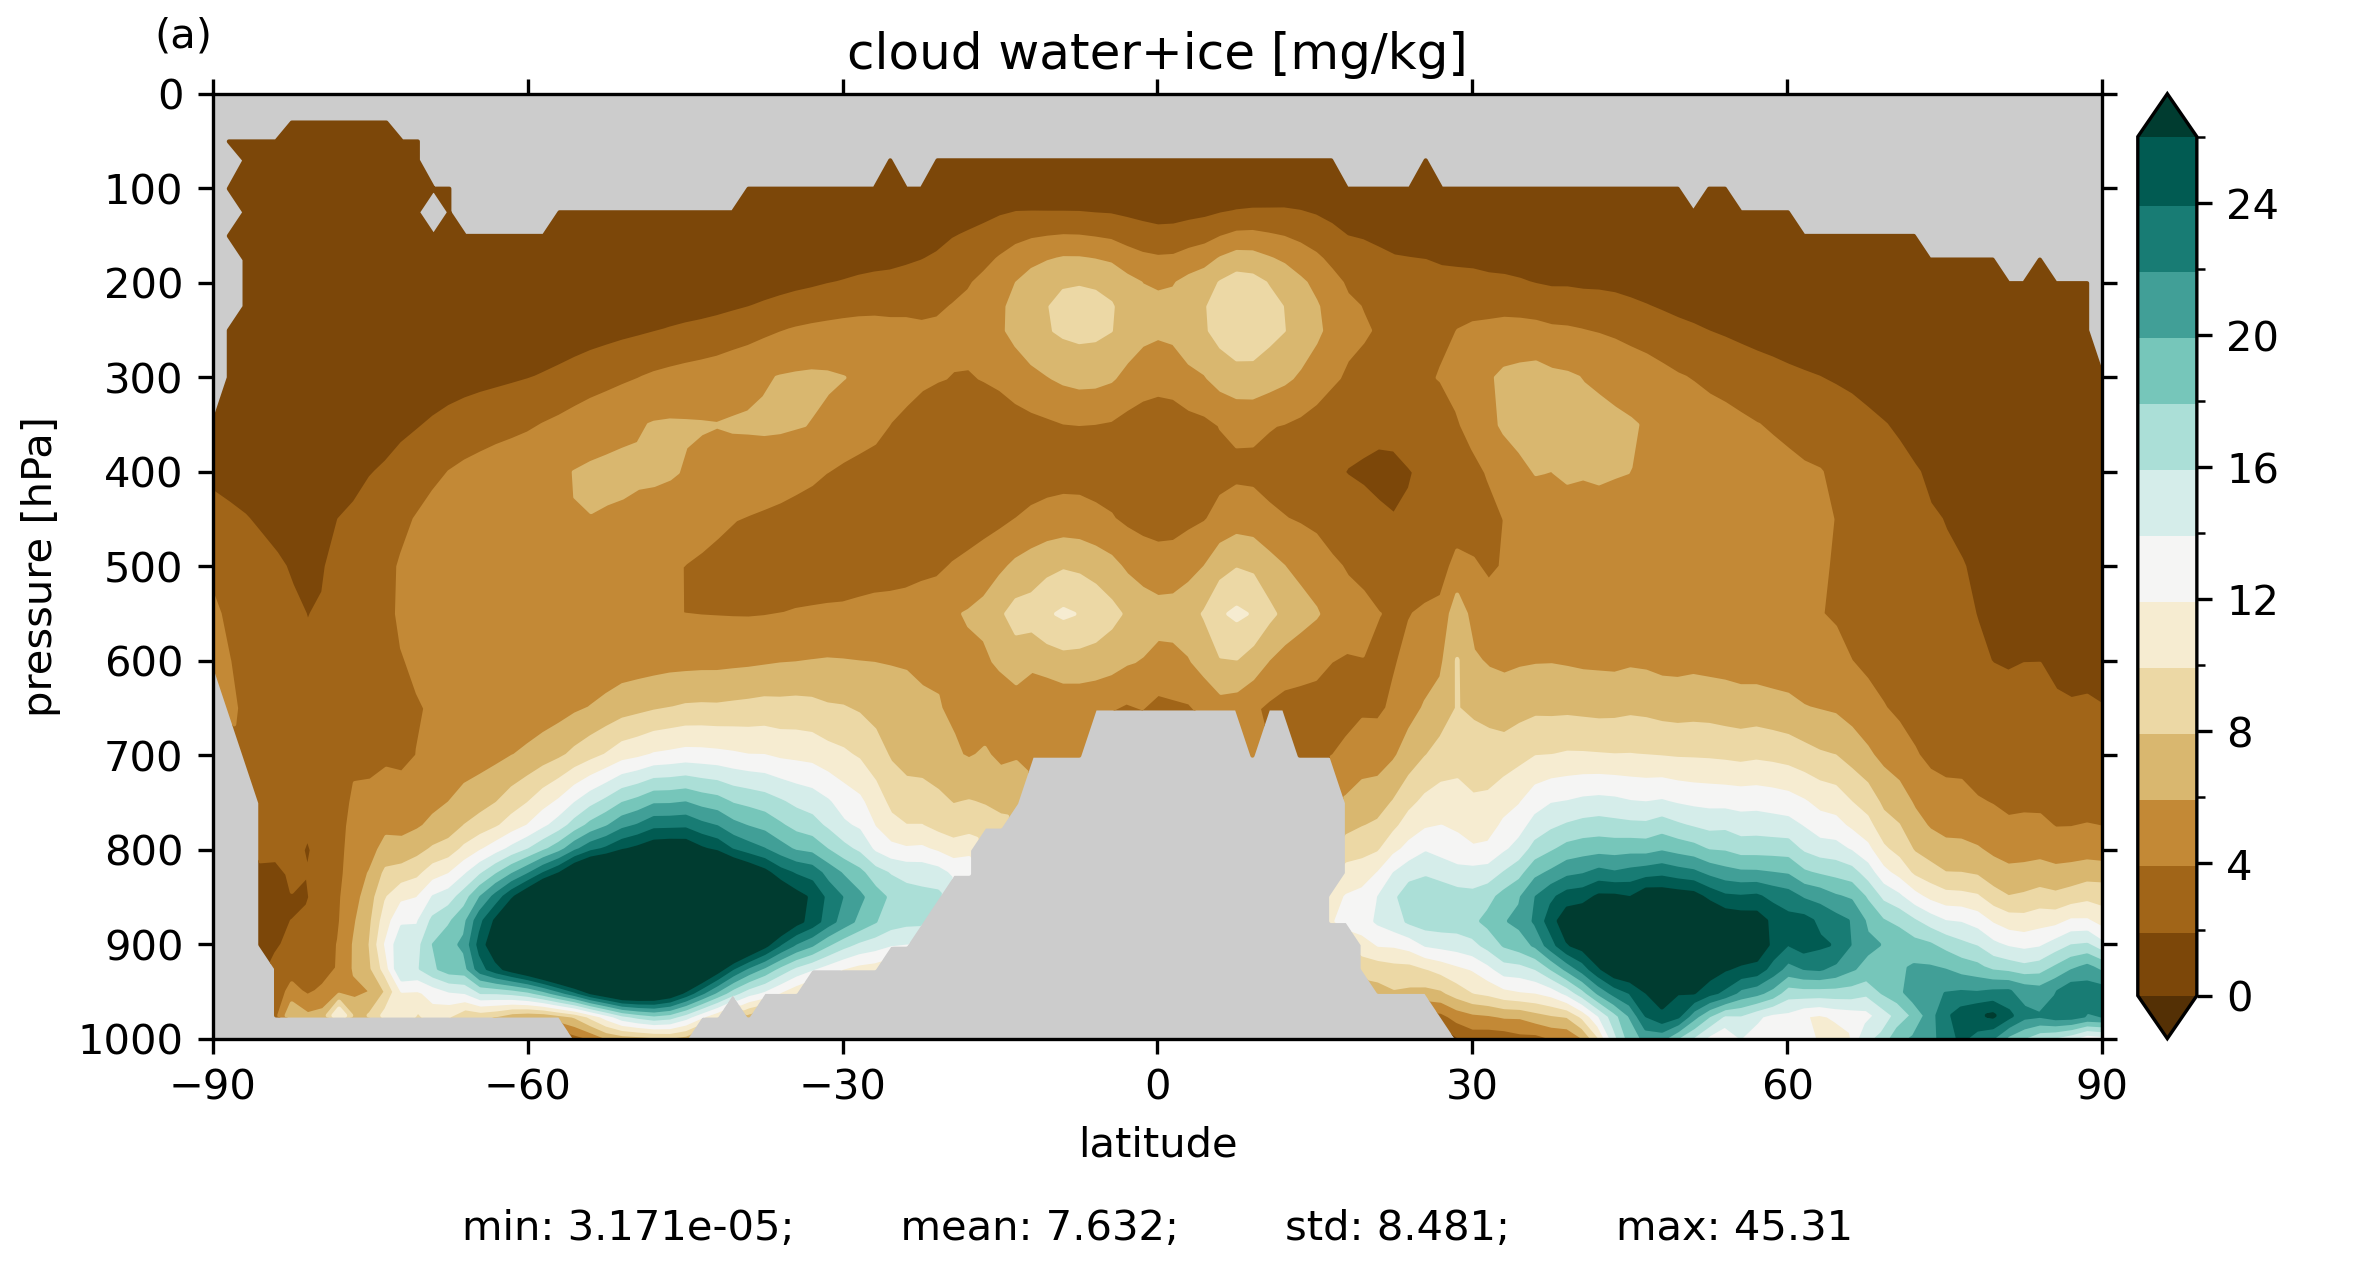
Atmosphere zonal averages
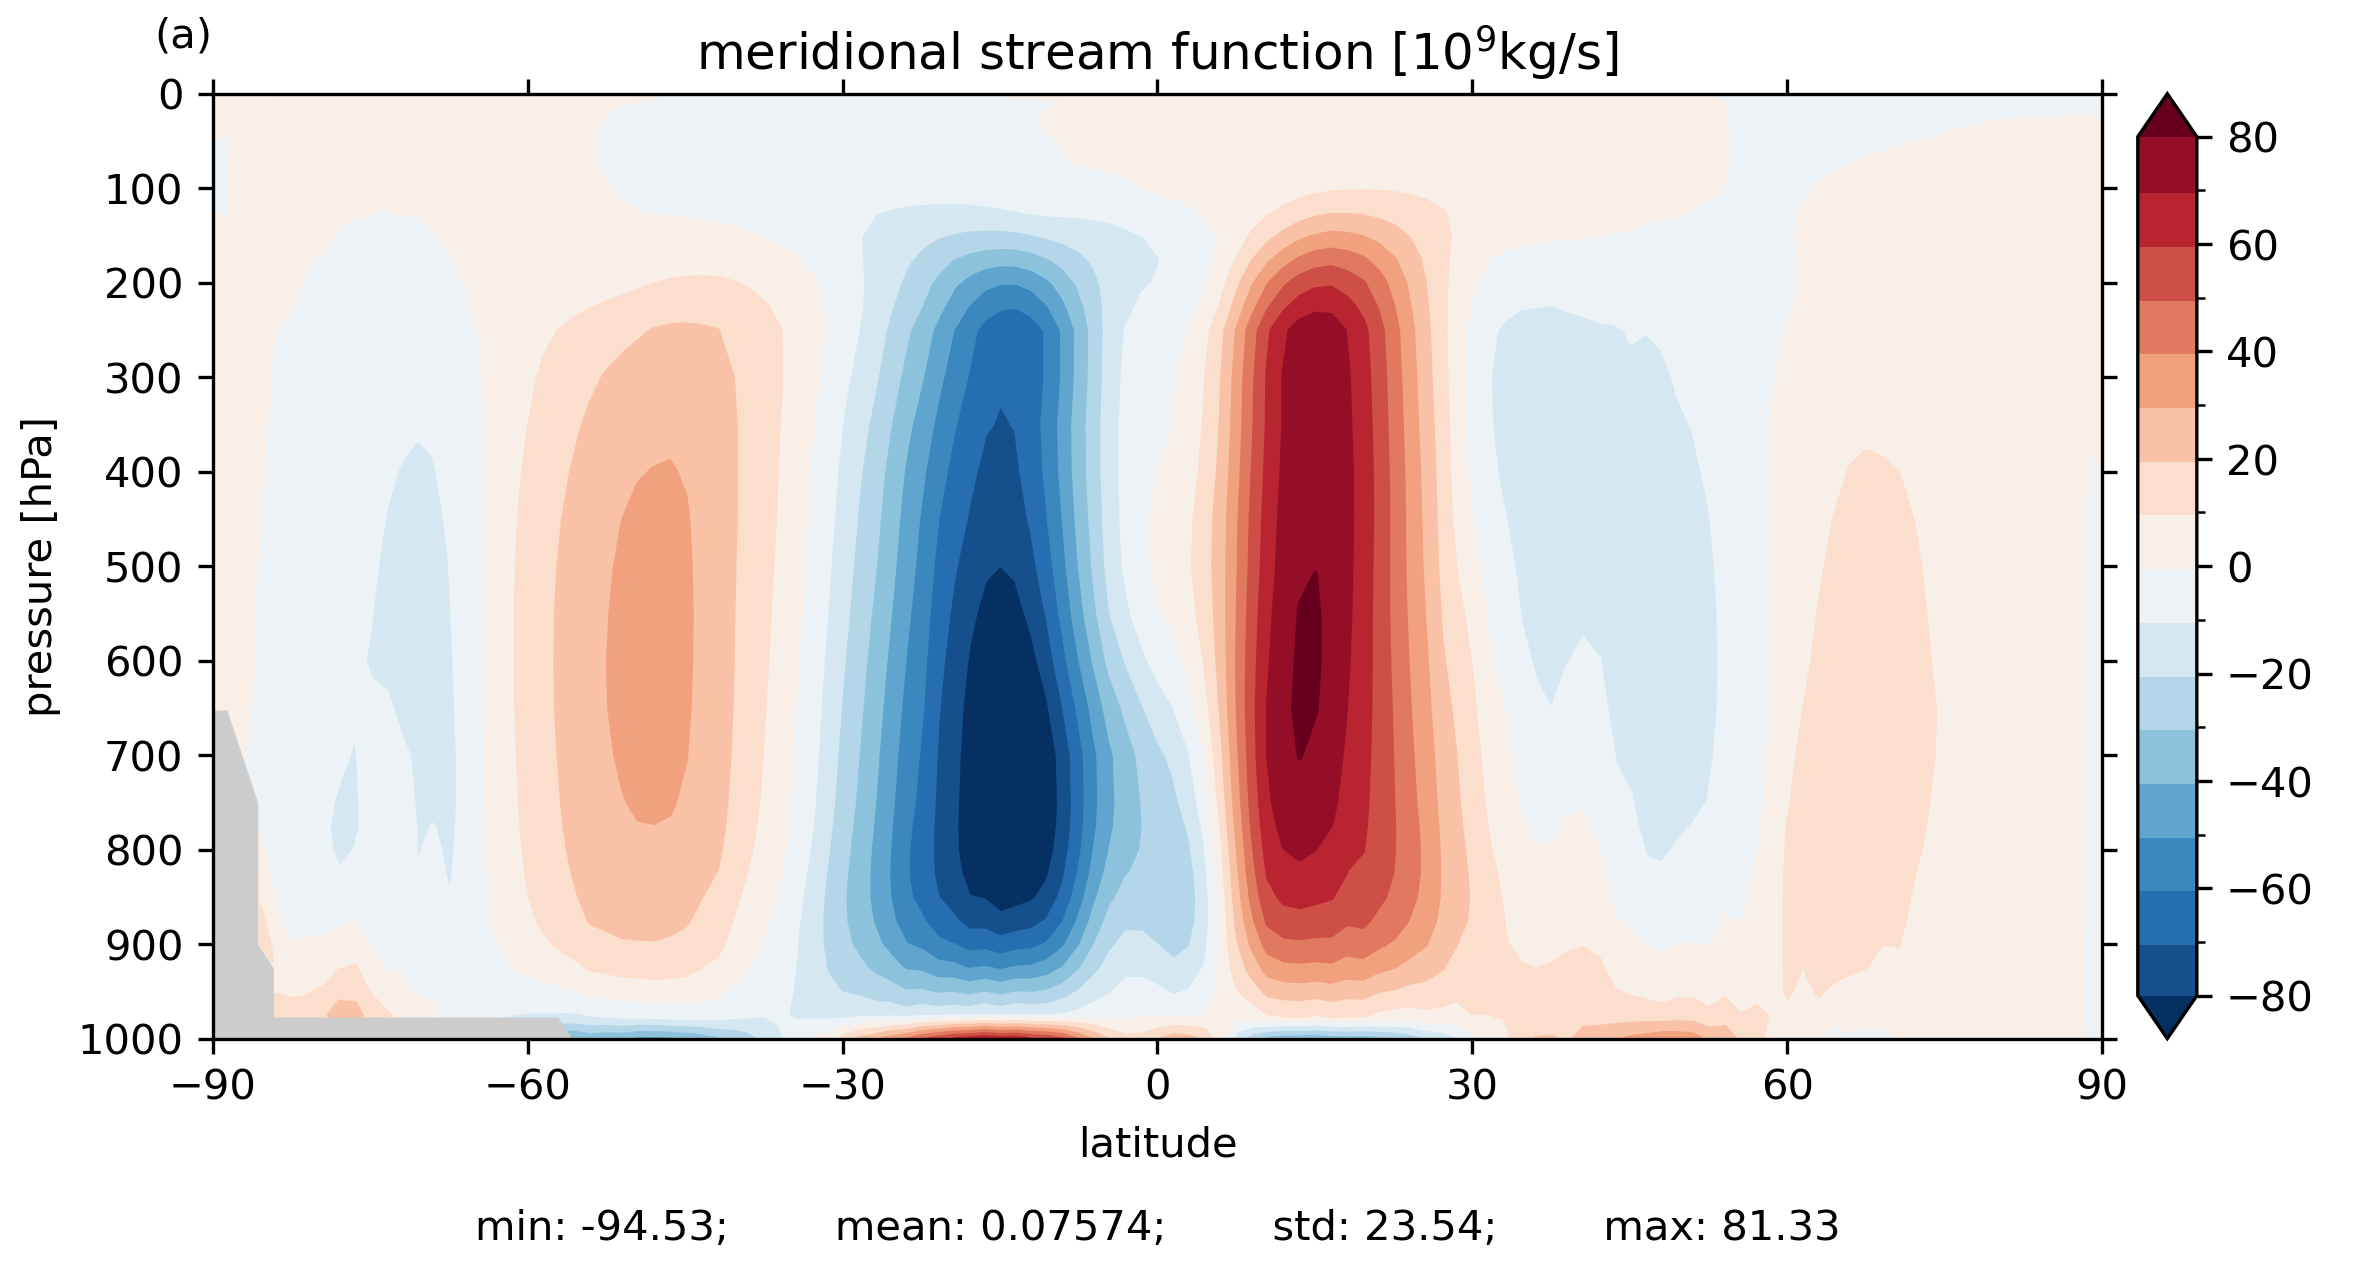
meridional stream function